
In itia tin g C o ve ra ge Ajanta Pharma Ltd.
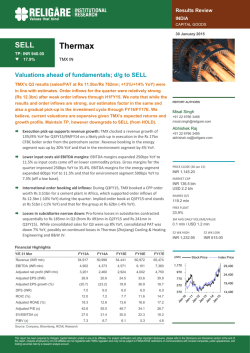
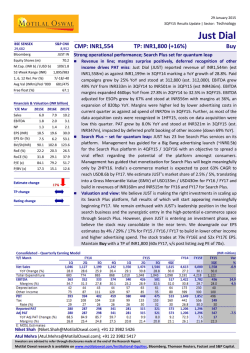
Ajanta Pharma Ltd. 4 Recommendation HOLD CMP (28/1/2015) Rs. 2680 Target Price Rs. 2870 Sector Pharmaceuticals Stock Details BSE Code 532331 NSE Code AJANTPHARM Ajanta Pharma (APL) posted yet another stellar result with higher than expected EBITDA margins at 36.2% v/s 32.8%qoq/33.0% yoy. This is the the highest ever margins in the history of the company. Key reason for the improvement is the higher contribution from branded business (as against institution business which is stagnant due to the new tender rule). Sales has come in-line of expectations at Rs 362.6 cr, a growth of 20.5%. The management has maintained its full year sales growth guidance of 20% with higher EBITDA margins of 32-33% (earlier it was 30%). Bloomberg Code AJP IN Key Highlights Market Cap (Rs cr) 9,429 Free Float (%) 26.17 52- wk HI/Lo (Rs) Initiating Coverage Margins Surprise 2749/901 Avg. volume NSE (Quarterly) 54,530 Face Value (Rs) 5.0 Dividend (FY 14) 200% Shares o/s (Cr) 2.36 Relative Performance 1Mth 3Mth 1Yr Ajanta Sensex 12.8% 43.3% 185.3% 8.5% 10.0% 42.9 Shareholding Pattern Promoters Holding st 31 Dec 14 73.83 Domestic markets grew by 36.1% yoy, much higher than industry average and its peers led by all around healthy growth like in Cardio (37% yoy), Dermatology (15%) and Ophthalmology (37%) segments. The company has launched six products in the domestic segment including two first to market. Management has reiterated its stance of growing deeper in the existing therapies and not intended to foray into any new therapy as of now. Exports to Emerging Markets posted growth of 15% yoy, backed by 25% growth in Asia and 4% in Africa (sales was impacted due to new rule of tender business). APL has launched 8 new products in the emerging markets and has a strong pipeline of 1672 products under registration to ensure the continued growth. The company has maintained its share in the Risperidone product (only product launched in US) and got Rs 1 cr of sales from it in Q3FY15 (YTD Rs 3 cr). It expects to garner around $1mn revenues in next year. Albeit small, we believe it is a start of revenues from regulated markets. We expect FY17 to be meaningful year for the company in terms of US revenues. APL’s Dahej formulation facility’s (Rs 196 cr spent) construction is completed and is undergoing qualification. The company expects regulatory filing batches to commence from Q1FY16. Savli facility (Rs 180 cr capex, spent Rs 15 cr) construction is marginally delayed and expected to start now from Q1FY16 and likely to be completed by Q4FY17. The company has announced stock split from Rs 5 FV to Rs 2 FV. Institutional (Incl. FII) 8.76 Valuation & Recommendation Corporate Bodies 1.88 We have factored in 21% growth with 32% EBITDA for FY15 (against 30% earlier assumption). The company has healthy balance sheet (debt:equity is 0.13x) and strong return ratios (more than 35%). The stock has re-rated substantially in last four years. The growth momentum and improving profitability gives comfort gives support to our long term outlook, however, due to stretched valuations (24.5x on FY16E) we recommend investors to book partial profits at current levels and HOLD balance for long term for price target of Rs 2870 (22x of FY17E EPS) Public & others 15.53 Runjhun Jain 022 – 39268177 Sr. Research Analyst [email protected] Year Consolidated Sales (Rs cr) Growth (%) EBITDA (Rs cr) Margin (%) PAT (Rs cr) Margin (%) EPS (Rs) P/E (x) RoE (%) FY14A FY15E FY16E FY17E 1208.3 1461.1 1780.2 2185.4 29.8% 20.9% 21.8% 22.8% 368.8 467.7 574.7 709.9 30.5% 32.0% 32.3% 32.5% 233.9 297.9 372.4 458.1 19.4% 20.4% 20.9% 21.0% 66.5 84.7 105.9 130.3 40.3 31.7 25.3 20.6 47.4% 41.6% 37.5% 34.3% 1|Page Ajanta Pharma Ltd. Initiating Coverage Quarterly Result Standalone (Rs cr) Net sales Cost of Materials Staff cost Other Exps Total Expenses EBITDA margins Depreciation EBIT Interest Other income Exchange gain/(loss) PBT Tax Tax rate PAT Equity Capital FV EPS Q3FY15 362.6 100.3 48.2 82.7 231.2 131.4 36.2% 12.6 118.8 1.2 3.6 Q3FY14 300.9 91.5 38.4 71.8 201.6 99.2 33.0% 9.5 89.7 2.2 4.0 yoy 20.5 9.7 25.5 15.2 14.6 32.4 2.7 123.9 39.2 31.6% 84.7 17.7 5.0 24.0 -2.0 89.6 27.2 30.3% 62.4 17.7 5.0 17.7 -232.5 38.3 44.3 Q3FY15 Africa Asia 32.7 32.4 -45.0 -10.2 Q2FY14 337.3 96.7 44.5 85.4 226.6 110.7 32.8% 12.2 98.5 1.3 14.7 qoq 7.5 3.8 8.2 -3.2 2.0 18.7 3.2 20.6 -10.4 -75.4 124.6 9.5 13.7 35.7 1.2 113.1 34.5 30.5% 78.6 17.7 5.0 22.2 Q3FY14 yoy Q2FY14 qoq 110 115 -4.3% 112 -1.8% 109 78 39.7% 101 7.9% 4 2 100.0% 3 33.3% Total Exports 223 195 14.4% 216 3.2% Doemstic 132 97 36.1% 114 15.8% Others 7.6 8.9 -14.5% 7.3 3.7% 362.6 300.9 20.5% 337.3 7.5% 35.7 7.7 7.7 Revenue Breakup Particulars (Rs cr) Latam Total Sales 2|Page Ajanta Pharma Ltd. Forward PE Chart 27x 22x 17x Initiating Coverage 12x 3|Page Ajanta Pharma Ltd. Initiating Coverage Financials (consolidated) P&L (Rs. Cr) Net Sales % change EBITDA EBITDA margin Depn & Amort Operating income Interest Other Income PBT Tax MI & EO PAT PAT margin (%) Sh o/s - Diluted Adj EPS Cash EPS Qtrly-Stdalone Revenue EBITDA Dep & Amorz Op Income Interest Other Inc. PBT Tax EO PAT EPS (Rs.) Performance Ratio EBITDA margin (%) EBIT margin (%) PAT margin (%) ROE (%) ROCE (%) FY14A 1208.3 29.8% 368.8 30.5% 43.9 324.9 11.6 10.8 329.9 96.0 0.0 233.9 19.4% 3.5 66.5 79.0 Mar.14 311.1 112.3 14.9 97.4 2.2 3.0 96.5 26.4 0.0 70.1 19.8 FY14A 30.5% 26.9% 19.4% 47.4% 54.1% FY15E 1461.1 20.9% 467.7 32.0% 48.6 419.0 9.7 14.0 423.3 125.4 0.0 297.9 20.4% 3.5 84.7 98.6 June.14 287.5 78.7 12.0 66.7 1.4 8.6 73.9 26.2 0.0 47.7 13.5 FY15E 32.0% 28.7% 20.4% 41.6% 51.3% FY16E 1780.2 21.8% 574.7 32.3% 55.4 519.3 8.2 18.0 529.1 156.7 0.0 372.4 20.9% 3.5 105.9 121.7 Sept.14 337.3 110.7 12.2 98.5 1.3 14.7 113.1 34.5 0.0 78.6 22.2 FY16E 32.3% 29.2% 20.9% 37.5% 48.8% FY17E 2185.4 22.8% 709.9 32.5% 75.6 634.3 6.6 21.0 648.6 192.2 0.0 456.5 20.9% 3.5 129.8 151.3 Dec.14 362.6 131.4 12.6 118.8 1.2 3.6 123.9 39.2 0.0 84.7 24.0 FY17E 32.5% 29.0% 20.9% 34.2% 46.0% PAT growth (%) 108.6% 27.4% 25.0% 22.6% Debt/Equity (x) 0.2 0.1 0.1 0.0 FY14A 40.3 4.5 7.9 25.8 FY15E 31.7 3.2 6.5 20.3 FY16E 25.3 2.3 5.3 16.3 FY17E 20.7 1.8 4.2 12.8 Valuation Ratio Price Earnings (x) Price/BV (x) EV / Sales EV / EBITDA Balance Sheet (Rs Cr) Share Capital Reserves & Surplus Net Worth Net Deferred Tax Liab FY14A 17.7 575.6 593.3 23.0 Other Non-Current Li a b. 2.5 Total Loans 130.5 Tra de Pa ya bl es Prov. & Other CL Total Liabilities Net Fixed Assets Capital WIP Investments Cash & Bank Invetories Debtors Loans & Advances Total Assets Cash Flow (Rs. Cr) Op CF before tax Change in WC Tax CF from Operation Investing Capex Oth Inc & Investments CF from Investing Financing Diviend Paid Share Capital Loans Interest Others CF from Financing Net Chg. in Cash Cash at beginning Cash at end Per Share Data Adj EPS BV per share Cash per share Dividend per share FY15E 17.7 821.9 839.5 23.0 2.5 112.9 FY16E 17.7 1129.8 1147.4 23.0 2.5 92.9 FY17E 17.7 1507.1 1524.8 23.0 2.5 72.9 124.5 75.5 149.8 75.5 182.6 75.5 224.5 75.5 949.4 279.4 93.6 63.5 60.4 155.4 202.2 94.9 949.4 FY14A 371.7 -102.7 -96.0 173.0 1203.2 280.8 250.0 63.5 37.0 194.8 243.5 133.6 1203.2 FY15E 467.7 -94.1 -125.4 248.1 1523.9 375.4 250.0 63.5 130.4 247.2 296.7 160.7 1523.9 FY16E 574.7 -99.9 -156.7 318.1 1923.1 599.8 0.0 63.5 397.0 303.5 364.2 195.1 1923.1 FY17E 709.9 -116.4 -192.2 401.3 -132.9 10.8 -122.1 -206.5 14.0 -192.5 -150.0 18.0 -132.0 -50.0 21.0 -29.0 -41.1 5.9 5.7 -8.7 1.6 -36.8 14.2 46.2 60.4 FY14A 66.5 168.7 17.2 10.0 -51.7 0.0 -17.6 -9.7 0.0 -79.0 -23.3 60.4 37.0 FY15E 84.7 238.8 10.5 12.6 -64.5 0.0 -20.0 -8.2 0.0 -92.7 93.4 37.0 130.4 FY16E 105.9 326.3 37.1 15.8 -79.2 0.0 -20.0 -6.6 0.0 -105.8 266.5 130.4 397.0 FY17E 129.8 433.7 112.9 19.4 4|Page Initiating Coverage Ajanta Pharma Ltd. Disclaimer: This Document has been prepared by Nirmal Bang Research (A Division of Nirmal Bang Securities PVT LTD). The information, analysis and estimates contained herein are based on Nirmal Bang Research assessment and have been obtained from sources believed to be reliable. This document is meant for the use of the intended recipient only. This document, at best, represents Nirmal Bang Research opinion and is meant for general information only. Nirmal Bang Research, its directors, officers or employees shall not in anyway be responsible for the contents stated herein. Nirmal Bang Research expressly disclaims any and all liabilities that may arise from information, errors or omissions in this connection. This document is not to be considered as an offer to sell or a solicitation to buy any securities. Nirmal Bang Research, its affiliates and their employees may from time to time hold positions in securities referred to herein. Nirmal Bang Research or its affiliates may from time to time solicit from or perform investment banking or other services for any company mentioned in this document. Nirmal Bang Research (Division of Nirmal Bang Securities Pvt Ltd) B-2, 301/302, Marathon Innova, Opp. Peninsula Corporate Park Off. Ganpatrao Kadam Marg Lower Parel (W), Mumbai-400013 Board No : 91 22 3926 8000/8001 Fax : 022 3926 8010 5|Page

© Copyright 2026