
Just Dial - Business Standard
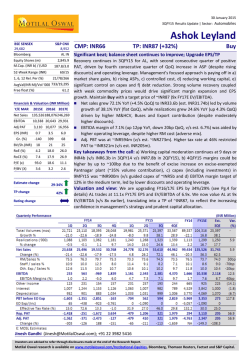
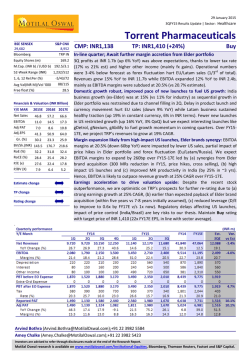
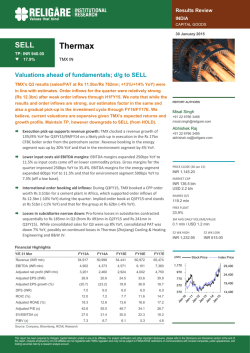
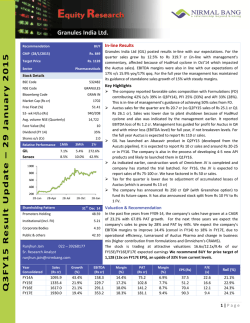
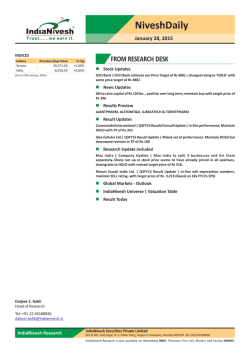
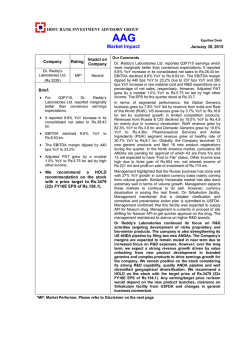
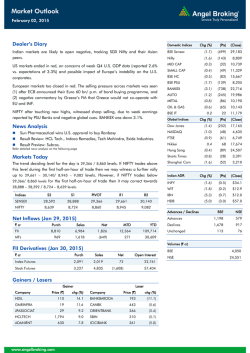
29 January 2015 3QFY15 Results Update | Sector: Technology Just Dial BSE SENSEX 29,682 Bloomberg S&P CNX 8,952 JUST IN Equity Shares (m) 70.2 M.Cap. (INR b) / (USD b) 1,895/983 1, 6, 12 Rel. Per (%) 7/-18/-40 681/475 Free float (%) 67.1 Financials & Valuation (INR billion) Y/E Mar 2015E 2016E 2017E Sales 6.0 7.9 10.2 EBITDA 1.8 2.0 3.1 NP 1.3 1.4 2.1 EPS (INR) EPS Gr (%) GG h BV/Sh(INR) 18.5 19.6 30.0 7.5 6.2 53.1 90.1 102.8 123.6 RoE (%) 22.2 20.3 26.5 RoCE (%) 31.8 29.1 37.9 P/E (x) 84.1 79.2 51.7 P/BV (x) 17.3 15.1 12.6 Estimate change TP change Rating change TP: INR1,800 (+16%) Buy Strong operational performance; Search Plus set for quantum leap 109/1.8 52-Week Range (INR) Avg Val (INRm)/Vol ‘000 CMP: INR1,554 17% Revenue in line; margins surprise positively, deferred recognition of other income drives PAT miss: Just Dial (JUST) reported revenue of INR1,544m (est INR1,558m) as against INR1,199m in 3QFY14 marking a YoY growth of 28.8%. Paid campaigns grew by 25% YoY and stood at 312,800 (est. 312,000). EBITDA grew 49% YoY from INR333m in 3QFY14 to INR501m in 3QFY15 (est INR436m). EBITDA margins expanded 460bps YoY from 27.8% in 2QFY14 to 32.5% in 3QFY15. EBITDA adjusted for ESOPs grew by 67% and stood at INR556m with margins at 36%, an expansion of 820bp YoY. Margins were higher led by lower advertising costs in current quarter as against ad spend of INR70m in 3QFY15. Further, as most of the data acquisition costs were recognized in 1HFY15, costs on data acquisition were low this quarter. PAT grew by 8.0% YoY and stood at INR321m in 3QFY15 (est. INR347m), impacted by deferred profit booking of other income (down 69% YoY). Search Plus – set for quantum leap: JUST has 23 live Search Plus services on its platform. Management has guided for a Big Bang advertising launch (~INR0.5b) for the Search Plus platform in 4QFY15 / 1QFY16 with an objective to spread a viral effect regarding the potential of the platform amongst consumers. Management has guided that monetization for Search Plus will begin meaningfully only by 2HFY16. India’s e-commerce market is expected to post 63% CAGR to reach USD8.6b by FY17. We estimate JUST’s market share of 2.5% / 5%, translating into a Gross Mercantile Value (GMV) of USD133m / USD430m for FY16 / FY17 and build in revenues of INR160m and INR515m for FY16 and FY17 for Search Plus. Valuation and view: We believe JUST is making the right investments in scaling up its Search Plus platform, full results of which will start appearing meaningfully beginning FY17. We remain enthused with JUST’s leadership position in the local search business and the synergistic entry in the high-potential e-commerce space through Search Plus. However, given JUST is entering an investment phase, we believe the stock may consolidate in the near term. We downgrade our EPS estimates by 4% / 29% / 17% for FY15 / FY16 / FY17 to build in lower other income and higher advertising spend. The stock trades at 79x FY16E and 52x FY17E EPS. Maintain Buy with a TP of INR1,800 (60x FY17, v/s post listing avg PE of 70x). Niket Shah ([email protected]); +91 22 3982 5426 Atul Mehra ([email protected]); +91 22 3982 5417 Investors are advised to refer through disclosures made at the end of the Research Report. Motilal Oswal research is available on www.motilaloswal.com/Institutional-Equities, Bloomberg, Thomson Reuters, Factset and S&P Capital. Just Dial Revenue growth in-line, Margins beat estimates Just Dial (JUST) reported revenue of INR1,544m (est INR1,558m) as against INR1,199m in 3QFY14 marking a YoY growth of 28.8%. Volume growth during the quarter stood at 25%, Premium listings formed 20% of total campaigns and 45% of revenues. This quarter had 5 days lesser working days as compared to 3QFY14, in the absence of which paid campaign additions would have been even stronger. EBITDA grew 49% YoY from INR333m in 3QFY14 to INR501m in 3QFY15 (est INR436m). EBITDA margins expanded 460bps YoY from 27.8% in 2QFY14 to 32.5% in 3QFY15 primarily led by decline in other expenses by 580bp. EBITDA adjusted for ESOPs grew by 67% and stood at INR556m with margins at 36%, an expansion of 820bp YoY. Margins were higher led by lower advertising costs in current quarter as against ad spend of INR70m in 3QFY15. Further, most of the data acquisition costs were recognized in 1HFY15, costs on this count were low this quarter. During the quarter, JUST granted 2.4 lakh stock options to employees at an exercise price of INR80/share, with vesting over a period of 4 to 7 years. ESOP expenses recognized in the quarter stood at INR55m. Other Income was down by 69% to INR34.6m in 3QFY15 from INR110.8m in 3QFY14 on account of deferred profit booking on investments. Cash stood at INR7.4b as at 3QFY15 as compared to INR6.0b as at 3QFY14. PAT grew by 8.0% YoY and stood at INR321m in 3QFY15 (est. INR347m). PAT growth was impacted by deferred profit booking of other income. Exhibit 1: Revenue trend Total Revenues (INR m) YoY Growth (%) 30.8 29.1 28.6 28.0 25.9 26.4 28.8 1,046 1,127 1,199 1,242 1,350 1,474 1,544 1QFY14 2QFY14 3QFY14 4QFY14 1QFY15 2QFY15 3QFY15 Source: Company, MOSL Exhibit 2: EBITDA trend Exhibit 3: PAT trend EBITDA (INR m) 34.7 363 31.3 352 EBITDA margins (%) 27.8 30.1 333 374 25.2 340 28.9 426 32.5 501 84.9 85.7 68.5 280 YoY Growth (%) 59.7 287 298 341 281 0.2 1QFY14 2QFY14 3QFY14 4QFY14 1QFY15 2QFY15 3QFY15 Source: Company, MOSL 29 January 2015 PAT (INR m) 315 9.9 321 8.0 1QFY14 2QFY14 3QFY14 4QFY14 1QFY15 2QFY15 3QFY15 Source: Company, MOSL 2 Just Dial Search Plus – set for quantum leap JUST has 23 Search Plus services live on its platform currently which includes services like online food delivery, groceries, doctors’ appointments, taxi bookings, online purchases of electronics, online recharge, movie ticketing, etc. Hotel reservation, movie tickets, online shopping, bus / flight ticketing – are some of the services that are witnessing strong traction as per management. JUST will launch JD Cash in April, 2015 and management guided that recent RBI regulations on payment banks will not impact JD Cash as it is intermediating. Except for some specific categories where e-commerce companies are excessively discounting, management suggests that prices of products on its platform are as competitive as those on leading e-commerce portals. Management has guided for a Big Bang advertising launch of the Search Plus platform in 4QFY15 / 1QFY16 with an objective to spread a viral effect regarding the potential of the platform. Monetization will begin meaningfully by 2HFY16. Even as management highlighted that they haven’t finalized their budgets for the Big Bang ad spend, we believe this would entail advertising spend of INR0.5b. We’ve factored in the impact of this ad spend in our FY16 forecasts as we believe the launch in 1QFY16 is more likely as against 4QFY15. Search Plus – mapping revenue potential for JUST We highlight below the revenue potential for JUST’s Search Plus business. India’s e-commerce market is expected to grow to USD8.6b by FY17 (63% CAGR) We estimate JUST’s market share of 2.5% / 5%, translating into a Gross Mercantile Value (GMV) of USD133m / USD430m for FY16 / FY17. Assuming a blended gross margin of a modest 2% on GMV, we believe JUST can post revenues to the tune of USD2.7m / USD8.6m for FY16 / FY17. We thus build in revenues of INR159m and INR516m for FY16 and FY17 for JUST. Exhibit 4: India’s e-commerce market set to grow to USD8.6b by FY17 India's e-commerce market for physical goods (USD b) 8.6 5.3 0.8 FY13 2.0 FY14 3.2 FY15 FY16 FY17 Source: Accel estimates and industry sources Exhibit 5: Assessing Just Dial's revenues from Search Plus (INR m) Parameters E-commerce market size (USD b) JUST's market share (%) GMV (USD m) Gross margins on GMV (%) Potential revenues (USD m) Potential revenues (INR m) 29 January 2015 FY16 FY17 5.3 8.6 2.5% 5.0% 133 430 2% 2% 2.7 8.6 159 516 Source: Company, MOSL 3 Just Dial JUST to deploy unique evangelist program to drive adoption of Master App JUST is working on improving its Master App and will release a fully functional mobile application by March, 2015 with complete bouquet of services. The mobile app will also enable voice search through which users can easily find the product or service they’re looking for with a simple voice command. Given the increasing popularity of the mobile platform (>35% users accessing JUST through mobile currently), the management is focused on developing this channel aggressively, and aims to attract maximum number of users on its app. Currently, approximately 5m users have downloaded JUST’s mobile app, and JUST is registering ~12k downloads per day. Management believes that adding users organically is the right way to go from a long term perspective; hence it has refrained from adding customers inorganically (like other e-commerce players who spend ~INR150/user download). JUST will thus be working on a unique evangelist program wherein free lancers will be educating consumers on the richness and functionality of the mobile application. This will be a one of the kind’s initiatives and management expressed high confidence in the model, even as they revealed minimal details. Management guided that evangelist program will be a continuing activity and not a one-off event for the company. International – focusing on content creation currently Management highlighted that content creation is the core focus area in the international business and monetization is not a near term objective. In terms of geographies, while in UK, the platform is active, management will look at launching the platform in Middle East in the coming quarter. JUST will have a single mobile app for all international countries and depending on the country, the app will provide country-specific local search automatically. JUST will be working on a differentiated strategy for the US business - for example – branding services as service magic – (plumbers, carpenters, etc). Employee growth at 6% YoY Total employees as of 3QFY15 stood at 9,226 as against 8,683 in 3QFY14 (6% YoY growth) and 8,899 employees in 2QFY15 (growth of 3.7% QoQ).. Management highlighted that they’ll end FY15 with an addition of 1,000 employees and will look at adding similar number of 1,000 employees in FY16. Exhibit 6: Total employees continue to rise Total employees 29.4 Exhibit 7: Average cost per employee to stabilize Avg. cost per employee (INR 000s) Growth in cost per employee % Growth % 27.4 23.1 20.9 12.0 20.0 11.9 10.0 12,404 7,497 FY13 11,277 6,201 FY12 10,252 4,868 FY11 8,543 3,763 3,058 10.0 FY10 FY14 FY15E FY16E FY17E Source: Company, MOSL 29 January 2015 8.6 7.7 14.0 FY09 11.0 175 196 219 236 FY09 FY10 FY11 FY12 8.0 308 8.0 332 8.0 359 262 285 FY13 FY14 FY15E FY16E FY17E Source: Company, MOSL 4 Just Dial Campaigns post strong growth Total listings stood at 14.7m in 3QFY15 vs 10.9m in 3QFY14, marking a YoY growth of 35%. (14.5m as of 2QFY15). Paid campaigns as of end of 3QFY15 stood at 312,800 (est. 312,000) as against and 249,500 campaigns in 3QFY14 (25% growth YoY) and 2,96,100 campaigns in 2QFY15 (5.6% growth QoQ). Tier II / III cities showed strong traction during the quarter, and contributed 10.5% to revenues this quarter. JUST’s proprietary search engine automatically takes care of price increase, hence management doesn’t plan to take a manual price increase like in FY14. JUST has more than 50m ratings and reviews on its platform as of 3QFY15 of which ratings form 95% and reviews form the balance 5%. Exhibit 8: Total number of business listings Exhibit 9: Paid campaign as a % of total listings No of business listings (m) 22.5 18.7 2.0 15.0 11.8 FY12 FY13 FY14 FY15E FY16E FY17E 62 120 171 207 262 FY10 FY11 FY12 FY13 FY14 Source: Company, MOSL Exhibit 10: Premium listing continue to rise Number of campaigns (in 000s) 22.0 21.0 Premium listings % 23.0 17,999 20,246 25,668 262 Growth% 21.0 2.4 -11.1 19,686 FY11 FY15E FY16E FY17E Avg. realization per campaign per year (INR) 6.8 171 517 Exhibit 11: Average realization per campaign to moderate 19,219 120 416 Source: Company, MOSL 16.0 207 330 FY12 FY13 FY14 3.0 2.0 2.0 21,096 FY11 1.4 9.1 20,682 FY10 7.2 2.3 20,276 6.0 4.5 No of campaigns (in 000s) Paid campaigns as % of total listings 2.4 2.3 2.2 2.2 2.2 -21.1 FY12 FY13 FY14 FY10 FY11 Source: Company, MOSL FY15E FY16E FY17E Source: Company, MOSL No acquisition or fund raising plan for FY16 In 2QFY15, JUST board has passed an enabling resolution to raise INR10b. However, JUST management clarified that it was only an enabling resolution and there are no acquisition or fund raising plans on the anvil for FY16. Other conference call highlights 29 January 2015 JUST plans to shortly launch a cloud solution B2B platform for businesses. Reverse auction queries are currently witnessing 60% conversion. JD Guarantee promises 7 hour delivery guarantee across 15k unique products – vendors for this service are carefully hand-picked to ensure timely delivery. 5 Just Dial Valuation and view We value JUST at 60x FY17E EPS, versus post listing average multiple of 70x, which we believe is justified considering: High entry barriers ensure limited competition JUST is the leader in India’s local search business and enjoys a strong first-mover advantage. It has a database of 14.7m listings spread across ~2,000 Indian cities as on 3QFY15, significantly ahead of competitors. We believe the biggest strength of JUST is maintenance of its database by keeping it updated and accurate through un-paralleled feet-on-street strength (~9,000 employees as of 3QFY15), its ability to develop direct and personal relationships with SMEs and its unique voice-based search infrastructure, which is difficult to replicate by competitors. Strong growth potential for India’s local search business We believe JUST has significant growth potential as at 14.7m listings, it has still tapped less than 50% of the India’s overall base of 32m SMEs. Further, opportunity in terms of monetization is huge given only 2% of JUST’s listings are paid listings, and less than 1% of India’s SME base of 32m small businesses are paid advertisers on its platform. JUST’s proprietary pricing algorithms to set the price range for various membership packages depending on the keyword and locality as well as its unique mechanism of offering monthly/weekly payment packages ensure high affordability for SME’s which should drive higher monetization going forward. Search Plus, a game changer – Synergistic move, from search to transactions JUST has extended its offerings from search to transactions with launch of a host of services under the JD Search Plus platform. JUST currently has 23 products under ‘Search Plus’ which includes online food delivery, groceries, wine delivery, doctors’ appointments, taxi bookings, online purchases of electronics, etc. Further, JUST is launching a plethora of new products like ‘Just Dial Guaranteed’, ‘Just Dial Cash’, Online cab booking, etc which we believe will take the Search Plus platform to a completely different league. Management plans to aggressively advertise to create a viral impact for these recent launches. We believe given strong relationships enjoyed by JUST with SMEs, it is best placed to capture the off-line to on-line ecommerce opportunity with its foray into enabling transactions on its platform. Exhibit 12: Price to earnings (One year forward) 100 90 80 70 60 50 40 30 P/E (x) Exhibit 13: Price to book (One year forward) 18.0 1 Yrs Avg(x) 70.3 79.1 P/B (x) 1 Yrs Avg(x) 14.2 13.9 14.0 10.0 Source: Company, MOSL Jan-15 Dec-14 Oct-14 Aug-14 Jun-14 May-14 Mar-14 Jan-14 Dec-13 Oct-13 Aug-13 Jun-13 Jan-15 Dec-14 Oct-14 Aug-14 Jun-14 May-14 Mar-14 Jan-14 Dec-13 Oct-13 Aug-13 Jun-13 6.0 Source: Company, MOSL We value the stock at 60x FY17E EPS and arrive at a target price of INR1800 – 16% upside. Maintain Buy rating. 29 January 2015 6 Just Dial Service offered on Just Dial Platform Exhibit 14: Online table booking Source: Company, MOSL 29 January 2015 7 Just Dial Exhibit 15: Get quotes for Samsung mobile Source: Company, MOSL Exhibit 16: Bus booking on Just Dial Source: Company, MOSL 29 January 2015 8 Just Dial Story in charts Exhibit 17: Total number of business listings Exhibit 18: Paid campaign as a % of total listings No of business listings (m) 22.5 18.7 2.0 15.0 11.8 7.2 FY12 FY13 FY14 FY15E FY16E FY17E 62 120 171 207 262 FY10 FY11 FY12 FY13 FY14 Source: Company, MOSL Exhibit 19: Premium listing continue to rise FY15E FY16E FY17E Avg. realization per campaign per year (INR) -11.1 19,686 2.4 19,219 17,999 20,246 25,668 262 207 Growth% 21.0 6.8 120 517 Source: Company, MOSL 16.0 171 416 Exhibit 20: Average realization per campaign to moderate Premium listings % 23.0 Number of campaigns (in 000s) 22.0 21.0 330 FY12 FY13 FY14 3.0 2.0 -21.1 FY11 FY12 FY13 FY14 FY10 FY11 Exhibit 21: Search Plus to drive e-commerce sales for JUST India's e-commerce market for physical goods (USD b) FY15E FY16E FY17E Source: Company, MOSL Source: Company, MOSL Exhibit 22: JUST has a robust cash generating business model Cash flow from operations (INR m) Free cash flows (INR m) 8.6 2,909 2,509 5.3 0.8 FY13 2.0 FY14 3.2 FY15 601 359 409 260 FY16 FY17 Source: Company, MOSL 29 January 2015 2.0 21,096 FY11 1.4 20,682 FY10 2.3 9.1 20,276 6.0 4.5 No of campaigns (in 000s) Paid campaigns as % of total listings 2.4 2.3 2.2 2.2 2.2 FY10 FY11 957 726 1,023 FY12 FY13 1,330 1,599 1,121 1,199 1,800 1,400 662 FY14 FY15E FY16E FY17E Source: Company, MOSL 9 Just Dial Corporate profile: Just Dial Company description Exhibit 23: Sensex rebased Just Dial Ltd (JUST) is one of the leading local search engines in India. It provides users with information and user reviews from its database of local businesses, products and services across India. Its search service is available to users through multiple platforms: Internet, mobile Internet, telephone (voice) and text (SMS). JDL is a well known and established brand on the Internet and through its easy to remember phone numbers (88888 88888 and 6999 9999) and user friendly mobile phone interface, it attained significant mind share with users for their local search needs. Exhibit 24: Shareholding pattern (%) Promoter Exhibit 25: Top holders Dec-14 Sep-14 Dec-13 32.9 33.0 33.0 DII 4.7 4.6 5.5 FII 27.4 26.6 23.0 Others 35.0 35.8 38.5 Holder Name % Holding Saif II Mauritius Company Ltd Tiger Global Four JD Holdings Tiger Global Five Indian Holdings Sequoia Capital India Investments III SCI Growth Investments II 8.6 8.2 5.1 4.7 4.3 Note: FII Includes depository receipts Exhibit 26: Top management Exhibit 27: Directors Name Designation Name Name Venkatachalam Sthanu Subramani Managing Director Venkatachalam Sthanu Subramani Shailendra Jit Singh Sanjay Bahadur Ravi Chandra Adusumalli Malcolm Monteiro Ramani Iyer Anand Balasundaram Venkata Challam Krishnan *Independent Exhibit 28: Auditors Exhibit 29: MOSL forecast v/s consensus Name Type S R Batliboi & Associates LLP Statutory 29 January 2015 EPS (INR) FY15 FY16 FY17 MOSL forecast 18.5 19.6 30.0 Consensus forecast 19.9 29.7 41.6 Variation (%) -7.0 -33.9 -27.9 10 Just Dial Key assumptions Exhibit 30: Annual metrics Particulars No of business listings (m) No of campaigns Paid campaigns as % of total listings Average realization per campaign per year (INR) FY10 FY11 FY12 FY13 FY14 FY15E FY16E FY17E 4.5 6.0 7.2 9.1 11.8 15.0 18.7 22.5 61,500 120,200 171,000 206,500 262,150 329,692 415,862 517,017 1.4% 2.0% 2.4% 2.3% 2.2% 2.2% 2.2% 2.3% 25,668 20,246 17,999 19,219 19,686 20,276 20,682 21,096 0.0% 33.3% 20.0% 26.4% 29.7% 27.0% 25.0% 20.0% Growth YoY Listings growth YoY Campaign growth YoY 51.9% 95.4% 42.3% 20.8% 26.9% 25.8% 26.1% 24.3% Average realisation growth (YoY) 21.0% -21.1% -11.1% 6.8% 2.4% 3.0% 2.0% 2.0% Source: Company, MOSL Exhibit 31: Quarterly metrics 1QFY14 2QFY14 3QFY14 4QFY14 1QFY15 2QFY15 9.5 10.1 10.8 11.8 14.2 14.5 14.7 Paid Campaigns (in 000s) 221.5 238.6 249.6 262.2 278.0 296.1 312.8 Paid Campaigns as a proportion of total campaigns 2.3% 2.4% 2.3% 2.2% 2.0% 2.0% 2.1% Total Campaigns (YoY) 23% 23% 23% 30% 49% 44% 36% Paid Campaigns (YoY) 22.4% 27.1% 27.9% 26.9% 25.5% 24.1% 25.3% Total Campaigns (mn) 2QFY15 Source: Company, MOSL 29 January 2015 11 Just Dial Financials and valuations Consolidated - Income Statement Y/E March Net Sales Change (%) EBITDA Margin (%) Depreciation EBIT Int. and Finance Charges Other Income - Rec. PBT bef. EO Exp. EO Expense/(Income) PBT after EO Exp. Current Tax Deferred Tax Tax Rate (%) Reported PAT PAT Adj for EO items Change (%) Margin (%) (INR Million) FY10 1,309 52.4 308 23.5 40 268 4 39 302 434 -132 2 -29 20.4 -105 241 246.8 18.4 FY11 1,839 40.5 454 24.7 68 386 0 37 423 0 423 120 8 30.2 295 295 22.7 16.1 FY12 2,621 42.5 672 25.7 90 582 0 132 713 0 713 206 3 29.3 504 504 70.7 19.2 FY13 3,628 38.4 1,007 27.8 144 863 0 136 1,000 15 984 281 19 30.4 685 700 38.8 19.3 FY14 4,613 27.2 1,422 30.8 173 1,249 0 399 1,649 0 1,649 434 9 26.8 1,206 1,206 72.3 26.1 FY15E 6,000 30.1 1,782 29.7 230 1,552 0 300 1,852 0 1,852 556 0 30.0 1,296 1,296 7.5 21.6 FY16E 7,860 31.0 2,044 26.0 277 1,766 0 200 1,966 0 1,966 590 0 30.0 1,376 1,376 6.2 17.5 Y/E March Equity Share Capital Total Reserves FY10 11 639 FY11 521 433 FY12 531 542 FY13 695 3,564 FY14 702 4,643 FY15E 702 5,617 FY16E 702 6,509 FY17E 702 7,971 Net Worth Minority Interest Deferred Liabilities Total Loans Capital Employed 650 0 0 5 655 954 0 0 1 956 1,072 0 0 0 1,072 4,259 0 9 0 4,269 5,344 0 18 0 5,363 6,318 0 18 0 6,336 7,211 0 18 0 7,229 8,673 0 18 0 8,691 Gross Block Less: Accum. Deprn. Net Fixed Assets Capital WIP Total Investments 322 134 188 0 808 441 170 272 0 1,182 600 251 348 12 1,568 995 388 608 16 4,858 1,080 552 528 0 6,257 1,480 782 698 0 6,257 1,880 1,059 820 0 6,257 2,280 1,392 888 0 6,257 229 0 0 114 115 590 577 13 -361 655 448 0 1 196 251 959 938 21 -511 956 540 0 0 237 303 1,405 1,392 13 -865 1,072 593 0 9 239 345 1,806 1,787 18 -1,213 4,269 0.0 865 0 0 370 495 2,287 2,103 184 -1,422 5,363 0.0 1,846 0 6 1,246 594 2,465 2,225 239 -618 6,336 0.0 2,883 0 8 2,163 713 2,732 2,420 311 152 7,229 0.0 4,892 0 10 4,027 856 3,346 2,941 405 1,546 8,691 0.0 Consolidated - Balance Sheet Curr. Assets, Loans&Adv. Inventory Account Receivables Cash and Bank Balance Loans and Advances Curr. Liability & Prov. Account Payables Provisions Net Current Assets Appl. of Funds E: MOSL Estimates 29 January 2015 FY17E 10,240 30.3 3,103 30.3 333 2,770 0 240 3,010 0 3,010 903 0 30.0 2,107 2,107 53.1 20.6 (INR Million) 12 Just Dial Financials and valuations Ratios Y/E March Basic (INR) EPS Cash EPS BV/Share DPS Payout (%) Valuation (x) P/E Cash P/E P/BV EV/Sales EV/EBITDA Dividend Yield (%) Return Ratios (%) RoE RoCE Working Capital Ratios Fixed Asset Turnover (x) Asset Turnover (x) Debtor (Days) Creditor (Days) Working Capital Turnover (Days) Leverage Ratio (x) Current Ratio Debt/Equity FY10 FY11 FY12 FY13 FY14 FY15E FY16E FY17E 217.1 253.0 13.6 0.0 0.0 5.7 7.0 15.2 0.0 0.0 9.5 11.2 16.5 0.0 0.0 10.1 12.1 61.3 0.0 0.0 17.2 19.7 76.2 2.6 13.6 18.5 21.8 90.1 5.2 24.9 19.6 23.6 102.8 7.9 35.1 30.0 34.8 123.6 10.5 30.6 7.2 6.1 114.6 83.2 353.8 0.0 274.1 222.8 102.2 59.2 239.8 0.0 163.6 138.7 94.2 41.5 161.8 0.0 154.3 128.0 25.4 30.0 108.0 0.0 90.4 79.1 20.4 23.6 76.4 0.2 84.1 71.4 17.3 18.0 60.5 0.3 79.2 65.9 15.1 13.6 52.3 0.5 51.7 44.7 12.6 10.3 33.8 0.7 44.2 56.0 36.8 52.6 49.8 70.4 26.3 37.5 25.1 34.3 22.2 31.8 20.3 29.1 26.5 37.9 4 2.0 0 161 -132 4 1.9 0 186 -140 4 2.4 0 194 -154 4 0.8 1 180 -146 4 0.9 0 166 -142 4 0.9 0 135 -113 4 1.1 0 112 -93 4 1.2 0 105 -88 0.4 0.0 0.5 0.0 0.4 0.0 0.3 0.0 0.4 0.0 0.7 0.0 1.1 0.0 1.5 0.0 Consolidated - Cash Flow Statement Y/E March NP/ (Loss) Before Tax and EO Items Depreciation Direct Taxes Paid (Inc)/Dec in WC CF from Operations (INR Million) FY10 -132 40 -44 506 370 FY11 423 68 -133 256 614 FY12 713 90 -209 444 1,039 FY13 984 144 -307 314 1,135 FY14 1,649 173 -433 327 1,716 FY15E 1,852 230 -556 73 1,599 FY16E 1,966 277 -590 146 1,800 FY17E 3,010 333 -903 469 2,909 EO Expense CF from Operating incl EO -11 359 139 753 84 1,123 -112 1,023 -386 1,330 0 1,599 0 1,800 0 2,909 (inc)/dec in FA (Pur)/Sale of Investments CF from Investments Dividend Paid CF from Fin. Activity -99 -374 -301 0 -148 -176 -377 -508 0 -164 -231 -1,091 -1,209 0 127 -361 -3,188 -3,535 0 2,514 -208 -1,051 -1,241 0 41 -400 0 -400 -322 -322 -400 0 -400 -484 -484 -400 0 -400 -645 -645 -90 204 114 81 114 196 41 196 237 2 237 239 130 239 370 877 370 1,246 916 1,246 2,163 1,864 2,163 4,027 Inc/Dec of Cash Add: Beginning Balance Closing Balance E: MOSL Estimates 29 January 2015 13 Disclosures This document has been prepared by Motilal Oswal Securities Limited (hereinafter referred to as Most) to provide information about the company(ies) and/sector(s), if any, covered in the report may be Justand Dial distributed by it and/or its affiliated company(ies). This report is for personal information of the selected recipient/s and does not construe to be any investment, legal or taxation advice to you. This research report does not constitute an offer, invitation or inducement to invest in securities or other investments and Motilal Oswal Securities Limited (hereinafter referred as MOSt) is not soliciting any action based upon it. This report is not for public distribution and has been furnished to you solely for your general information and should not be reproduced or redistributed to any other person in any form. This report does not constitute a personal recommendation or take into account the particular investment objectives, financial situations, or needs of individual clients. Before acting on any advice or recommendation in this material, investors should consider whether it is suitable for their particular circumstances and, if necessary, seek professional advice. The price and value of the investments referred to in this material and the income from them may go down as well as up, and investors may realize losses on any investments. Past performance is not a guide for future performance, future returns are not guaranteed and a loss of original capital may occur. MOSt and its affiliates are a full-service, integrated investment banking, investment management, brokerage and financing group. We and our affiliates have investment banking and other business relationships with a some companies covered by our Research Department. Our research professionals may provide input into our investment banking and other business selection processes. Investors should assume that MOSt and/or its affiliates are seeking or will seek investment banking or other business from the company or companies that are the subject of this material and that the research professionals who were involved in preparing this material may educate investors on investments in such business. The research professionals responsible for the preparation of this document may interact with trading desk personnel, sales personnel and other parties for the purpose of gathering, applying and interpreting information. Our research professionals are paid on the profitability of MOSt which may include earnings from investment banking and other business. MOSt generally prohibits its analysts, persons reporting to analysts, and members of their households from maintaining a financial interest in the securities or derivatives of any companies that the analysts cover. Additionally, MOSt generally prohibits its analysts and persons reporting to analysts from serving as an officer, director, or advisory board member of any companies that the analysts cover. Our salespeople, traders, and other professionals or affiliates may provide oral or written market commentary or trading strategies to our clients that reflect opinions that are contrary to the opinions expressed herein, and our proprietary trading and investing businesses may make investment decisions that are inconsistent with the recommendations expressed herein. In reviewing these materials, you should be aware that any or all of the foregoing among other things, may give rise to real or potential conflicts of interest. MOSt and its affiliated company(ies), their directors and employees and their relatives may; (a) from time to time, have a long or short position in, act as principal in, and buy or sell the securities or derivatives thereof of companies mentioned herein. (b) be engaged in any other transaction involving such securities and earn brokerage or other compensation or act as a market maker in the financial instruments of the company(ies) discussed herein or act as an advisor or lender/borrower to such company(ies) or may have any other potential conflict of interests with respect to any recommendation and other related information and opinions.; however the same shall have no bearing whatsoever on the specific recommendations made by the analyst(s), as the recommendations made by the analyst(s) are completely independent of the views of the affiliates of MOSt even though there might exist an inherent conflict of interest in some of the stocks mentioned in the research report Reports based on technical and derivative analysis center on studying charts company's price movement, outstanding positions and trading volume, as opposed to focusing on a company's fundamentals and, as such, may not match with a report on a company's fundamental analysis. In addition MOST has different business segments / Divisions with independent research separated by Chinese walls catering to different set of customers having various objectives, risk profiles, investment horizon, etc, and therefore may at times have different contrary views on stocks sectors and markets. Unauthorized disclosure, use, dissemination or copying (either whole or partial) of this information, is prohibited. The person accessing this information specifically agrees to exempt MOSt or any of its affiliates or employees from, any and all responsibility/liability arising from such misuse and agrees not to hold MOSt or any of its affiliates or employees responsible for any such misuse and further agrees to hold MOSt or any of its affiliates or employees free and harmless from all losses, costs, damages, expenses that may be suffered by the person accessing this information due to any errors and delays. The information contained herein is based on publicly available data or other sources believed to be reliable. Any statements contained in this report attributed to a third party represent MOSt’s interpretation of the data, information and/or opinions provided by that third party either publicly or through a subscription service, and such use and interpretation have not been reviewed by the third party. This Report is not intended to be a complete statement or summary of the securities, markets or developments referred to in the document. While we would endeavor to update the information herein on reasonable basis, MOSt and/or its affiliates are under no obligation to update the information. Also there may be regulatory, compliance, or other reasons that may prevent MOSt and/or its affiliates from doing so. MOSt or any of its affiliates or employees shall not be in any way responsible and liable for any loss or damage that may arise to any person from any inadvertent error in the information contained in this report. MOSt or any of its affiliates or employees do not provide, at any time, any express or implied warranty of any kind, regarding any matter pertaining to this report, including without limitation the implied warranties of merchantability, fitness for a particular purpose, and non-infringement. The recipients of this report should rely on their own investigations. This report is intended for distribution to institutional investors. Recipients who are not institutional investors should seek advice of their independent financial advisor prior to taking any investment decision based on this report or for any necessary explanation of its contents. Most and it’s associates may have managed or co-managed public offering of securities, may have received compensation for investment banking or merchant banking or brokerage services, may have received any compensation for products or services other than investment banking or merchant banking or brokerage services from the subject company in the past 12 months. Most and it’s associates have not received any compensation or other benefits from the subject company or third party in connection with the research report. Subject Company may have been a client of Most or its associates during twelve months preceding the date of distribution of the research report MOSt and/or its affiliates and/or employees may have interests/positions, financial or otherwise of over 1 % at the end of the month immediately preceding the date of publication of the research in the securities mentioned in this report. To enhance transparency, MOSt has incorporated a Disclosure of Interest Statement in this document. This should, however, not be treated as endorsement of the views expressed in the report. Motilal Oswal Securities Limited is under the process of seeking registration under SEBI (Research Analyst) Regulations, 2014. There are no material disciplinary action that been taken by any regulatory authority impacting equity research analysis activities Analyst Certification The views expressed in this research report accurately reflect the personal views of the analyst(s) about the subject securities or issues, and no part of the compensation of the research analyst(s) was, is, or will be directly or indirectly related to the specific recommendations and views expressed by research analyst(s) in this report. The research analysts, strategists, or research associates principally responsible for preparation of MOSt research receive compensation based upon various factors, including quality of research, investor client feedback, stock picking, competitive factors and firm revenues Disclosure of Interest Statement Analyst ownership of the stock Served as an officer, director or employee JUST DIAL LTD No No Regional Disclosures (outside India) This report is not directed or intended for distribution to or use by any person or entity resident in a state, country or any jurisdiction, where such distribution, publication, availability or use would be contrary to law, regulation or which would subject MOSt & its group companies to registration or licensing requirements within such jurisdictions. For U.S. Motilal Oswal Securities Limited (MOSL) is not a registered broker - dealer under the U.S. Securities Exchange Act of 1934, as amended (the"1934 act") and under applicable state laws in the United States. In addition MOSL is not a registered investment adviser under the U.S. Investment Advisers Act of 1940, as amended (the "Advisers Act" and together with the 1934 Act, the "Acts), and under applicable state laws in the United States. Accordingly, in the absence of specific exemption under the Acts, any brokerage and investment services provided by MOSL, including the products and services described herein are not available to or intended for U.S. persons. This report is intended for distribution only to "Major Institutional Investors" as defined by Rule 15a-6(b)(4) of the Exchange Act and interpretations thereof by SEC (henceforth referred to as "major institutional investors"). This document must not be acted on or relied on by persons who are not major institutional investors. Any investment or investment activity to which this document relates is only available to major institutional investors and will be engaged in only with major institutional investors. In reliance on the exemption from registration provided by Rule 15a-6 of the U.S. Securities Exchange Act of 1934, as amended (the "Exchange Act") and interpretations thereof by the U.S. Securities and Exchange Commission ("SEC") in order to conduct business with Institutional Investors based in the U.S., MOSL has entered into a chaperoning agreement with a U.S. registered broker-dealer, Motilal Oswal Securities International Private Limited. ("MOSIPL"). Any business interaction pursuant to this report will have to be executed within the provisions of this chaperoning agreement. The Research Analysts contributing to the report may not be registered /qualified as research analyst with FINRA. Such research analyst may not be associated persons of the U.S. registered broker-dealer, MOSIPL, and therefore, may not be subject to NASD rule 2711 and NYSE Rule 472 restrictions on communication with a subject company, public appearances and trading securities held by a research analyst account. For Singapore Motilal Oswal Capital Markets Singapore Pte Limited is acting as an exempt financial advisor under section 23(1)(f) of the Financial Advisers Act(FAA) read with regulation 17(1)(d) of the Financial Advisors Regulations and is a subsidiary of Motilal Oswal Securities Limited in India. This research is distributed in Singapore by Motilal Oswal Capital Markets Singapore Pte Limited and it is only directed in Singapore to accredited investors, as defined in the Financial Advisers Regulations and the Securities and Futures Act (Chapter 289), as amended from time to time. In respect of any matter arising from or in connection with the research you could contact the following representatives of Motilal Oswal Capital Markets Singapore Pte Limited: Anosh Koppikar Kadambari Balachandran Email : [email protected] Email : [email protected] Contact : (+65)68189232 Contact : (+65) 68189233 / 65249115 Office Address : 21 (Suite 31),16 Collyer Quay,Singapore 04931 Motilal Oswal Securities Ltd 29 January 2015 Motilal Oswal Tower, Level 9, Sayani Road, Prabhadevi, Mumbai 400 025 Phone: +91 22 3982 5500 E-mail: [email protected] 14

© Copyright 2026