
Asian Paints - Business Standard
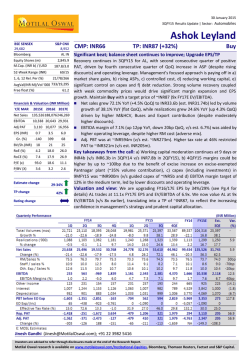
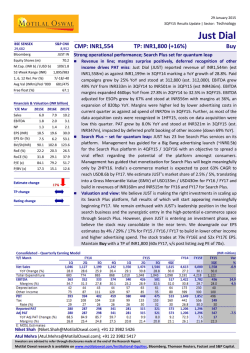
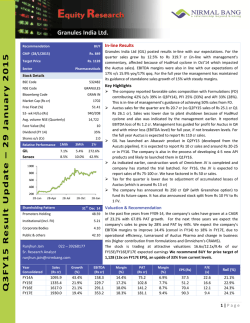
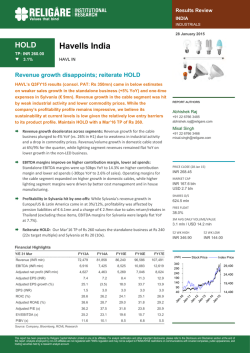
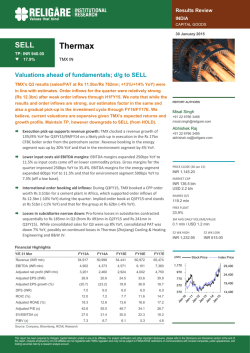
29 January 2015 3QFY15 Results Update | Sector: Consumer Asian Paints BSE SENSEX 29,682 Bloomberg S&P CNX 8,952 APNT IN Equity Shares (m) 959.2 M.Cap. (INR b) / (USD b) 845.1/13.7 52-Week Range (INR) 923/461 1, 6, 12 Rel. Per (%) 8/28/39 Avg Val(INR M)/Vol ‘000 799/1,256 Free float (%) 47.2 Financials & Valuation (INR Billion) Y/E MAR 2015E 2016E 2017E Net Sales 141.2 164.7 191.6 EBITDA 20.8 28.9 35.4 Adj PAT Adj.EPS (INR) Gr. (%) 14.3 19.9 24.4 14.9 20.8 25.5 16.6 38.9 22.7 BV/Sh.(INR) 49.5 RoE (%) 30.2 63.3 80.5 32.8 31.6 RoCE (%) 39.5 42.6 41.8 P/E (x) 59.0 42.4 34.6 P/BV (X) 17.8 13.9 10.9 Estimate change TP change Rating change 50% CMP: INR881 TP: INR900 (+2%) Neutral Muted performance; sharp margin tailwind ahead Asian Paints’ (APNT) 3QFY15 results were below estimates, with consolidated sales at INR36b (est. INR39.5b), up 5.6% YoY, led by an estimated ~4% domestic decorative paints volume growth (est. 11%) much lower vs. recent trend of 1011%. EBITDA margin expanded 20bp YoY to 14.8% (est. 15.4%). Consolidated Adj. PAT posted 11.8% YoY growth to INR3.7b (est. INR3.97b). Lower volume growth was primarily on account of weak macro environment and early festive season, compared to the previous year, as per management. Adjusting for the festive season mismatch, 2QFY15 + 3QFY15 sales, EBITDA and PAT are up 11%, 5% and 9% respectively, modest versus expectations. Gross margin expanded 280bp YoY to 43.1% led by a sharp correction in RM prices and carry-over benefit of earlier price hikes. However, higher other expenses (up 190bp YoY) and staff cost (up 70bp YoY), restricted EBITDA margin expansion to 20bp YoY to 14.8% (est. 15.4%). Thus, EBITDA posted muted 7.2% YoY growth to INR5.3b (est. INR6b). Lower tax rate (down 20bp) coupled with 18% growth in other income drove 11.8% YoY PAT growth to INR3.68b (est. INR3.97b). Ramp-up in Home Improvement business was slower-than-expected, impacted by weak prevailing consumer sentiments. We expect demand to pick up gradually in FY16. Benefits of sharp fall in crude and derivatives will reflect commencing 4Q15. Valuation and view: We cut the estimates 2-4% to account for 3QFY15 miss. We estimate 30.5% EPS CAGR over FY15E-17E, with underlying gross and EBITDA margin expansion of 420bp and 380bp, respectively. While improving macros and consumer sentiment should drive volume growth going ahead, valuations at 42.4x FY16E and 34.6x FY17E discounts the positives, in our view. Maintain Neutral with a revised target price of INR900 (35x FY17E, three-year average P/E). Gautam Duggad ([email protected]); +91 22 3982 5404 Manish Poddar ([email protected]); +91 22 3027 8029 Investors are advised to refer through disclosures made at the end of the Research Report. Motilal Oswal research is available on www.motilaloswal.com/Institutional-Equities, Bloomberg, Thomson Reuters, Factset and S&P Capital. Asian Paints Key Quarterly Charts 15.7 15.6 14.6 13.6 Source: Company, MOSL Source: Company, MOSL Exhibit 5: Decorative volumes posted ~4% volume growth Gross Margin (%) 41.2 43.7 43.8 40.7 42.5 41.5 44.0 29.8 3QFY15 44.0 17.4 15.3 17.4 17.1 15.8 14.4 16.8 14.9 16.6 4QFY14 1QFY15 2QFY15 3QFY15 4 3 3QFY14 10 2QFY14 11 43.5 1QFY14 12 EBITDA Margin (%) 4QFY13 5 10 12 29.5 Exhibit 6: Operating margins (s/l) expanded 80bp YoY 3QFY13 13 12 2QFY15 Source: Company, MOSL Volume Growth (%) 18 27.1 26.9 4QFY14 6.1 28.1 3QFY13 -0.3 May'10 Jul'10 Aug'10 Dec'10 Mar'11 May'11 Jun'11 Jul'11 Nov'11 Dec'11 Feb'12 Apr'12 May'12 Jan'13 May'13 Aug'13 Sep'13 Feb'14 May'14 Jun'14 11.4 17.9 7.1 3QFY14 0.4 1.0 1.2 25.0 1.2 1.0 12.6 2QFY14 1.0 1.2 1.8 2.1 23.0 1.3 2.0 17.6 21.3 1QFY14 2.2 Sales Growth (%) 17.6 4QFY13 22.1 2.5 25.2 1.2 Sales (INR b) 19.9 3.2 2.9 2.6 14.8 Exhibit 4: Standalone sales up 6.1% YoY Price Increase/Decrease(%) 4.4 4.2 13.7 Source: Company, MOSL 1QFY15 Exhibit 3: 2.2% price hike YTD in FY15 15.6 3QFY15 15.3 2QFY15 16.3 1QFY15 3QFY15 2QFY15 3QFY14 2QFY14 EBITDA Source: Margin (%) MOSL, Company 41.1 41.9 42.9 43.1 4QFY14 16.3 5.6 1QFY14 4QFY13 3QFY13 6.0 18.0 12.5 11.1 Gross Margin (%) 42.7 42.7 40.3 3QFY14 21.4 18.1 40.3 42.8 2QFY14 18.6 36.0 1QFY14 30.8 28.2 1QFY15 26.9 4QFY14 30.3 Sales Growth (%) 35.9 32.7 33.3 34.1 4QFY13 Sales (INR b) Exhibit 2: Gross margins expanded 280bp YoY 3QFY13 Exhibit 1: Sales came in 9% below our expectations 3QFY15 2QFY15 1QFY15 4QFY14 3QFY14 2QFY14 1QFY14 4QFY13 3QFY13 2QFY13 -2 1QFY13 4QFY12 3QFY12 7 Source: Company, MOSL 29 January 2015 Source: Company, MOSL 2 Asian Paints Consolidated sales up 5.6%; 9% below expectations Consol net sales grew 5.6% YoY to INR36b (est. INR 39.5b). We estimate domestic decorative paints volume growth at ~4%, lowest in seven quarters. The Automotive coatings JV (PPG-AP) saw good growth in the General Industrial and Auto Refinish segment. However the Auto OEM segment was impacted due to weak consumer demand. The growth in the Industrial Coatings JV (AP-PPG) was driven by demand in the Industrial Liquid Paints segment. Gross margin expanded 280bp YoY to 43.1% (est. 42.5%) led by raw material softening and carry over benefits of earlier price hikes. Given the sharp fall in RM prices, we expect APNT to take price cuts to revive volume growth. Higher other expenses (up 190bp YoY) and staff cost (up 70bp YoY), restricted EBITDA margin expansion to 20bp YoY to 14.8% (est. 15.4%). Thus, EBITDA posted 7.2% YoY growth to INR5.3b (est. INR6b). Lower tax rate (down 20bp) coupled with 18% growth in other income drove 11.8% YoY PAT growth. The company posted Adj. PAT at INR 3.68b (est. INR 3.97b) Stand-alone business: Low single digit volume growth Standalone sales grew 6.1% YoY to INR29.8b. Domestic decorative Paints volume growth came in at 4% (in our view) due to weak macro environment and early festive season as compared to the previous year. Gross margin expanded 330bp YoY to 44% while EBITDA margins expanded 80bp YoY to 16.6%. Adj PAT grew 14.8% YoY to INR3.5b. Exhibit 7: Quarterly Performance (Standalone) Y/E March Net Sales Change (%) Raw Material/PM Gross Profit Gross Margin (%) Operating Expenses % of Sales EBITDA Margin (%) Change (%) Interest Depreciation Other Income PBT Tax Effective Tax Rate (%) Adjusted PAT Change (%) 1Q 20,440 6.3 11,621 8,819 43.1 4,871 23.8 3,947 19.3 10.6 78 274 352 3,948 1,202 30.4 2,746 9.7 FY13 2Q 3Q 21,309 25,206 16.0 19.9 12,688 14,824 8,621 10,382 40.5 41.2 5,366 5,999 25.2 23.8 3,255 4,383 15.3 17.4 18.1 23.1 100 60 294 301 349 470 3,210 4,493 972 1,373 30.3 30.6 2,238 3,120 5.1 24.6 4Q 22,144 7.1 12,501 9,644 43.5 6,258 28.3 3,386 15.3 3.0 69 401 591 3,508 1,112 31.7 2,396 -2.1 1Q 23,011 12.6 12,948 10,062 43.7 6,056 26.3 4,006 17.4 1.5 48 530 708 4,136 1,297 31.3 2,839 3.4 FY14 2Q 25,049 17.6 14,077 10,972 43.8 6,680 26.7 4,293 17.1 31.9 62 515 750 4,466 1,360 30.4 3,106 38.8 3Q 28,077 11.4 16,661 11,415 40.7 6,992 24.9 4,424 15.8 0.9 64 540 701 4,521 1,446 32.0 3,075 -1.5 4Q 26,866 21.3 15,713 11,153 41.5 7,288 27.1 3,865 14.4 14.1 88 538 765 4,004 1,233 30.8 2,770 15.6 FY15 1Q 2Q 3Q 27,069 29,535 29,791 17.6 17.9 6.1 15,562 16,539 16,697 11,506 12,996 13,094 42.5 44.0 44.0 6,949 8,607 8,153 25.7 29.1 27.4 4,557 4,389 4,941 16.8 14.9 16.6 13.8 2.2 11.7 43 64 78 547 564 565 828 927 831 4,795 4,688 5,128 1,455 1,431 1,598 30.3 30.5 31.2 3,340 3,257 3,531 17.6 4.9 14.8 Source: Company, MOSL Imputed subsidiary performance: Weak revenue growth 29 January 2015 Imputed subsidiary sales grew 3.1% to INR6.2b and the company witnessed double digit growth in some markets such as Bangladesh, Nepal and Emirates. Gross and EBITDA margins contracted 20bp and 280bp to 38.7% and 6.3% respectively. 3 Asian Paints Valuation and View We cut our estimates 2%-4% to account for 3QFY15 miss. Asian Paints will be one of the key beneficiaries of RM correction, in our view. Any sharp price cuts by Paints industry is a key monitorable. Given the oligopolistic nature of Indian Decorative Paints we don’t see any sharp price cuts. We estimate 30.5% EPS CAGR over FY15-17 with underlying gross and EBITDA margin expansion of 420bps and 380bps, respectively. While improving macros and consumer sentiment should drive volume growth going ahead, valuations at 42.4x FY16E and 34.6 FY17E discount the positives, in our view. Maintain Neutral with a revised target price of INR900 (35x FY17E, 3 yr average P/E). Exhibit 8: Earnings revised marginally downwards to incorporate 3Q15 miss INR m Sales EBITDA PAT FY15E 141,223 20,770 14,334 New Old FY16E FY17E FY15E FY16E 164,692 191,603 146,525 172,624 28,868 35,390 21,834 29,830 19,911 24,429 14,692 19,965 Exhibit 9: APNT P/E (x) PE (x) Change FY15E FY16E FY17E -3.6% -4.6% -5.9% -4.9% -3.2% -6.8% -2.4% -0.3% -4.5% Source: Company, MOSL FY17E 203,612 37,992 25,591 Exhibit 10: APNT P/E premium vs. Sensex Peak(x) Avg(x) 45.0 Min(x) 42.8 42.8 35.0 Asian Paints PE Relative to Sensex PE (%) 240 171.5 160 24.8 25.0 15.0 59.2 80 0 9.0 5.0 Source: Company, MOSL Jan-15 Oct-13 Jul-12 Apr-11 Jan-10 Oct-08 Jul-07 Apr-06 Jan-05 Jan-15 Oct-13 Jul-12 Apr-11 Jan-10 Oct-08 Jul-07 Apr-06 Jan-05 -80 Source: Company, MOSL Exhibit 11: Valuation Matrix of coverage universe Company Consumer Asian Paints Britannia Colgate Dabur* Emami* Godrej Consumer GSK Consumer Hind. Unilever ITC Marico* Nestle Pidilite Inds. Radico Khaitan United Spirits Retail Jubilant Foodworks Shopper's Stop Titan Company Reco Price Mkt Cap EPS Growth YoY (%) P/E (x) EV/EBITDA (x) ROE (%) Div. (%) (INR) (USD M) FY15E FY16E FY17E FY15E FY16E FY17E FY15E FY16E FY17E FY15E FY15E Neutral Buy Buy Neutral Buy Neutral Neutral Neutral Buy Buy Neutral Neutral Buy Buy 910 1,915 1,921 252 928 1,110 5,609 932 362 353 7,303 574 91 3,455 14,234 3,728 4,258 7,212 3,435 6,158 3,845 32,877 46,188 3,704 11,479 4,794 196 8,185 16.6 38.9 21.8 20.3 14.4 24.4 16.1 16.1 18.1 28.5 19.8 31.3 -12.5 18.4 6.0 18.3 11.5 14.4 10.0 19.1 7.1 18.0 16.0 48.2 -12.0 20.6 LP 151.7 22.7 23.7 24.6 18.0 22.6 19.3 16.5 18.7 16.0 17.2 18.4 18.4 19.2 43.5 59.0 48.4 46.5 41.4 44.3 42.8 39.9 52.3 29.4 39.8 56.5 53.4 15.1 199.4 42.4 40.2 37.4 35.6 34.5 32.6 33.7 44.2 25.7 33.4 47.9 36.0 12.6 79.2 34.6 32.5 30.0 30.2 28.1 27.3 29.0 37.2 22.2 28.5 40.5 30.4 10.5 55.2 39.5 34.4 31.4 32.7 37.3 30.4 38.1 38.8 19.9 26.0 33.7 36.2 9.5 68.4 28.2 28.0 23.9 28.1 28.4 23.9 31.1 32.0 17.4 21.3 29.0 24.4 8.3 46.9 22.6 21.3 19.3 23.6 22.6 20.6 26.0 26.1 14.9 17.8 24.7 20.2 7.1 36.5 30.2 45.7 88.4 33.3 44.1 19.5 27.9 102.4 34.5 26.1 50.4 22.3 9.1 7.7 0.8 1.0 1.6 1.0 0.8 0.9 1.1 1.9 2.3 0.2 1.2 0.6 1.0 0.0 Buy Neutral Buy 1,424 477 433 1,518 639 6,269 12.6 47.6 16.7 41.3 25.1 25.8 70.0 70.5 44.4 43.5 52.0 35.4 30.8 41.5 28.1 33.6 20.8 33.0 21.6 17.4 26.0 15.4 14.7 20.4 19.4 7.3 28.0 0.0 0.2 0.7 60.6 35.8 25.7 Source: Company, MOSL 29 January 2015 4 Asian Paints Story in Charts Exhibit 12: Revenues to post 16.5% CAGR over FY15-17E Sales (INR b) Sales growth (%) Price growth (%) 11.9 24.3 22.3 10.0 77.2 96.0 108.7 FY10 FY11 FY12 FY13 9.6 16.3 12.2 FY14 FY15E FY16E FY17E 2.2 FY10 FY11 FY12 FY13 Source: Company, MOSL Exhibit 14: Gross margin to expand 420bp over FY15-17E 39.8 41.0 41.7 Exhibit 15: Sharp EBITDA margins expansion ahead 47.1 18.4 42.9 17.5 17.2 15.4 38.3 FY09 15.3 14.8 18.5 14.7 12.3 FY10 FY11 FY12 FY13 FY14 FY15E FY16E FY17E FY09 FY10 FY11 FY12 FY13 FY14 FY15E FY16E FY17E Source: Company, MOSL Exhibit 16: PAT to post 30.5% CAGR over FY15-FY17E PAT (INR b) Source: Company, MOSL Exhibit 17: Return Ratios (x): Stable RoE’s PAT growth (%) FY11 FY12 FY13 16.6 24.4 19.9 10.3 14.3 12.3 17.3 11.1 9.9 8.4 8.3 4.0 FY10 1.0 12.7 38.9 38.5 33.4 36.0 32.9 30.4 30.2 32.8 31.6 22.7 FY14 FY15E FY16E FY17E Source: Company, MOSL 29 January 2015 RoE (%) 48.8 107.9 -3.9 FY09 1QFY15 EBITDA Margin (%) 46.7 42.1 FY14 Source: Company, MOSL Gross Margin (%) 43.8 6.1 5.0 191.6 66.8 FY09 16.6 164.7 54.6 13.3 15.7 141.2 15.6 125.8 24.0 Exhibit 13: Weighted average price increase of 2.2% YTD FY09 FY10 FY11 FY12 FY13 FY14 FY15E FY16E FY17E Source: Company, MOSL 5 Asian Paints Corporate profile: Asian Paints Company description Exhibit 18: Sensex rebased Asian Paints is India's largest paint manufacturer and marketer, with a dominant share in the decorative segment. For the industrials and automotive segment, it has a JV with PPG of the US. Asian Paints acquired Berger International of Singapore to expand its operations in other markets in Asia, the Middle East and the Caribbean. Exhibit 19: Shareholding pattern (%) Exhibit 20: Top holders Dec-14 Sep-14 Dec-13 Promoter 52.8 52.8 52.8 DII 9.9 9.2 7.9 FII 17.3 18.1 19.5 Others 20.1 19.9 19.9 Holder Name % Holding Life Insurance Corpn.Of India Ojasvi Trading Private Limited Aberdeen Global Indian Equity (Mauritius) Ltd 5.5 4.9 1.5 Note: FII Includes depository receipts Exhibit 21: Top management Exhibit 22: Directors Name Designation Name Name Ashwin Choksi Chairman Ashwin Choksi Dipankar Basu* Ashwin Dani Vice Chairman Ashwin Dani Mahendra Shah* K B S Anand Managing Director & CEO K B S Anand Deepak Satwaleka*r Jayesh Merchant Company Secretary Jayesh Merchant Malav Dani Amar Vakil M K Sharma* Mahendra Choksi Vibha Paul Rishi* S Sivaram* Amrita Vakil S Ramadorai* *Independent Exhibit 23: Auditors Exhibit 24: MOSL forecast v/s consensus Name Type BSR & Co LLP Shah & Co RA & Co Statutory Statutory Cost Auditor 29 January 2015 EPS (INR) MOSL forecast Consensus forecast Variation (%) FY15 FY16 FY17 14.9 20.8 25.5 16.1 20.9 24.1 -7.3 -0.5 5.7 6 Asian Paints Financials and valuations (INR Million) Income Statement Y/E March Net Sales Change (%) Raw Materials Gross Profit Margin (%) Operating Expenses EBITDA Change (%) Margin (%) Depreciation Int. and Fin. Charges Other Income Profit before Taxes Change (%) Margin (%) Tax Deferred Tax Tax Rate (%) PBT Before Minority Minority Interest Adjusted PAT Change (%) Margin (%) Exceptional/Prior Period inc Reported PAT 2010 66,809 22.3 37580 29230 43.8 16956 12,274 83.2 18.4 836 285 1,405 12,559 102.4 18.8 3,676 55 29.7 8828 483 8,345 107.9 12.5 12 8,356 2011 77,223 15.6 44746 32477 42.1 19196 13,281 8.2 17.2 1,131 232 680 12,597 0.3 16.3 3,502 282 30.0 8813 381 8,432 1.0 10.9 0 8,432 2012 95,983 24.3 57770 38213 39.8 23465 14,749 11.1 15.4 1,211 410 1,413 14,541 15.4 15.1 4,274 61 29.8 10206 319 9,887 17.3 10.3 0 9,887 2013 108,744 13.3 64130 44614 41.0 27936 16,677 13.1 15.3 1,546 367 1,788 16,552 13.8 15.2 4,364 593 29.9 11595 456 11,139 12.7 10.2 0 11,139 2014 125,816 15.7 73406 52411 41.7 33762 18,649 11.8 14.8 2,457 422 2,674 18,444 11.4 14.7 5,378 338 31.0 12729 440 12,289 10.3 9.8 -100 12,190 2015E 141,223 12.2 80707 60516 42.9 39746 20,770 11.4 14.7 2,705 330 3,427 21,162 14.7 15.0 6,242 317 31.0 14602 268 14,334 16.6 10.1 0 14,334 2016E 164,692 16.6 87753 76939 46.7 48071 28,868 39.0 17.5 3,090 300 3,946 29,424 39.0 17.9 8,827 588 32.0 20009 98 19,911 38.9 12.1 0 19,911 2017E 191,603 16.3 101307 90296 47.1 54906 35,390 22.6 18.5 3,429 225 4,424 36,160 22.9 18.9 10,847 723 32.0 24590 161 24,429 22.7 12.7 0 24,429 (INR Million) Balance Sheet Y/E March Share Capital Reserves Net Worth Loans Other Liability Minority Interest Capital Employed 2010 959 16,141 17,100 2,292 562 945 20,899 2011 959 20,915 21,874 581 1,745 1,099 25,299 2012 959 26,526 27,485 559 1,847 1,367 31,257 2013 959 32,884 33,843 473 2,622 1,608 38,545 2014 959 39,433 40,393 414 3,055 2,460 46,322 2015E 959 46,553 47,512 600 3,549 2,728 54,389 2016E 959 59,728 60,687 2,000 4,340 2,826 69,853 2017E 959 76,298 77,257 1,500 5,297 2,987 87,041 Gross Block Less: Accum. Depn. Net Fixed Assets Capital WIP Investments 15,004 6,276 8,728 4,072 6,241 20,249 7,151 13,099 433 4,290 21,458 8,453 13,006 6,171 3,547 33,851 9,794 24,057 592 2,957 36,621 12,234 24,388 716 7,212 40,121 14,939 25,183 716 14,492 45,121 18,029 27,093 716 22,252 50,121 21,457 28,664 716 32,120 Curr. Assets, L&A Inventory Account Receivables Cash and Bank Balance Others Curr. Liab. and Prov. Account Payables Other Liabilities Provisions Net Current Assets Godwill on Cons. Application of Funds E: MOSL Estimates 18,437 9,559 5,425 1,058 2,395 16,947 7,183 6,613 3,150 1,490 367 20,899 28,284 13,054 5,731 6,262 3,237 20,807 10,874 4,606 5,327 7,478 0 25,299 36,238 15,989 7,813 6,243 6,194 27,705 12,968 8,462 6,275 8,533 0 31,257 39,797 18,303 9,809 7,367 4,318 29,300 14,416 10,474 4,410 10,497 442 38,545 46,643 20,699 11,103 9,317 5,525 34,051 17,457 11,001 5,593 12,592 1,414 46,322 50,385 22,054 11,607 10,522 6,201 36,386 18,132 12,011 6,244 13,998 0 54,389 58,523 25,719 13,988 11,854 6,963 38,731 19,233 13,119 6,379 19,792 0 69,853 69,690 30,446 16,798 14,623 7,822 44,149 22,204 14,335 7,610 25,541 0 87,041 29 January 2015 7 Asian Paints Financials and valuations Ratios Y/E March Basic (INR) EPS Cash EPS BV/Share DPS Payout % 2010 2011 2012 2013 2014 2015E 2016E 2017E 8.7 9.6 17.8 3.2 31.0 8.8 10.0 22.8 3.7 36.4 10.3 11.6 28.7 4.6 38.8 11.6 13.2 35.3 5.4 39.6 12.8 15.4 42.1 6.2 41.4 14.9 17.8 49.5 7.0 40.2 20.8 24.0 63.3 7.0 28.9 25.5 29.0 80.5 8.2 27.5 Valuation (x) P/E Cash P/E EV/Sales EV/EBITDA P/BV Dividend Yield (%) 101.3 92.1 12.6 68.4 49.4 0.4 100.2 88.4 10.8 62.9 38.6 0.4 85.5 76.1 8.7 56.7 30.7 0.5 75.9 66.6 7.7 50.1 25.0 0.6 68.8 57.3 6.6 44.5 20.9 0.7 59.0 49.6 5.8 39.5 17.8 0.8 42.4 36.7 4.9 28.2 13.9 0.8 34.6 30.3 4.2 22.6 10.9 0.9 Return Ratios (%) RoE RoCE 48.8 61.5 38.5 50.7 36.0 47.8 32.9 43.9 30.4 40.7 30.2 39.5 32.8 42.6 31.6 41.8 Working Capital Ratios Debtor (Days) Asset Turnover (x) 30 6.5 27 3.8 30 4.5 33 3.1 32 3.4 30 3.6 31 3.5 32 3.5 Leverage Ratio Debt/Equity (x) 0.1 0.0 0.0 0.0 0.0 0.0 0.0 0.0 (INR Million) Cash Flow Statement Y/E March OP/(loss) before Tax Depreciation Net interest Direct Taxes Paid (Incr)/Decr in WC CF from Operations 2010 12,559 836 -1,120 -3,676 3,530 12,129 2011 12,597 1,131 -448 -3,502 -784 8,995 2012 14,541 1,211 -1,004 -4,274 -1,075 9,400 2013 16,552 1,546 -1,421 -4,364 -840 11,474 2014 18,444 2,457 -2,252 -5,378 -146 13,126 2015E 21,162 2,705 -3,097 -6,242 -201 14,327 2016E 29,424 3,090 -3,646 -8,827 -4,463 15,579 2017E 36,160 3,429 -4,199 -10,847 -2,979 21,564 Incr in FA Pur of Investments CF from Invest. -3,541 -5,457 -8,998 -1,606 1,951 345 -6,946 742 -6,204 -6,815 591 -6,224 -2,894 -4,255 -7,149 -3,500 -7,280 -10,780 -5,000 -7,761 -12,761 -5,000 -9,868 -14,868 Incr in Debt Dividend Paid Int./Div. Received Interest Paid Others CF from Fin. Activity -794 -3,023 1,405 -285 -1,479 -4,176 -1,711 -3,571 680 -232 698 -4,136 -23 -4,459 1,413 -410 263 -3,215 -86 -5,155 1,788 -367 -307 -4,127 -59 -5,904 2,674 -422 -316 -4,027 186 -6,734 3,427 -330 1,109 -2,342 1,400 -6,734 3,946 -300 201 -1,487 -500 -7,856 4,424 -225 230 -3,927 Incr/Decr of Cash Add: Opening Balance Closing Balance -1,045 2,104 1,059 5,204 1,058 6,262 -19 6,262 6,243 1,123 6,243 7,366 1,950 7,367 9,316 1,205 9,317 10,522 1,332 10,522 11,854 2,769 11,854 14,623 29 January 2015 8 Asian Paints NOTES 29 January 2015 9 Asian Paints Disclosures This document has been prepared by Motilal Oswal Securities Limited (hereinafter referred to as Most) to provide information about the company(ies) and/sector(s), if any, covered in the report and may be distributed by it and/or its affiliated company(ies). This report is for personal information of the selected recipient/s and does not construe to be any investment, legal or taxation advice to you. This research report does not constitute an offer, invitation or inducement to invest in securities or other investments and Motilal Oswal Securities Limited (hereinafter referred as MOSt) is not soliciting any action based upon it. This report is not for public distribution and has been furnished to you solely for your general information and should not be reproduced or redistributed to any other person in any form. This report does not constitute a personal recommendation or take into account the particular investment objectives, financial situations, or needs of individual clients. Before acting on any advice or recommendation in this material, investors should consider whether it is suitable for their particular circumstances and, if necessary, seek professional advice. The price and value of the investments referred to in this material and the income from them may go down as well as up, and investors may realize losses on any investments. Past performance is not a guide for future performance, future returns are not guaranteed and a loss of original capital may occur. MOSt and its affiliates are a full-service, integrated investment banking, investment management, brokerage and financing group. We and our affiliates have investment banking and other business relationships with a some companies covered by our Research Department. Our research professionals may provide input into our investment banking and other business selection processes. Investors should assume that MOSt and/or its affiliates are seeking or will seek investment banking or other business from the company or companies that are the subject of this material and that the research professionals who were involved in preparing this material may educate investors on investments in such business. The research professionals responsible for the preparation of this document may interact with trading desk personnel, sales personnel and other parties for the purpose of gathering, applying and interpreting information. Our research professionals are paid on the profitability of MOSt which may include earnings from investment banking and other business. MOSt generally prohibits its analysts, persons reporting to analysts, and members of their households from maintaining a financial interest in the securities or derivatives of any companies that the analysts cover. Additionally, MOSt generally prohibits its analysts and persons reporting to analysts from serving as an officer, director, or advisory board member of any companies that the analysts cover. Our salespeople, traders, and other professionals or affiliates may provide oral or written market commentary or trading strategies to our clients that reflect opinions that are contrary to the opinions expressed herein, and our proprietary trading and investing businesses may make investment decisions that are inconsistent with the recommendations expressed herein. In reviewing these materials, you should be aware that any or all of the foregoing among other things, may give rise to real or potential conflicts of interest. MOSt and its affiliated company(ies), their directors and employees and their relatives may; (a) from time to time, have a long or short position in, act as principal in, and buy or sell the securities or derivatives thereof of companies mentioned herein. (b) be engaged in any other transaction involving such securities and earn brokerage or other compensation or act as a market maker in the financial instruments of the company(ies) discussed herein or act as an advisor or lender/borrower to such company(ies) or may have any other potential conflict of interests with respect to any recommendation and other related information and opinions.; however the same shall have no bearing whatsoever on the specific recommendations made by the analyst(s), as the recommendations made by the analyst(s) are completely independent of the views of the affiliates of MOSt even though there might exist an inherent conflict of interest in some of the stocks mentioned in the research report Reports based on technical and derivative analysis center on studying charts company's price movement, outstanding positions and trading volume, as opposed to focusing on a company's fundamentals and, as such, may not match with a report on a company's fundamental analysis. In addition MOST has different business segments / Divisions with independent research separated by Chinese walls catering to different set of customers having various objectives, risk profiles, investment horizon, etc, and therefore may at times have different contrary views on stocks sectors and markets. Unauthorized disclosure, use, dissemination or copying (either whole or partial) of this information, is prohibited. The person accessing this information specifically agrees to exempt MOSt or any of its affiliates or employees from, any and all responsibility/liability arising from such misuse and agrees not to hold MOSt or any of its affiliates or employees responsible for any such misuse and further agrees to hold MOSt or any of its affiliates or employees free and harmless from all losses, costs, damages, expenses that may be suffered by the person accessing this information due to any errors and delays. The information contained herein is based on publicly available data or other sources believed to be reliable. Any statements contained in this report attributed to a third party represent MOSt’s interpretation of the data, information and/or opinions provided by that third party either publicly or through a subscription service, and such use and interpretation have not been reviewed by the third party. This Report is not intended to be a complete statement or summary of the securities, markets or developments referred to in the document. While we would endeavor to update the information herein on reasonable basis, MOSt and/or its affiliates are under no obligation to update the information. Also there may be regulatory, compliance, or other reasons that may prevent MOSt and/or its affiliates from doing so. MOSt or any of its affiliates or employees shall not be in any way responsible and liable for any loss or damage that may arise to any person from any inadvertent error in the information contained in this report. MOSt or any of its affiliates or employees do not provide, at any time, any express or implied warranty of any kind, regarding any matter pertaining to this report, including without limitation the implied warranties of merchantability, fitness for a particular purpose, and non-infringement. The recipients of this report should rely on their own investigations. This report is intended for distribution to institutional investors. Recipients who are not institutional investors should seek advice of their independent financial advisor prior to taking any investment decision based on this report or for any necessary explanation of its contents. Most and it’s associates may have managed or co-managed public offering of securities, may have received compensation for investment banking or merchant banking or brokerage services, may have received any compensation for products or services other than investment banking or merchant banking or brokerage services from the subject company in the past 12 months. Most and it’s associates have not received any compensation or other benefits from the subject company or third party in connection with the research report. Subject Company may have been a client of Most or its associates during twelve months preceding the date of distribution of the research report MOSt and/or its affiliates and/or employees may have interests/positions, financial or otherwise of over 1 % at the end of the month immediately preceding the date of publication of the research in the securities mentioned in this report. To enhance transparency, MOSt has incorporated a Disclosure of Interest Statement in this document. This should, however, not be treated as endorsement of the views expressed in the report. Motilal Oswal Securities Limited is under the process of seeking registration under SEBI (Research Analyst) Regulations, 2014. There are no material disciplinary action that been taken by any regulatory authority impacting equity research analysis activities Analyst Certification The views expressed in this research report accurately reflect the personal views of the analyst(s) about the subject securities or issues, and no part of the compensation of the research analyst(s) was, is, or will be directly or indirectly related to the specific recommendations and views expressed by research analyst(s) in this report. The research analysts, strategists, or research associates principally responsible for preparation of MOSt research receive compensation based upon various factors, including quality of research, investor client feedback, stock picking, competitive factors and firm revenues Disclosure of Interest Statement Analyst ownership of the stock Served as an officer, director or employee ASIAN PAINTS No No Regional Disclosures (outside India) This report is not directed or intended for distribution to or use by any person or entity resident in a state, country or any jurisdiction, where such distribution, publication, availability or use would be contrary to law, regulation or which would subject MOSt & its group companies to registration or licensing requirements within such jurisdictions. For U.S. Motilal Oswal Securities Limited (MOSL) is not a registered broker - dealer under the U.S. Securities Exchange Act of 1934, as amended (the"1934 act") and under applicable state laws in the United States. In addition MOSL is not a registered investment adviser under the U.S. Investment Advisers Act of 1940, as amended (the "Advisers Act" and together with the 1934 Act, the "Acts), and under applicable state laws in the United States. Accordingly, in the absence of specific exemption under the Acts, any brokerage and investment services provided by MOSL, including the products and services described herein are not available to or intended for U.S. persons. This report is intended for distribution only to "Major Institutional Investors" as defined by Rule 15a-6(b)(4) of the Exchange Act and interpretations thereof by SEC (henceforth referred to as "major institutional investors"). This document must not be acted on or relied on by persons who are not major institutional investors. Any investment or investment activity to which this document relates is only available to major institutional investors and will be engaged in only with major institutional investors. In reliance on the exemption from registration provided by Rule 15a-6 of the U.S. Securities Exchange Act of 1934, as amended (the "Exchange Act") and interpretations thereof by the U.S. Securities and Exchange Commission ("SEC") in order to conduct business with Institutional Investors based in the U.S., MOSL has entered into a chaperoning agreement with a U.S. registered broker-dealer, Motilal Oswal Securities International Private Limited. ("MOSIPL"). Any business interaction pursuant to this report will have to be executed within the provisions of this chaperoning agreement. The Research Analysts contributing to the report may not be registered /qualified as research analyst with FINRA. Such research analyst may not be associated persons of the U.S. registered broker-dealer, MOSIPL, and therefore, may not be subject to NASD rule 2711 and NYSE Rule 472 restrictions on communication with a subject company, public appearances and trading securities held by a research analyst account. For Singapore Motilal Oswal Capital Markets Singapore Pte Limited is acting as an exempt financial advisor under section 23(1)(f) of the Financial Advisers Act(FAA) read with regulation 17(1)(d) of the Financial Advisors Regulations and is a subsidiary of Motilal Oswal Securities Limited in India. This research is distributed in Singapore by Motilal Oswal Capital Markets Singapore Pte Limited and it is only directed in Singapore to accredited investors, as defined in the Financial Advisers Regulations and the Securities and Futures Act (Chapter 289), as amended from time to time. In respect of any matter arising from or in connection with the research you could contact the following representatives of Motilal Oswal Capital Markets Singapore Pte Limited: Anosh Koppikar Kadambari Balachandran Email : [email protected] Email : [email protected] Contact : (+65)68189232 Contact : (+65) 68189233 / 65249115 Office Address : 21 (Suite 31),16 Collyer Quay,Singapore 04931 29 January 2015 Motilal Oswal Securities Ltd Motilal Oswal Tower, Level 9, Sayani Road, Prabhadevi, Mumbai 400 025 Phone: +91 22 3982 5500 E-mail: [email protected] 10
© Copyright 2026