
Union Bank of India - InvestmentGuruIndia
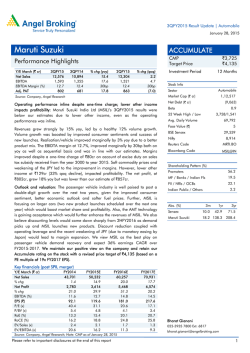
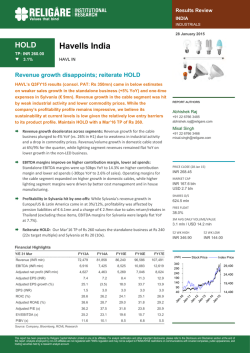
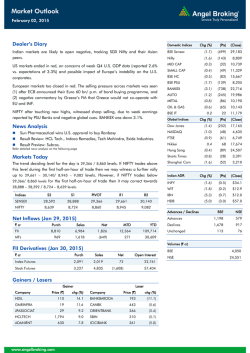
3QFY2015 Result Update | Banking
January 28, 2015
Union Bank of India
ACCUMULATE
Performance Highlights
CMP
Target Price
Particulars (` cr)
NII
Pre-prov. profit
PAT
3QFY15
2,121
1,465
302
2QFY15
2,084
1,334
371
% chg (qoq)
1.8
9.9
(18.6)
3QFY14
1,964
1,262
349
% chg (yoy)
8.0
16.1
(13.3)
Source: Company, Angel Research
Union Bank of India (Union Bank) reported a weak set of numbers for
3QFY2015, with its PAT de-growing by 13.3% yoy owing to 39.6% growth in
provisions; while asset quality continued to deteriorate.
`227
`248
Investment Period
12 Months
Stock Info
Banking
Sector
Market Cap (` cr)
14,400
Beta
2.0
Advances growth moderates; Asset quality continues to witness pressure
During 3QFY2015, advances and deposits grew at a moderate pace at 8.3% and
9.7% yoy, respectively. Within advances, retail, Agriculture and MSME segments
witnessed robust traction, registering a growth of 27.3%, 29.1%, and 24.9%,
respectively. The Corporate segment de-grew by 3.9% yoy; it contributed 53.3%
to the total loan book as compared to 60.1% in 3QFY2014. CASA deposits grew
by 9.5% yoy, while the CASA ratio fell by 7bp yoy to 28.7%. The reported NIM for
the bank fell by 3bp qoq to 2.5%, with yield on advances decreasing by 17bp
qoq to 10.43%. The bank registered a moderate performance on the non-interest
income (excl. treasury) front, with a growth of 2.5% yoy, largely aided by a
16.1% yoy growth in CEB income to `455cr. Overall, other income grew by
29% yoy, with 3.6x growth in profit on sale of investments.
52 Week High / Low
On the asset quality front, slippages came in at `1,738cr (annualized slippage
rate at 3%) compared to `1,960cr (annualized slippage rate at 3.4%) in
2QFY2015. Elevated slippages with lower recoveries/upgrades and write-offs
resulted in a 9.9% qoq increase in Gross NPA levels. Gross and net NPA ratios
increased sequentially by 39bp and 24bp, respectively to 5.1% and 3.0%. During
the quarter, the bank restructured advances worth `1,212cr (as compared to
`931cr in 2QFY2015), thereby taking its outstanding restructured book to
`16,655cr. Slippage from the restructured book was to the tune of `240cr during
the quarter. The Management has guided for a total restructuring pipeline of
around `1,600cr for 4QFY2015.
Promoters
60.5
MF / Banks / Indian Fls
17.3
FII / NRIs / OCBs
10.0
Indian Public / Others
12.3
Outlook and valuation: Union Bank has been witnessing continued asset quality
pressures for several quarters over the last few years, which has severely impacted
its profitability. The RoE for the bank has declined significantly to 10.0% as of
FY2014, impacted by higher credit costs and lower margins. Its Tier I CAR is also
relatively low at 7.3% (CET-1 at 7.0%). At CMP, the stock trades at 0.8x FY2016E
ABV. We recommend an Accumulate rating on the stock.
259.6/100.6
Avg. Daily Volume
6,68,494
Face Value (`)
10
BSE Sensex
29,559
Nifty
8,914
Reuters Code
UNBK.BO
Bloomberg Code
UNBK@IN
Shareholding Pattern (%)
Abs. (%)
3m
1yr
3yr
Sensex
10.5
42.8
71.6
UNBK
4.7
115.4
10.6
Key financials (standalone)
Y/E March (` cr)
NII
% chg
Net profit
% chg
NIM (%)
EPS (`)
P/E (x)
P/ABV (x)
RoA (%)
RoE (%)
FY2013
7,543
11.0
2,158
20.7
2.7
36.0
6.3
0.9
0.7
15.0
FY2014
7,879
4.5
1,696
(21.4)
2.4
28.2
8.5
1.0
0.5
10.3
FY2015E
8,562
8.7
1,808
6.6
2.3
28.5
7.9
0.9
0.5
10.2
Source: Company, Angel Research; Note: CMP as of January 28, 2015
Please refer to important disclosures at the end of this report
FY2016E
9,830
14.8
2,460
36.1
2.4
38.9
5.8
0.8
0.6
12.7
Vaibhav Agrawal
022 – 3935 7800 Ext: 6808
[email protected]
Umesh Matkar
022 – 3935 7800 Ext: 6839
[email protected]
1
Union Bank of India | 3QFY2015 Result Update
Exhibit 1: 3QFY2015 performance (standalone)
Particulars (` cr)
3QFY15
2QFY15
% chg (qoq)
3QFY14
% chg (yoy)
FY2014
FY2013
% chg
Interest earned
8,044
7,943
1.3
7,550
6.5
29,349
25,125
16.8
- on Advances / Bills
6,027
5,991
0.6
5,565
8.3
21,740
19,140
13.6
- on investments
1,895
1,851
2.4
1,911
(0.8)
7,270
5,671
28.2
51
53
(4.6)
36
39.5
179
199
(10.1)
- on balance with RBI & Others
- on others
71
49
45.6
38
86.9
160
115
39.7
Interest Expended
5,923
5,859
1.1
5,587
6.0
21,470
17,582
22.1
Net Interest Income
2,121
2,084
1.8
1,964
8.0
7,879
7,543
4.5
Other income
877
811
8.1
680
29.0
2,822
2,552
10.6
Other income excl. treasury
625
736
(15.1)
610
2.5
2,335
2,075
12.5
- Fee Income
455
448
1.6
392
16.1
1,634
1,423
14.8
- Treasury Income
252
75
236.0
70
260.0
487
477
2.1
- Recov. from written off a/cs
42
92
(54.3)
87
(51.7)
266
324
(18.0)
128
196
(34.7)
131
(2.0)
435
328
32.6
Operating income
2,998
2,896
3.5
2,643
13.4
10,701
10,095
6.0
Operating expenses
1,533
1,562
(1.8)
1,382
11.0
5,483
4,512
21.5
966
944
2.3
823
17.3
3,308
2,755
20.1
- Profit on exchange transactions
- Employee expenses
- Other Opex
567
618
(8.1)
559
1.5
2,175
1,757
23.8
1,465
1,334
9.9
1,262
16.1
5,218
5,583
(6.5)
Provisions & Contingencies
852
785
8.5
610
39.6
3,149
2,518
25.0
- Provisions for NPAs
674
603
11.8
497
35.6
2,106
1,555
35.4
- Provisions for Investments
(26)
79
(132.9)
44
(159.1)
87
198
(56.1)
- Other Provisions
204
103
97.2
69
193.8
956
765
24.9
PBT
613
549
11.8
651
(5.8)
2,069
3,064
(32.5)
Provision for Tax
311
177
75.5
302
2.9
373
906
(58.9)
2,158
(21.4)
Pre-provision Profit
PAT
302
371
(18.6)
349
(13.3)
1,696
Effective Tax Rate (%)
50.7
32.3
1840bp
46.4
428bp
18.0
29.6 (1157)bp
Source: Company, Angel Research
January 28, 2015
2
Union Bank of India | 3QFY2015 Result Update
Exhibit 2: 3QFY2015 performance analysis (standalone)
Particulars
3QFY15
2QFY15
% chg (qoq)
3QFY14
% chg (yoy)
Advances (` cr)
2,41,512
2,38,393
1.3
2,23,024
8.3
Deposits (` cr)
3,12,912
3,00,165
4.2
2,85,125
9.7
77.2
79.4
(224)bp
78.2
(104)bp
Current deposits (` cr)
21,891
18,789
16.5
21,008
4.2
Savings deposits (` cr)
68,019
67,400
0.9
61,104
11.3
CASA deposits (` cr)
Balance sheet
Credit-to-Deposit Ratio (%)
89,910
86,189
4.3
82,112
9.5
Reported CASA ratio (%)
28.7
28.7
2bp
28.8
(7)bp
CAR (%)
10.3
10.3
0bp
10.1
18bp
7.3
7.3
1bp
6.8
57bp
Yield on funds
8.9
9.1
(16)bp
9.0
(11)bp
Cost of funds
6.6
6.7
(12)bp
6.7
(11)bp
Reported NIM
2.50
2.53
(3)bp
2.5
0bp
Cost-to-income ratio
51.1
53.9
(281)bp
52.3
(114)bp
12,596
11,462
9.9
8,776
43.5
5.1
4.7
39bp
3.9
123bp
7,118
3.0
57.3
6,449
2.7
58.0
10.4
24bp
(72)bp
5,048
2.3
60.0
41.0
69bp
(272)bp
Slippage ratio (%)
3.0
3.4
(40)bp
2.2
82bp
LLP to avg. assets (%)
0.7
0.7
7bp
0.6
13bp
Tier 1 CAR (%)
Profitability Ratios (%)
Asset quality
Gross NPAs (` cr)
Gross NPAs (%)
Net NPAs (` cr)
Net NPAs (%)
Prov. Coverage Ratio (%)
Source: Company, Angel Research
Business growth moderates; NIM falls 3bp qoq
During 3QFY2015, advances grew at a moderate pace at 8.3% yoy. Within
advances, retail, Agriculture and MSME witnessed robust traction, registering a
growth of 27.3%, 29.1%, and 24.9%, respectively. The Corporate segment
de-grew by 3.9% yoy and contributed by 53.3% to the total loan book as
compared to 60.1% in 3QFY2014. Exposure to the infra sector to total advances
has fallen from 17.1% to 15.7% on a qoq basis. The Management has maintained
its guidance of 10-12% loan growth for FY2015 with focus on retail and SME.
On the deposits front, the bank witnessed a moderate growth of 9.7% yoy.
Aggregate deposits growth came in much higher than growth in CASA deposits,
resulting in a 7bp yoy drop in CASA ratio to 28.7% in 3QFY2015. CASA deposits
grew by 9.5% yoy with current deposits growing at a slow pace at 4.2% yoy, while
saving deposits grew by 11.3% yoy.
Yield on funds for the bank decreased by 16bp qoq to 8.9% due to interest
reversal on slippages. Cost of funds decreased 12bp qoq to 6.6%. Consequently,
the reported NIM for the bank declined by 3bp qoq to 2.5%.
.
January 28, 2015
3
Union Bank of India | 3QFY2015 Result Update
Exhibit 3: Business grows moderates
Adv. yoy chg (%)
Dep. yoy chg (%)
CDR (%, RHS)
79.4
80.0
30.0
78.7
78.2
20.0
Exhibit 4: CASA ratio trends
CASA ratio (%)
29.6
20.0
29.4
78.0
77.2
77.0
29.2
29.0
9.8
28.8
28.7
28.7
3QFY15
29.1
2QFY15
3QFY14
4QFY14
1QFY15
2QFY15
3QFY15
28.4
74.0
6.3
29.5
17.8
9.5
8.3
9.7
10.1
12.9
1QFY15
9.7
4.6
20.0
19.1
4QFY14
-
7.6
28.6
-
28.2
Source: Company, Angel Research
Source: Company, Angel Research
Exhibit 5: Cost of funds lower by 12bp qoq...
Exhibit 6: NIM declines by 3bp qoq
(%)
(%)
7.00
10.0
9.5
9.5
28.8
76.0
10.0
3QFY14
CASA yoy growth (%, RHS)
6.69
6.58
6.65
6.7
6.58
2.70
2.50
6.50
2.6
2.55
2.50
2.53
2.5
2QFY15
3QFY15
2.30
6.00
2.10
5.50
1.90
5.00
1.70
4.50
3QFY14
4QFY14
1QFY15
2QFY15
3QFY15
Source: Company, Angel Research
1.50
3QFY14
4QFY14
1QFY15
Source: Company, Angel Research
Moderate growth in non-interest income (excl. treasury)
The bank registered a moderate performance on the non-interest income (excl.
treasury) front, with a growth of 2.5% yoy. The CEB Income for the bank grew at a
healthy pace of 16.1% yoy to `455cr, while recoveries from written off accounts
registered a de-growth of 51.7% yoy to `42cr. Treasury income for the bank came
in at `252cr, more than three times as compared to `70cr in 3QFY2014, thereby
aiding overall other income to grow strongly by 29% yoy to `877cr.
Exhibit 7: CEB Income aids growth in non-interest income (excl. treasury)
Particulars (` cr)
3QFY15 2QFY15
% chg (qoq) 3QFY14
% chg (yoy)
CEB
455
448
1.6
392
16.1
Treasury
252
75
236.0
70
260.0
42
92
(54.3)
87
(51.7)
Forex
128
196
(34.7)
131
(2.3)
Other income
877
811
8.1
680
29.0
Other income excl. treasury
625
736
(15.1)
610
2.5
Recoveries
Source: Company, Angel Research
January 28, 2015
4
Union Bank of India | 3QFY2015 Result Update
Asset quality pressure persists
During the quarter, the bank continued to witness pressure on the asset quality
front, as addition of stressed assets (slippages and incremental restructuring)
remained at elevated levels. Slippages came in at `1,738cr (annualized slippage
rate of 3%) compared to `1,968cr (annualized slippage rate of 3.4%) in
2QFY2015. Recoveries/upgrades for the bank came in lower sequentially at
`604cr for the quarter. The PCR for the bank declined sequentially by 72bp to
57.3%, which resulted in a sequential increase of 10.4% in net NPA levels, higher
than the sequential increase of 9.9% witnessed in gross NPA levels. On a relative
basis, Gross and net NPA ratios deteriorated sequentially by 39bp and 24bp
respectively to 5.1% and 3.0%. During the quarter, the bank restructured advances
worth `1,212cr (as compared to `931cr in 2QFY2015), thereby taking its
outstanding restructured book to `16,655cr. Slippage from the restructured book
was to the tune of `240cr during the quarter. The Management has guided for a
total restructuring pipeline of around `1,600cr for 4QFY2015.
Exhibit 8: Slippages higher on yoy basis
Slippages (%)
4.5
Credit cost (%, RHS)
0.7
0.8
3.0
Exhibit 9: NPA ratios witness pressure qoq
0.9
0.7
0.6
Gross NPAs (%)
5.0
0.6
0.5
Net NPAs (%)
PCR (%, RHS)
65.0
6.0
60.0
59.9
58.9
4.0
58.0
3.0
3QFY15
-
5.08
2.95
2QFY15
4.7
2.7
3.0
1QFY15
1.0
4.3
2.5
3.4
4QFY14
55.0
4.1
2.3
2.2
3QFY14
-
2.0
3.9
2.3
2.3
0.3
2.2
1.5
3QFY14
4QFY14
1QFY15
2QFY15
3QFY15
-
50.0
Source: Company, Angel Research
Source: Company, Angel Research
Exhibit 10: Steady network expansion continues
Exhibit 11: C-I ratio trends..
7,000
3,888
4,003
4,034
4,000
3,871
3,800
3,752
5,000
3QFY14
4QFY14
1QFY15
2QFY15
3QFY15
3,600
Source: Company, Angel Research
January 28, 2015
50.0
40.0
2.0
1.7
1.7
1.6
1.7
1.6
1.6
30.0
1.2
20.0
0.8
3,000
10.0
2,000
-
51.1
6,000
3,900
3,700
Opex to average assets (%, RHS)
53.9
5,830
Cost-to-income ratio (%)
51.2
4,000
6,429
ATMs (RHS)
6,628
6,618
53.3
4,100
6,621
52.3
Branches
60.0
57.3
3QFY14
4QFY14
1QFY15
2QFY15
3QFY15
0.4
-
Source: Company, Angel Research
5
Union Bank of India | 3QFY2015 Result Update
Outlook and valuation
Union Bank has been witnessing continued asset quality pressures for several
quarters over the last few years, which has severely impacted its profitability. The
RoE for the bank has declined significantly from 20.9% in FY2011 to 10.0% as of
FY2014, impacted by higher credit costs and lower margins. Its Tier I CAR is also
relatively low at 7.3% (CET-1 at 7.0%). At CMP, the stock trades at 0.9x FY2016E
ABV. We recommend an Accumulate rating on the stock.
Exhibit 12: Recommendation summary
CMP
(`)
Tgt. price
(`)
Upside
(%)
FY2016E
P/ABV (x)
FY2016E
Tgt. P/ABV (x)
FY2016E
P/E (x)
FY2014-16E
EPS CAGR (%)
FY2016E
RoA (%)
FY2016E
RoE (%)
1,058
1,115
5.3
4.2
4.4
20.3
21.3
2.0
22.2
384
443
15.4
2.6
3.0
15.9
19.3
1.7
16.4
883
1,018
15.3
2.7
3.1
14.6
16.3
1.7
19.7
Buy
565
675
19.5
2.6
3.2
15.2
18.4
1.9
18.4
SBI*
Accumulate
334
355
6.1
1.9
1.7
14.0
28.2
0.8
13.8
FedBk
Neutral
145
-
-
1.5
-
11.9
11.6
1.2
12.9
SIB
Accumulate
28
31
11.2
1.0
1.1
8.0
(4.1)
0.7
12.6
BOB
Buy
224
264
17.7
1.1
1.3
8.2
13.8
0.8
13.8
PNB
Buy
207
256
24.0
1.0
1.2
6.7
29.6
0.9
14.1
BOI
Buy
291
373
28.4
0.7
0.9
4.8
19.7
0.6
13.0
IndBk
Buy
210
255
21.7
0.7
0.8
5.7
23.4
0.8
11.2
Vijaya Bank
Buy
49
58
18.1
0.7
0.8
5.3
38.9
0.5
12.4
OBC
Buy
313
379
20.9
0.7
0.9
7.0
8.3
0.5
9.4
Allahabad Bank Buy
127
150
17.7
0.7
0.9
6.6
(5.1)
0.4
8.7
UnionBk
Accumulate
227
248
9.5
0.8
0.9
5.8
20.6
0.6
12.7
CanBk
Buy
476
548
15.2
0.8
1.0
6.3
19.4
0.6
12.5
Company
Reco.
HDFCBk
Accumulate
ICICIBk*
Buy
YesBk
Buy
AxisBk
Source: Company, Angel Research; Note:*Target multiples=SOTP Target Price/ABV (including subsidiaries), #Without adjusting for SASF
Company Background
Union Bank of India (UNBK) is one of the largest public sector banks, with a
balance sheet size of around `3.7lakh cr. The bank has a reasonably large
pan-India presence with 4,034 plus branches and around 6,618 ATMs. The bank
was one of the early adopters of core banking technology amongst PSU banks.
January 28, 2015
6
Union Bank of India | 3QFY2015 Result Update
Income statement (standalone)
Y/E March (` cr)
NII
- YoY Growth (%)
Other Income
- YoY Growth (%)
Operating Income
- YoY Growth (%)
FY11
FY12
FY13
FY14
FY15E
FY16E
6,216
6,793
7,543
7,879
8,562
9,830
48.3
9.3
11.0
4.5
8.7
14.8
2,039
2,448
2,552
2,822
3,318
3,525
3.2
20.1
4.2
10.6
17.6
6.2
8,255
9,241
10,095
10,701
11,880
13,355
33.9
11.9
9.2
6.0
11.0
12.4
3,950
3,988
4,512
5,483
6,201
6,666
57.5
0.9
13.2
21.5
13.1
7.5
4,305
5,254
5,583
5,218
5,679
6,688
17.6
22.0
6.3
(6.5)
8.8
17.8
1,350
2,541
2,518
3,149
2,898
3,016
63.3
88.3
(0.9)
25.0
(8.0)
4.1
2,955
2,713
3,064
2,069
2,781
3,672
- YoY Growth (%)
4.3
(8.2)
13.0
(32.5)
34.6
32.0
Prov. for Taxation
873
926
906
373
973
1,212
Operating Expenses
- YoY Growth (%)
Pre - Provision Profit
- YoY Growth (%)
Prov. & Cont.
- YoY Growth (%)
Profit Before Tax
- as a % of PBT
PAT
- YoY Growth (%)
29.6
34.1
29.6
18.0
35.0
33.0
2,082
1,787
2,158
1,696
1,808
2,460
0.3
(14.2)
20.7
(21.4)
6.6
36.1
FY14
FY15E
FY16E
Balance sheet (standalone)
Y/E March (` cr)
Share Capital
FY12
FY13
635
662
708
741
741
741
12,129
13,972
16,588
17,734
19,125
21,021
202,461
222,869
263,762
297,676
3,30,420
3,70,070
19.1
10.1
18.3
12.9
11.0
12.0
Borrowings
7,126
11,719
17,007
22,696
23,490
26,184
Tier 2 Capital
6,190
6,190
6,790
6,620
8,327
8,118
Other Liab & Prov.
7,443
6,800
7,006
8,282
9,390
10,269
Total Liabilities
235,984
262,211
311,861
353,750
3,91,493
4,36,404
Cash balances
17,610
11,634
10,763
18,420
16,521
18,504
Bank balances
2,488
4,042
5,447
4,653
5,872
6,546
Reserves & Surplus
Deposits
- Growth (%)
Investments
58,399
62,364
80,830
93,723
1,08,451
1,19,567
150,986
177,882
208,102
229,104
2,52,015
2,82,257
26.5
17.8
17.0
10.1
10.0
12.0
Fixed Assets
2,293
2,336
2,479
2,608
2,800
3,027
Other Assets
4,208
3,955
4,239
5,241
5,834
6,503
235,984
262,211
311,861
353,750
3,91,493
4,36,404
20.9
11.1
18.9
13.4
10.7
11.5
Advances
- Growth (%)
Total Assets
- Growth (%)
January 28, 2015
FY11
7
Union Bank of India | 3QFY2015 Result Update
Ratio analysis
Y/E March
FY11
FY12
FY13
FY14
FY15E
FY16E
3.0
2.8
2.7
2.4
2.3
2.4
47.8
43.1
44.7
51.2
52.2
49.9
Profitability ratios (%)
NIMs
Cost to Income Ratio
RoA
1.0
0.7
0.7
0.5
0.5
0.6
RoE
20.9
14.8
15.0
10.3
10.2
12.7
CASA Ratio
31.8
31.3
31.0
29.5
30.4
31.0
Credit/Deposit Ratio
74.6
79.8
78.9
77.0
76.3
76.3
CAR
13.0
11.9
11.4
10.7
11.3
10.8
8.7
8.4
8.2
7.7
7.9
7.8
Gross NPAs
2.4
3.0
3.0
4.1
5.3
5.7
Net NPAs
1.2
1.7
1.6
2.3
3.0
2.9
Slippages
2.4
2.5
2.2
2.6
2.8
2.3
Loan Loss Prov./Avg. Assets
0.6
0.6
0.5
0.7
0.7
0.7
67.6
62.2
65.2
59.9
57.5
60.0
39.6
32.2
36.0
28.2
28.5
38.9
203.4
217.3
247.1
248.4
241.3
271.2
8.0
8.0
8.0
4.0
5.5
7.5
PER (x)
5.7
7.0
6.3
8.5
7.9
5.8
P/ABVPS (x)
1.1
1.0
0.9
1.0
0.9
0.8
Dividend Yield
3.8
3.8
3.8
1.9
2.4
3.3
NII
2.9
2.7
2.6
2.4
2.3
2.4
(-) Prov. Exp.
0.6
1.0
0.9
0.9
0.8
0.7
Adj. NII
2.3
1.7
1.8
1.4
1.5
1.6
Treasury
0.2
0.2
0.2
0.1
0.2
0.1
Int. Sens. Inc.
2.5
1.9
1.9
1.6
1.7
1.8
Other Inc.
0.7
0.8
0.7
0.7
0.7
0.7
Op. Inc.
3.2
2.7
2.6
2.3
2.4
2.5
Opex
1.8
1.6
1.6
1.6
1.7
1.6
PBT
1.4
1.1
1.1
0.6
0.7
0.9
Taxes
0.4
0.4
0.3
0.1
0.3
0.3
RoA before pref. div.
1.0
0.7
0.8
0.5
0.5
0.6
Pref. div.
0.0
0.0
0.0
0.0
0.0
0.0
RoA
1.0
0.7
0.7
0.5
0.5
0.6
B/S ratios (%)
- Tier I
Asset Quality (%)
Provision Coverage
Per Share Data (`)
EPS
ABVPS
DPS
Valuation Ratios
DuPont Analysis (%)
January 28, 2015
Leverage (x)
21.7
20.7
20.0
20.5
21.2
21.5
RoE
20.9
14.8
15.0
10.3
10.2
12.7
8
Union Bank of India | 3QFY2015 Result Update
Research Team Tel: 022 - 39357800
E-mail: [email protected]
Website: www.angelbroking.com
DISCLAIMER
This document is solely for the personal information of the recipient, and must not be singularly used as the basis of any investment
decision. Nothing in this document should be construed as investment or financial advice. Each recipient of this document should make
such investigations as they deem necessary to arrive at an independent evaluation of an investment in the securities of the companies
referred to in this document (including the merits and risks involved), and should consult their own advisors to determine the merits and
risks of such an investment.
Angel Broking Pvt. Ltd., its affiliates, directors, its proprietary trading and investment businesses may, from time to time, make
investment decisions that are inconsistent with or contradictory to the recommendations expressed herein. The views contained in this
document are those of the analyst, and the company may or may not subscribe to all the views expressed within.
Reports based on technical and derivative analysis center on studying charts of a stock's price movement, outstanding positions and
trading volume, as opposed to focusing on a company's fundamentals and, as such, may not match with a report on a company's
fundamentals.
The information in this document has been printed on the basis of publicly available information, internal data and other reliable
sources believed to be true, but we do not represent that it is accurate or complete and it should not be relied on as such, as this
document is for general guidance only. Angel Broking Pvt. Ltd. or any of its affiliates/ group companies shall not be in any way
responsible for any loss or damage that may arise to any person from any inadvertent error in the information contained in this report.
Angel Broking Pvt. Ltd. has not independently verified all the information contained within this document. Accordingly, we cannot
testify, nor make any representation or warranty, express or implied, to the accuracy, contents or data contained within this document.
While Angel Broking Pvt. Ltd. endeavours to update on a reasonable basis the information discussed in this material, there may be
regulatory, compliance, or other reasons that prevent us from doing so.
This document is being supplied to you solely for your information, and its contents, information or data may not be reproduced,
redistributed or passed on, directly or indirectly.
Angel Broking Pvt. Ltd. and its affiliates may seek to provide or have engaged in providing corporate finance, investment banking or
other advisory services in a merger or specific transaction to the companies referred to in this report, as on the date of this report or in
the past.
Neither Angel Broking Pvt. Ltd., nor its directors, employees or affiliates shall be liable for any loss or damage that may arise from or in
connection with the use of this information.
Note: Please refer to the important ‘Stock Holding Disclosure' report on the Angel website (Research Section). Also, please refer to the
latest update on respective stocks for the disclosure status in respect of those stocks. Angel Broking Pvt. Ltd. and its affiliates may have
investment positions in the stocks recommended in this report.
Disclosure of Interest Statement
1. Analyst ownership of the stock
2. Angel and its Group companies ownership of the stock
3. Angel and its Group companies' Directors ownership of the stock
4. Broking relationship with company covered
Union Bank of India
No
No
No
No
Note: We have not considered any Exposure below ` 1 lakh for Angel, its Group companies and Directors
Ratings (Returns):
January 28, 2015
Buy (> 15%)
Reduce (-5% to -15%)
Accumulate (5% to 15%)
Sell (< -15%)
Neutral (-5 to 5%)
9


© Copyright 2026