Geometric - Business Standard
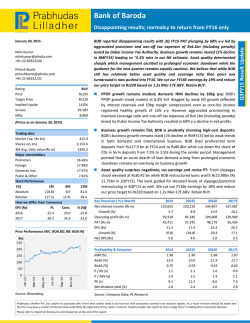
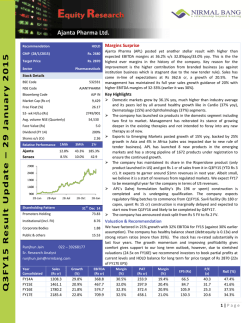
Geometric Geometric has reported Q3FY15 results below PLe/consensus expectations on all counts. The company continues to see improvement in deal pipeline which is expected to yield better revenue momentum in CY15/FY16. We retain “Accumulate” with a revised target price of Rs150 (from Rs145), as we roll our model for FY17. January 28, 2015 Shashi Bhusan [email protected] +91‐22‐66322300 Narrow miss at topline, S&M spend resulted in EBITDA miss: Revenue grew by 3.3% QoQ Rs2,889m (PLe: Rs2,846m, Cons: Rs2,888m) and a growth of 1.0% QoQ in USD terms to $46.6m (PLe: US$47.0m, Cons.: US$47.7m). EBITDA margins declined by 280bps to 11.8% (PLe: 14.8%, Cons: 14.6%) due to increase in employee costs, and higher SG&A cost. EPS grew by 0.8% QoQ to Rs2.51 (PLe: Rs2.67, Cons: Rs2.55) mainly due to forex gain (Rs56.44m). Strong deal closure, highest in the recent years: The sales transformation undertaken in CY14 has started bearing fruits in terms of larger deals and conversion and increase in average new deal size. The company has won new deals worth US$13.09m. Moreover, several transactions that have been in the pipeline over the previous three quarters, have made significant progress in this quarter. The management is confident of winning two very important transactions in Aerospace vertical in the coming quarter which will translate into revenue starting Q1FY16. Organizational restructuring during the quarter: In the organizational re‐ structuring last quarter, global Head of Sales will now report to the COO (Mr. Nitin Tappe), thus ensuring single point responsibility for all operations, and allowing the MD to focus on strategy going forward. Also, CFO Mr. Neeraj Dutt has decided to leave and he will be replaced by Mr. Shashank Patkar. Valuation & Recommendation – ‘Accumulate’ with revise TP of Rs150: We expect Geometric’s operational performance to get better in CY15/FY16. However, the management has indicated that the weakness in Euro will have an impact in Q4FY15 as well. We do not expect downside from the current level as expectations have bottomed out. We retain our ‘Accumulate’ rating, with a revised TP of Rs150 (from Rs 145), as we roll our model for FY17. Hussain Kagzi [email protected] +91‐22‐66322242 Rating Price Target Price Implied Upside Sensex Nifty Accumulate Rs126 Rs150 19.0% 29,559 8,914 (Prices as on January 28, 2015) Trading data Market Cap. (Rs bn) Shares o/s (m) 3M Avg. Daily value (Rs m) Major shareholders Promoters Foreign Domestic Inst. Public & Other Stock Performance (%) 1M 6M Absolute 0.3 (12.4) Relative (8.2) (26.2) How we differ from Consensus EPS (Rs) PL Cons. 2016 14.2 16.7 2017 16.2 21.7 8.0 63.0 134 38.46% 4.84% 0.28% 56.42% 12M 27.2 (15.7) % Diff. ‐14.9 ‐25.2 Price Performance (RIC: GEOM.BO, BB: GEO IN) Key financials (Y/e March) Revenues (Rs m) Growth (%) EBITDA (Rs m) PAT (Rs m) EPS (Rs) Growth (%) Net DPS (Rs) 2014 10,955 7.4 2,072 462 7.3 (33.2) 4.0 2015E 11,297 3.1 1,530 720 11.3 55.7 4.9 2016E 12,534 10.9 1,724 903 14.2 25.4 5.9 2017E 13,842 10.4 1,860 1,030 16.2 14.1 8.1 2014 18.9 15.5 17.3 0.7 3.5 17.3 2.4 3.2 2015E 13.5 18.5 18.8 0.6 4.5 11.1 2.1 3.9 2016E 13.8 21.3 21.1 0.5 3.8 8.9 1.8 4.7 2017E 13.4 21.0 20.9 0.4 3.2 7.8 1.5 6.4 Source: Bloomberg Jan‐15 Nov‐14 Sep‐14 Jul‐14 May‐14 Mar‐14 Jan‐14 (Rs) 180 160 140 120 100 80 60 40 20 0 Profitability & Valuation EBITDA margin (%) RoE (%) RoCE (%) EV / sales (x) EV / EBITDA (x) PE (x) P / BV (x) Net dividend yield (%) Source: Company Data; PL Research Prabhudas Lilladher Pvt. Ltd. and/or its associates (the 'Firm') does and/or seeks to do business with companies covered in its research reports. As a result investors should be aware that the Firm may have a conflict of interest that could affect the objectivity of the report. Investors should consider this report as only a single factor in making their investment decision. Please refer to important disclosures and disclaimers at the end of the report Q3FY15 Result Update Weak quarter, but strong deals closure Exhibit 1: Geometric Revenue soft. Margin and EPS below expectation (Rs m) Y/e March Q3FY15 Q2FY15 QoQ gr. Q3FY14 YoY gr. Cons. 46.6 46.1 1.0% 44.4 5.0% 47.7 47.0 ‐0.9% Rs/$ 61.99 60.64 2.2% 62.00 0.0% 61 60.56 2.4% Sales 2,889 2,797 3.3% 2,753 4.9% 2,888 2,846 1.5% 340 407 ‐16.6% 519 ‐34.6% 421 421 ‐19.3% Revenue (USD m) EBITDA EBITDA Margin Pl (e) Variance(PLe v/s Actual) 11.8% 14.6% ‐280 bps 18.9% ‐710 bps 14.6% 14.8% ‐304 bps PBT 327 326 0.3% 182 80.2% 313 340 ‐3.8% Tax 107 109 ‐2.2% 53 100.7% 147 112 ‐4.8% 33% 34% ‐84 bps 29% 333 bps 47% 33% ‐34 bps PAT Tax Margin 164 163 0.5% 75 117.6% 166 174 ‐5.9% EPS (Rs) 2.51 2.49 0.8% 1.18 112.5% 2.55 2.67 ‐5.9% Source: Company Data, PL Research Other highlights: 1) 4.1% @cc growth excl. JV. 2) Signed deals worth US$13.1m. 3) Capex: Rs114.1m (Q2FY15: Rs175.2m). 4) DSO decreased from 47 days in the last quarter to 60 days. 5) ETR: 32.7% (Q2FY15: 33.5%). 6) Working capital loan: US$5.11m; PCFC loans: US$3m. 7) Utilization, including trainees, inched up to 86.6% (Q2FY15: 85.5%). 8) Attrition was down to 12.2% vs 14.8% in Q2FY15 9) Employee strength of 4,886 (Q2FY15: 4,740). 10) To invest INR12m in MoU with College of Engineering, Pune and Colorado State University for setting up a 3D printing lab. Exhibit 2: Europe a drag on overall revenue, APac witnessed strong growth momentum By Geography Q3FY15 Q2FY15 QoQ gr. Q3FY14 YoY gr. USA 27.2 26.4 3.2% 24.9 9.5% Europe 13.4 14.4 ‐7.3% 14.7 ‐9.2% APAC 3.0 2.3 28.6% 1.7 71.1% India 3.1 3.0 1.0% 3.1 ‐0.9% Total 46.6 46.1 1.0% 44.4 5.0% USA 58.4% 57.2% 123 bps 56.0% 243 bps Europe 28.7% 31.3% ‐258 bps 33.2% ‐448 bps APAC 6.3% 5.0% 136 bps 3.9% 245 bps India 6.6% 6.6% 0 bps 7.0% ‐39 bps as % of Total Source: Company Data, PL Research January 28, 2015 2 Geometric Exhibit 3: Revenue growth in Direct Industrial segment By Customer Segments Q3FY15 Q2FY15 QoQ gr. Q3FY14 YoY gr. 30.1 29.3 2.7% 27.4 10.0% Direct Industrial Strategic Partners 1.0 1.0 ‐4.5% 1.0 ‐4.3% Software ISV 15.5 15.8 ‐1.7% 16.0 ‐3.1% Total 46.6 46.1 1.0% 44.4 5.0% 64.7% 63.6% 105 bps 61.7% 298 bps 2.1% 2.2% ‐12 bps 2.3% ‐20 bps 33.2% 34.2% ‐93 bps 36.0% ‐278 bps as % of Total Direct Industrial Strategic Partners Software ISV Source: Company Data, PL Research Exhibit 4: Growth in Eng. Services & Products was impacted by decline in Software services By Service Lines Q3FY15 Q2FY15 QoQ gr. Q3FY14 YoY gr. Software Services 26.4 27.2 ‐3.0% 27.2 ‐2.9% Engineering Services 15.1 14.1 7.4% 12.1 25.4% Products 3.7 3.4 7.7% 2.8 30.7% Others (Embedded) 1.4 1.4 0.0% 46.6 46.1 1.0% 44.4 5.0% Software Services 56.6% 59.0% ‐237 bps 61.2% ‐460 bps Engineering Services 32.5% 30.5% 191 bps 27.2% 528 bps Products 8.0% 7.5% 49 bps 6.4% 157 bps Others (Embedded) 3.0% 3.0% ‐3 bps 5.2% ‐225 bps Total as % of Total Source: Company Data, PL Research Exhibit 5: Healthy employee addition, Attrition moderated and Utilization improved QoQ Employee metrics Q3FY15 Q2FY15 4,886 146 Including Trainees Excluding Trainees Attrition Total employees Net addition QoQ gr. Q3FY14 YoY gr. 4,740 3.1% 4,395 11.2% 194 ‐24.7% (33) ‐542.4% 86.6% 85.5% 110 bps 87.4% ‐80 bps 87.4% 86.3% 110 bps 88.5% ‐110 bps 12.2% 14.8% ‐260 bps 12.1% 10 bps Utilisation Source: Company Data, PL Research Exhibit 6: Highest deal closure in the recent years Order Book ($ m) New Deals won Q3FY15 Q2FY15 QoQ gr. Q3FY14 YoY gr. 13.1 9.5 37.2% 9.3 41.5% Source: Company Data, PL Research January 28, 2015 3 Geometric Exhibit 7: Strong QoQ growth in FPP revenue Revenue by Delivery Type Q3FY15 Q2FY15 QoQ gr. Q3FY14 YoY gr. 38.5 39.9 ‐3.5% 38.5 0.1% Time & Material Fixed Price 8.1 6.2 30.2% 5.9 36.3% 46.6 46.1 1.0% 44.4 5.0% Time & Material 82.6% 86.5% ‐390 bps 86.6% ‐400 bps Fixed Price 17.4% 13.5% 390 bps 13.4% 400 bps Total % of Total Revenue Source: Company Data, PL Research Exhibit 8: Growth in Top 2‐5 Clients, but decline in Top client continued Client metrics Q3FY15 Q2FY15 QoQ gr. Q3FY14 YoY gr. <$1m 33 31 6.5% 48 ‐31.3% US$ 1‐5m 22 22 0.0% 20 10.0% US$ 5‐10m 5 4 25.0% 3 66.7% US$ 10m+ 3 3 0.0% 3 0.0% New clients added 0 3 ‐100.0% 2 ‐100.0% 63 62 1.6% 74 ‐14.9% Q3FY15 Q2FY15 QoQ Q3FY14 YoY Top Client 12.6 12.9 ‐2.6% 13.8 ‐8.6% Top 2‐5 Clients 11.7 11.1 5.3% 9.8 19.3% Top 5 Clients 24.2 24.0 1.0% 23.5 3.0% 6.5 6.5 1.0% 5.8 13.0% Top 10 Clients 30.8 30.4 1.0% 29.3 5.0% Non Top 10 Clients 15.8 15.7 1.0% 15.1 5.0% Total 46.6 46.1 1.0% 44.4 5.0% Top Client 27.0% 28.0% ‐100 bps 31.0% ‐400 bps Top 5 Clients 52.0% 52.0% 0 bps 53.0% ‐100 bps Top 10 Clients 66.0% 66.0% 0 bps 66.0% 0 bps Clients billed US$ m Top 6‐10 Clients Source: Company Data, PL Research January 28, 2015 4 Income Statement (Rs m) Y/e March 2014 2015E 2016E 2017E Net Revenue Raw Material Expenses Gross Profit Employee Cost Other Expenses EBITDA Depr. & Amortization Net Interest Other Income Profit before Tax Total Tax Profit after Tax Ex‐Od items / Min. Int. Adj. PAT Avg. Shares O/S (m) EPS (Rs.) 11,297 7,477 3,820 — 2,290 1,530 339 39 150 1,303 443 860 140 720 63.5 11.3 12,534 8,218 4,315 — 2,591 1,724 363 40 169 1,490 447 1,043 140 903 63.5 14.2 13,842 9,121 4,722 — 2,862 1,860 387 41 194 1,625 455 1,170 140 1,030 63.5 16.2 10,955 6,670 4,285 — 2,213 2,072 345 35 (674) 1,018 387 631 169 462 63.5 7.3 Geometric Balance Sheet Abstract (Rs m) Y/e March 2014 2015E 2016E 2017E 3,353 33 815 4,202 1,092 805 955 916 805 2,505 2,394 434 4,201 3,900 33 815 4,748 1,114 805 955 1,440 1,124 3,537 3,221 434 4,748 4,568 33 815 5,416 1,152 805 955 2,070 1,468 3,799 3,197 434 5,416 5,226 33 815 6,074 1,208 805 955 2,672 2,007 4,195 3,531 434 6,074 Quarterly Financials (Rs m) Y/e March Q4FY14 Q1FY15 Q2FY15 Q3FY15 2,688 432 16.1 91 8 32 365 132 180 180 2,797 407 14.6 93 8 20 326 109 163 163 2,889 340 11.8 77 8 73 327 107 164 164 Shareholder's Funds Total Debt Other Liabilities Total Liabilities Net Fixed Assets Goodwill Investments Net Current Assets Cash & Equivalents Other Current Assets Current Liabilities Other Assets Total Assets Cash Flow Abstract (Rs m) Y/e March 2014 2015E 2016E 2017E C/F from Operations C/F from Investing C/F from Financing Inc. / Dec. in Cash Opening Cash Closing Cash FCFF FCFE 1,310 (548) (281) 480 324 805 729 724 994 (362) (313) 319 805 1,124 — — 1,121 (401) (376) 344 1,124 1,468 580 580 1,494 (443) (512) 540 1,468 2,007 912 912 Key Financial Metrics Y/e March Growth 2014 2015E 2016E Revenue (%) EBITDA (%) PAT (%) EPS (%) 7.4 6.2 (32.7) (33.2) 3.1 (26.1) 55.7 55.7 10.9 12.7 25.4 25.4 10.4 7.9 14.1 14.1 13.8 7.2 21.1 21.3 13.4 7.4 20.9 21.0 (0.3) — (0.4) — 8.9 1.8 3.8 0.5 7.8 1.5 3.2 0.4 30.0 11.3 10.0 64.2 28.0 11.9 9.5 88.5 EBITDA Margin (%) PAT Margin (%) RoCE (%) RoE (%) Balance Sheet Net Debt : Equity Net Wrkng Cap. (days) Valuation PER (x) P / B (x) EV / EBITDA (x) EV / Sales (x) Earnings Quality 2,734 456 16.7 80 8 (176) 193 79 67 67 Profitability Net Revenue EBITDA % of revenue Depr. & Amortization Net Interest Other Income Profit before Tax Total Tax Profit after Tax Adj. PAT 18.9 4.2 17.3 15.5 13.5 6.4 18.8 18.5 (0.2) — (0.3) — 17.3 2.4 3.5 0.7 11.1 2.1 4.5 0.6 Eff. Tax Rate 38.0 Other Inc / PBT (66.1) Eff. Depr. Rate (%) 12.0 FCFE / PAT 156.6 Source: Company Data, PL Research. 34.0 11.6 10.5 — 2017E Key Operating Metrics Y/e March 2014 2015E 2016E 2017E Total Technical Billed (Headcount) 14,312 Utilization (excl. Trainees) 87 Currency (Re/$) 60 Software Dev. Exp. (% of Sales) 61 Sales & Mktg. (% of Sales) 20.2 Revenue (US$ m) 181 Source: Company Data, PL Research. 14,813 86 61 66 20.3 185 15,850 86 62 66 20.7 204 17,276 87 61 66 20.7 229 January 28, 2015 5 Geometric Prabhudas Lilladher Pvt. Ltd. 3rd Floor, Sadhana House, 570, P. B. Marg, Worli, Mumbai‐400 018, India Tel: (91 22) 6632 2222 Fax: (91 22) 6632 2209 % of Total Coverage Rating Distribution of Research Coverage 45% 40% 35% 30% 25% 20% 15% 10% 5% 0% PL’s Recommendation Nomenclature 42.4% 38.8% 17.6% Accumulate Reduce : Over 15% Outperformance to Sensex over 12‐months Accumulate : Outperformance to Sensex over 12‐months Reduce : Underperformance to Sensex over 12‐months Sell : Over 15% underperformance to Sensex over 12‐months Trading Buy : Over 10% absolute upside in 1‐month Trading Sell : Over 10% absolute decline in 1‐month Not Rated (NR) : No specific call on the stock Under Review (UR) : 1.2% BUY BUY Rating likely to change shortly Sell DISCLAIMER/DISCLOSURES ANALYST CERTIFICATION We/I, Mr. Shashi Bhusan (BTech (IIT), MBA (IIM)), Mr. Hussain Kagzi (BMS), Research Analysts, authors and the names subscribed to this report, hereby certify that all of the views expressed in this research report accurately reflect our views about the subject issuer(s) or securities. We also certify that no part of our compensation was, is, or will be directly or indirectly related to the specific recommendation(s) or view(s) in this report. Terms & conditions and other disclosures: Prabhudas Lilladher Pvt. Ltd, Mumbai, India (hereinafter referred to as “PL”) is engaged in the business of Stock Broking, Portfolio Manager, Depository Participant and distribution for third party financial products. PL is a subsidiary of Prabhudas Lilladher Advisory Services Pvt Ltd. which has its various subsidiaries engaged in business of commodity broking, investment banking, financial services (margin funding) and distribution of third party financial/other products, details in respect of which are available at www.plindia.com This document has been prepared by the Research Division of PL and is meant for use by the recipient only as information and is not for circulation. This document is not to be reported or copied or made available to others without prior permission of PL. It should not be considered or taken as an offer to sell or a solicitation to buy or sell any security. The information contained in this report has been obtained from sources that are considered to be reliable. However, PL has not independently verified the accuracy or completeness of the same. Neither PL nor any of its affiliates, its directors or its employees accepts any responsibility of whatsoever nature for the information, statements and opinion given, made available or expressed herein or for any omission therein. Recipients of this report should be aware that past performance is not necessarily a guide to future performance and value of investments can go down as well. The suitability or otherwise of any investments will depend upon the recipient's particular circumstances and, in case of doubt, advice should be sought from an independent expert/advisor. Either PL or its affiliates or its directors or its employees or its representatives or its clients or their relatives may have position(s), make market, act as principal or engage in transactions of securities of companies referred to in this report and they may have used the research material prior to publication. PL may from time to time solicit or perform investment banking or other services for any company mentioned in this document. PL is in the process of applying for certificate of registration as Research Analyst under Securities and Exchange Board of India (Research Analysts) Regulations, 2014 PL submits that no material disciplinary action has been taken on us by any Regulatory Authority impacting Equity Research Analysis activities. PL or its research analysts or its associates or his relatives do not have any financial interest in the subject company. PL or its research analysts or its associates or his relatives do not have actual/beneficial ownership of one per cent or more securities of the subject company at the end of the month immediately preceding the date of publication of the research report. PL or its research analysts or its associates or his relatives do not have any material conflict of interest at the time of publication of the research report. PL or its associates might have received compensation from the subject company in the past twelve months. PL or its associates might have managed or co‐managed public offering of securities for the subject company in the past twelve months or mandated by the subject company for any other assignment in the past twelve months. PL or its associates might have received any compensation for investment banking or merchant banking or brokerage services from the subject company in the past twelve months. PL or its associates might have received any compensation for products or services other than investment banking or merchant banking or brokerage services from the subject company in the past twelve months PL or its associates might have received any compensation or other benefits from the subject company or third party in connection with the research report. PL encourages independence in research report preparation and strives to minimize conflict in preparation of research report. PL or its analysts did not receive any compensation or other benefits from the subject Company or third party in connection with the preparation of the research report. PL or its Research Analysts do not have any material conflict of interest at the time of publication of this report. It is confirmed that Mr. Shashi Bhusan (BTech (IIT), MBA (IIM)), Mr. Hussain Kagzi (BMS), Research Analysts of this report have not received any compensation from the companies mentioned in the report in the preceding twelve months Compensation of our Research Analysts is not based on any specific merchant banking, investment banking or brokerage service transactions. The Research analysts for this report certifies that all of the views expressed in this report accurately reflect his or her personal views about the subject company or companies and its or their securities, and no part of his or her compensation was, is or will be, directly or indirectly related to specific recommendations or views expressed in this report. The research analysts for this report has not served as an officer, director or employee of the subject company PL or its research analysts have not engaged in market making activity for the subject company Our sales people, traders, and other professionals or affiliates may provide oral or written market commentary or trading strategies to our clients that reflect opinions that are contrary to the opinions expressed herein, and our proprietary trading and investing businesses may make investment decisions that are inconsistent with the recommendations expressed herein. In reviewing these materials, you should be aware that any or all o the foregoing, among other things, may give rise to real or potential conflicts of interest. PL and its associates, their directors and employees may (a) from time to time, have a long or short position in, and buy or sell the securities of the subject company or (b) be engaged in any other transaction involving such securities and earn brokerage or other compensation or act as a market maker in the financial instruments of the subject company or act as an advisor or lender/borrower to the subject company or may have any other potential conflict of interests with respect to any recommendation and other related information and opinions. January 28, 2015 6
© Copyright 2026
