
Idea Cellular - Business Standard
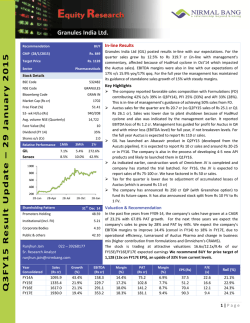
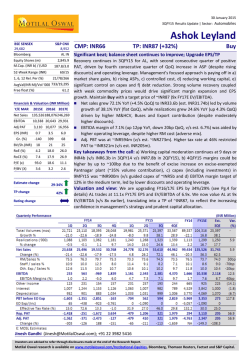
Results Review INDIA TELECOM 28 January 2015 HOLD Idea Cellular TP: INR 160.00 3.6% IDEA IN Secular data growth continues – upgrade to HOLD Idea reported better-than-expected Q3FY15 results, with revenues up 5.9% QoQ on 19%/5% data/voice revenue growth and EBITDA margins expanding 140bps QoQ on lower network costs. While we have been cautious on the REPORT AUTHORS sector given high expectations from voice pricing, these have now moderated. Also, Idea has underperformed the Nifty by 28% and data Rumit Dugar penetration remains a secular growth driver for the company. Upgrade from SELL to HOLD with a Mar’16 TP of Rs 160 (Rs 135 earlier). +91 22 6766 3444 [email protected] Data-led revenue growth: Idea’s Q3 revenues grew 5.9% QoQ, beating RCMLe of 5.2%, with 6.9mn subscriber additions and a 3.7% ARPU QoQ improvement to Rs 182. MOUs increased 1% QoQ to 388 minutes while voice realisations were flat QoQ at 36p/min. The solid 19% QoQ data revenue growth was driven by a 17%/ 1.5% increase in volumes/realisations. EBITDA margins expanded 140bps QoQ to 34.3% on lower network costs. PAT at Rs 7.6bn (+61% YoY) came in slightly ahead estimates (RCMLe: Rs 7.4bn). Karan Taurani Debt to go up in upcoming auctions: With capital raised via a QIP, Idea’s net debt has declined to Rs 120bn from Rs 128bn in Q2FY15, implying a 1.12x net-debt/ EBITDA (FY15) multiple. However, we think the company will have to continue investments in expanding its network and acquiring spectrum assets. We note that strong data growth needs Idea to defend its spectrum share in the upcoming auctions, which could lead to high gearing. We estimate outflows of Rs 174bn for the company in the upcoming auctions. INR 166.05 Upgrade to HOLD: Data growth remains strong and with Idea’s strong execution, valuations at 5.6x EV/EBITDA are not expensive. We raise our FY16/FY17 EBITDA estimates by 13% to factor in better margins and data revenues. We have a Mar’16 TP of Rs 160 (rolled over from a Dec’15 TP of Rs 135 earlier) for the stock set at 6.5x FY17E EV/EBITDA. Upcoming spectrum auctions remain a key stock overhang. +91 22 6766 3445 [email protected] PRICE CLOSE (28 Jan 15) MARKET CAP INR 597.4 bln USD 9.7 bln SHARES O/S 3,544.1 mln FREE FLOAT 28.6% 3M AVG DAILY VOLUME/VALUE 4.6 mln / USD 11.6 mln 52 WK HIGH 52 WK LOW INR 178.10 INR 125.10 Financial Highlights Y/E 31 Mar FY13A FY14A FY15E FY16E FY17E Revenue (INR mln) 224,575 265,188 315,795 358,734 397,867 EBITDA (INR mln) 60,044 83,336 105,977 111,496 123,799 Adjusted net profit (INR mln) 10,108 19,677 30,465 26,688 33,702 3.1 5.9 8.5 7.4 9.4 40.5 94.4 43.3 (12.7) 26.3 DPS (INR) 0.0 0.0 0.0 0.0 0.0 ROIC (%) 5.9 7.4 9.1 8.3 10.8 (INR) Adjusted EPS (INR) Adjusted EPS growth (%) Adjusted ROAE (%) 7.4 12.7 16.7 12.6 13.9 Adjusted P/E (x) 54.4 28.0 19.5 22.4 17.7 EV/EBITDA (x) 12.0 8.6 7.5 6.6 5.6 3.8 3.3 2.8 2.4 2.1 P/BV (x) Stock Price Index Price 190 29,400 140 24,400 90 19,400 40 14,400 Source: Company, Bloomberg, RCML Research This report has been prepared by Religare Capital Markets Limited or one of its affiliates. For analyst certification and other important disclosures, please refer to the Disclosure and Disclaimer section at the end of this report. Analysts employed by non-US affiliates are not registered with FINRA regulation and may not be subject to FINRA/NYSE restrictions on communications with covered companies, public appearances, and trading securities held by a research analyst account. HOLD Idea Cellular TP: INR 160.00 3.6% IDEA IN Results Review INDIA TELECOM Fig 1 - Idea: Quarterly review Rs mn, YE March Q3FY15 Expected Diff (%) Q2FY15 Revenue 80,174 79,617 0.7 EBITDA 27,528 26,149 5.3 EBIT 12,702 14,123 PBT 11,719 7,673 Net profit %Q/Q Q3FY14 % Y/Y 75,699 5.9 66,131 21.2 24,908 10.5 20,557 33.9 (10.1) 13,120 (3.2) 8,891 42.9 12,213 (4.0) 11,674 0.4 7,316 60.2 7,430 3.3 7,559 1.5 4,677 64.0 2.13 2.07 3.2 2.10 1.5 1.41 51.3 34.3% 32.8% EPS EBITDA margins 32.9% 31.1% Source: Company, RCML Research Fig 2 - Expected outflow on spectrum auctions Jan 2015 reserve price (Rs cr) Spectrum (mhz) Cost based on Reserve Price (Rs cr) Auction price (Rs cr) 900mhz 1800mhz (20% higher) (30% higher) 900mhz 1800mhz Total 900mhz 1800mhz 900mhz 1800mhz Maharashtra 7.8 2 9.8 420 290 3,276 581 3,931 755 Gujarat 6.2 0 6.2 339 238 2,102 0 2,522 0 A.P 6.2 1.8 8 271 163 1,680 293 2,016 381 Karnataka* 6.2 0 6.2 286 155 1,773 0 2,128 0 Kerala 6.2 1.8 8 150 75 930 135 1,116 176 Punjab* 7.8 0 7.8 141 71 1,100 0 1,320 0 Haryana 6.2 0 6.2 64 32 397 0 476 0 UP(West) 6.2 1.8 8 152 95 942 171 1,131 222 M.P 6.2 1.8 8 138 69 856 124 1,027 161 Total (Rs cr) 13,056 1,304 15,667 1,696 Total (Rs cr) 14,360 17,363 Source: RCML Research, TRAI Fig 3 - Target Price (based on spectrum outflow impact) Rs/share TP Based on 6.5xFY17E EV/EBITDA 205 (-) Spectrum outflow impact (Rs 174bn) 48 157 Revised TP Source: RCML Research Fig 4 - Idea: Estimate revisions Rs mn, YE March New estimates Old Estimates Change FY16 FY17 FY16 FY17 Revenues 358,734 397,867 328,855 EBITDA 111,496 123,799 98,716 EBITDA margins (%) FY16 FY17 350,413 9.1 13.5 109,702 12.9 12.8 31.1 31.1 30.0 31.3 106 bps -19 bps EBIT 46,415 59,128 43,257 52,585 7.3 12.4 Pre Tax Profit 41,546 52,259 34,012 46,154 22.2 13.2 PAT 26,688 33,702 22,788 30,923 17.1 9.0 EPS 7.4 9.4 6.4 8.7 15.9 7.7 155,500 159,500 147,000 - 5.8 195 211 188 - 3.7 Metrics Subscribers ('000) ARPU (Rs) Source: RCML Research 28 January 2015 Page 2 of 6 HOLD Idea Cellular TP: INR 160.00 3.6% IDEA IN Results Review INDIA TELECOM Fig 5 - Idea: Operating metrics Key Operating Metrics 3QFY13 4QFY13 1QFY14 2QFY14 3QFY14 4QFY14 1QFY15 2QFY15 3QFY15 113.9 121.6 125.0 127.2 128.7 135.8 139.0 143.6 150.5 (1.6) 7.7 3.4 2.2 1.5 7.1 3.2 4.6 6.9 158 167 174 164 169 173 181 176 179 Q/Q Growth 6.8 5.7 4.2 (5.7) 3.0 2.4 4.6 (2.8) 1.7 Y/Y Growth (0.6) 4.4 11.5 10.8 7.0 3.6 4.0 7.3 5.9 MOU (mins) 384 406 398 368 376 397 401 384 388 Q/Q Growth 7.0 5.7 (2.0) (7.5) 2.2 5.6 1.0 (4.2) 1.0 Y/Y Growth 4.1 7.1 5.0 2.5 (2.1) (2.2) 0.8 4.3 3.2 ARPM (Rs/min) 41.1 41.1 43.7 44.6 44.9 43.6 45.1 45.8 46.1 Q/Q Growth (0.2) (0.0) 6.3 1.9 0.9 (3.0) 3.6 1.5 0.7 Y/Y Growth (5.0) (2.6) 6.2 8.1 9.2 5.9 3.2 2.8 2.6 132.2 143.4 147.3 138.8 144.6 157.1 165.2 162.5 170.7 Subscribers ('000) - EOP Net-adds ('000) Reported ARPU (Rs/month) Total Traffic (mn Mins) Q/Q Growth 5.2 8.5 2.8 (5.8) 4.2 8.6 5.2 (1.7) 5.1 Y/Y Growth 16.0 15.3 12.5 10.5 9.4 9.5 12.2 17.0 18.1 3QFY13 4QFY13 1QFY14 2QFY14 3QFY14 4QFY14 1QFY15 2QFY15 3QFY15 55,786 60,614 65,388 63,233 66,131 70,438 75,610 75,699 80,174 5.0 8.7 7.9 (3.3) 4.6 6.5 7.3 0.1 5.9 10.9 12.9 18.8 19.0 18.5 16.2 15.6 19.7 21.2 (12,042) Source: Company Fig 6 - Idea: Quarterly financials Rs mn, year-end March Revenues (Rs Mn) Q/Q Growth (%) Y/Y Growth Interconnection & access costs (10,183) (10,770) (10,951) (9,563) (10,090) (11,011) (11,444) (11,442) Q/Q Growth 7.1 5.8 1.7 (12.7) 5.5 9.1 3.9 (0.0) 5.2 Y/Y Growth 20.4 17.8 13.1 0.6 (0.9) 2.2 4.5 19.6 19.4 (9,034) License and spectrum fee (5,897) (7,191) (7,465) (6,959) (7,232) (7,582) (8,352) (8,467) Q/Q Growth 4.4 21.9 3.8 (6.8) 3.9 4.8 10.2 1.4 6.7 Y/Y Growth 5.1 (2.5) 24.1 23.2 22.6 5.4 11.9 21.7 24.9 (14,209) (14,298) (15,436) (15,862) (16,423) (17,270) (18,168) (17,894) (17,980) 5.7 0.6 8.0 2.8 3.5 5.2 5.2 (1.5) 0.5 Network costs Q/Q Growth Y/Y Growth Sales & Marketing 23.2 13.7 15.1 17.9 15.6 20.8 17.7 12.8 9.5 (5,993) (6,486) (5,878) (5,636) (6,343) (6,817) (6,760) (6,570) (7,377) 12.3 Q/Q Growth 6.9 8.2 (9.4) (4.1) 12.5 7.5 (0.8) (2.8) Y/Y Growth (6.8) (4.7) (17.2) 0.5 5.8 5.1 15.0 16.6 16.3 (2,039) (2,163) (1,822) (2,016) (2,041) (2,335) (2,212) (2,339) (2,424) 5.8 6.1 (15.8) 10.6 1.3 14.4 (5.3) 5.8 3.6 G&A Q/Q Growth Y/Y Growth Employee costs (15.2) 29.0 5.3 4.6 0.1 8.0 21.4 16.1 18.7 (2,731) (2,976) (3,073) (3,482) (3,445) (3,121) (3,569) (4,080) (3,789) (7.1) Q/Q Growth (1.7) 9.0 3.3 13.3 (1.1) (9.4) 14.4 14.3 Y/Y Growth 12.7 16.8 12.2 25.3 26.2 4.9 16.1 17.2 10.0 (41,052) (43,883) (44,624) (43,518) (45,574) (48,137) (50,504) (50,792) (52,646) Q/Q Growth 5.5 6.9 1.7 (2.5) 4.7 5.6 4.9 0.6 3.7 Y/Y Growth 11.4 9.4 9.7 11.8 11.0 9.7 13.2 16.7 15.5 14,734 16,731 20,763 19,715 20,557 22,302 25,106 24,908 27,528 26.4 27.6 31.8 31.2 31.1 31.7 33.2 32.9 34.3 Q/Q Growth 3.6 13.6 24.1 (5.0) 4.3 8.5 12.6 (0.8) 10.5 Y/Y Growth 9.6 23.3 44.6 38.6 39.5 33.3 20.9 26.3 33.9 11,719 Total operating costs EBITDA EBITDA margin (%) Profit before tax 3,482 5,395 7,199 6,971 7,316 8,956 10,945 11,674 Q/Q Growth (1.5) 54.9 33.5 (3.2) 4.9 22.4 22.2 6.7 0.4 Y/Y Growth 16.4 56.3 114.2 97.1 110.1 66.0 52.0 67.5 60.2 7,673 Reported PAT 2,286 3,082 4,627 4,476 4,677 5,898 7,009 7,559 Q/Q Growth (4.8) 34.8 50.1 (3.3) 4.5 26.1 18.8 7.9 1.5 Y/Y Growth 13.7 29.0 97.6 86.5 104.6 91.4 51.5 68.9 64.0 Source: Company 28 January 2015 Page 3 of 6 HOLD Idea Cellular TP: INR 160.00 3.6% IDEA IN Results Review INDIA TELECOM Per Share Data Y/E 31 Mar (INR) FY13A FY14A FY15E FY16E FY17E Reported EPS 3.1 5.9 8.5 7.4 9.4 Adjusted EPS 3.1 5.9 8.5 7.4 9.4 DPS 0.0 0.0 0.0 0.0 0.0 43.7 50.1 60.1 68.2 78.4 FY13A FY14A FY15E FY16E FY17E 3.2 2.7 2.5 2.0 1.8 EV/EBITDA 12.0 8.6 7.5 6.6 5.6 Adjusted P/E 54.4 28.0 19.5 22.4 17.7 3.8 3.3 2.8 2.4 2.1 FY13A FY14A FY15E FY16E FY17E EBITDA margin 26.7 31.4 33.6 31.1 31.1 EBIT margin 11.3 14.4 16.7 12.9 14.9 Adjusted profit margin 4.5 7.4 9.6 7.4 8.5 Adjusted ROAE 7.4 12.7 16.7 12.6 13.9 ROCE 5.9 7.5 9.2 7.8 9.5 Revenue 15.0 18.1 19.1 13.6 10.9 EBITDA 18.0 38.8 27.2 5.2 11.0 Adjusted EPS 40.5 94.4 43.3 (12.7) 26.3 6.2 35.8 (5.9) (2.4) 0.2 17 BVPS Valuation Ratios Y/E 31 Mar (x) EV/Sales P/BV Financial Ratios Y/E 31 Mar Profitability & Return Ratios (%) YoY Growth (%) Invested capital Working Capital & Liquidity Ratios Receivables (days) 14 12 14 17 Inventory (days) 2 2 5 9 9 Payables (days) 134 141 141 141 145 Current ratio (x) 0.6 0.5 0.8 0.9 0.9 Quick ratio (x) 0.1 0.0 0.3 0.4 0.5 Gross asset turnover 0.5 0.7 0.8 0.8 0.8 Total asset turnover 0.7 0.6 0.7 0.7 0.8 Net interest coverage ratio 2.7 5.0 5.5 5.3 5.5 Adjusted debt/equity 0.9 1.2 0.7 0.5 0.3 Turnover & Leverage Ratios (x) DuPont Analysis Y/E 31 Mar (%) FY13A FY14A FY15E FY16E FY17E Tax burden (Net income/PBT) 64.1 64.6 65.0 64.2 64.5 Interest burden (PBT/EBIT) 62.4 79.8 89.0 89.5 88.4 EBIT margin (EBIT/Revenue) 11.3 14.4 16.7 12.9 14.9 Asset turnover (Revenue/Avg TA) 65.1 64.0 66.6 71.7 75.1 251.2 268.0 260.9 236.0 218.9 7.4 12.7 16.7 12.6 13.9 Leverage (Avg TA/Avg equities) Adjusted ROAE 28 January 2015 Page 4 of 6 HOLD Idea Cellular TP: INR 160.00 3.6% IDEA IN Results Review INDIA TELECOM Income Statement Y/E 31 Mar (INR mln) FY13A FY14A FY15E FY16E FY17E 224,575 265,188 315,795 358,734 397,867 EBITDA 60,044 83,336 105,977 111,496 123,799 EBIT 25,266 38,142 52,716 46,415 59,128 Net interest income/(expenses) (9,495) (7,700) (9,632) (8,687) (10,687) Other income/(expenses) 0 0 3,817 3,817 3,817 Exceptional items 0 0 0 0 0 EBT 15,772 30,442 46,901 41,546 52,259 Income taxes Total revenue (5,664) (10,765) (16,436) (14,858) (18,557) Extraordinary items 0 0 0 0 0 Min. int./Inc. from associates 0 0 0 0 0 10,108 19,677 30,465 26,688 33,702 Reported net profit Adjustments 0 0 0 0 0 10,108 19,677 30,465 26,688 33,702 Y/E 31 Mar (INR mln) FY13A FY14A FY15E FY16E FY17E Accounts payables 66,172 74,046 88,276 102,776 115,497 Adjusted net profit Balance Sheet Other current liabilities 0 0 0 0 0 Provisions 1,777 1,777 1,777 1,777 1,777 Debt funds 140,437 206,350 176,732 168,732 148,732 Other liabilities 11,180 18,133 18,133 18,133 18,133 Equity capital 33,143 33,196 35,966 35,966 35,966 Reserves & surplus 111,073 132,073 162,538 189,226 222,928 Shareholders' fund 144,216 165,269 198,504 225,192 258,894 Total liabilities and equities 363,782 465,575 483,422 516,609 543,033 11,709 4,036 30,485 57,888 70,922 9,601 8,006 15,573 17,691 19,621 726 683 4,326 4,914 5,450 41,335 42,636 42,636 42,636 42,636 Cash and cash eq. Accounts receivables Inventories Other current assets Investments 0 0 0 0 0 291,539 295,959 276,146 279,225 290,149 8,811 114,194 114,194 114,194 114,194 61 61 61 61 61 Deferred tax assets, net 0 0 0 0 0 Other assets 0 0 0 0 0 Total assets 363,782 465,575 483,422 516,609 543,033 Y/E 31 Mar (INR mln) FY13A FY14A FY15E FY16E FY17E Net income + Depreciation 44,886 64,872 83,727 91,769 98,373 9,495 7,700 9,632 8,687 10,687 0 0 0 0 0 7,200 8,211 3,019 11,794 10,255 Net fixed assets CWIP Intangible assets Cash Flow Statement Interest expenses Non-cash adjustments Changes in working capital Other operating cash flows Cash flow from operations Capital expenditures 4,907 6,953 0 0 0 66,487 87,736 96,378 112,249 119,315 (58,453) (154,997) (33,448) (68,160) (75,595) Change in investments 0 0 0 0 0 Other investing cash flows 0 0 0 0 0 Cash flow from investing (58,453) (154,997) (33,448) (68,160) (75,595) Equities issued 3,607 1,376 2,770 0 0 Debt raised/repaid 7,065 65,913 (29,618) (8,000) (20,000) Interest expenses (9,495) (7,700) (9,632) (8,687) (10,687) Dividends paid 0 0 0 0 0 Other financing cash flows 0 0 0 0 0 Cash flow from financing 1,178 59,589 (36,480) (16,687) (30,687) 9,212 (7,673) 26,449 27,403 13,033 11,709 4,036 30,485 57,888 70,922 Changes in cash and cash eq Closing cash and cash eq 28 January 2015 Page 5 of 6 RESEARCH DISCLAIMER Important Disclosures This report was prepared, approved, published and distributed by a Religare Capital Markets (“RCM”) group company located outside of the United States (a “non-US Group Company”). This report is distributed in the U.S. by Enclave Capital LLC (“Enclave Capital”), a U.S. registered broker dealer, on behalf of RCM only to major U.S. institutional investors (as defined in Rule 15a-6 under the U.S. Securities Exchange Act of 1934 (the “Exchange Act”)) pursuant to the exemption in Rule 15a-6 and any transaction effected by a U.S. customer in the securities described in this report must be effected through Enclave Capital. Neither the report nor any analyst who prepared or approved the report is subject to U.S. legal requirements or the Financial Industry Regulatory Authority, Inc. (“FINRA”) or other regulatory requirements pertaining to research reports or research analysts. No non-US Group Company is registered as a broker-dealer under the Exchange Act or is a member of the Financial Industry Regulatory Authority, Inc. or any other U.S. self-regulatory organization. Subject to any applicable laws and regulations at any given time, non-US Group Companies, their affiliates or companies or individuals connected with RCM (together, “Connected Companies”) may make investment decisions that are inconsistent with the recommendations or views expressed in this report and may have long or short positions in, may from time to time purchase or sell (as principal or agent) or have a material interest in any of the securities mentioned or related securities or may have or have had a business or financial relationship with, or may provide or have provided investment banking, capital markets and/or other services to, the entities referred to herein, their advisors and/or any other connected parties. Any particular arrangements or relationships are disclosed below. As a result, recipients of this report should be aware that Connected Companies may have a conflict of interest that could affect the objectivity of this report. See “Special Disclosures” for certain additional disclosure statements, if applicable. This report is only for distribution to investment professionals and institutional investors. Analyst Certification Each of the analysts identified in this report certifies, with respect to the companies or securities that the individual analyses, that (1) the views expressed in this report reflect his or her personal views about all of the subject companies and securities and (2) no part of his or her compensation was, is or will be directly or indirectly dependent on the specific recommendations or views expressed in this report. Analysts and strategists are paid in part by reference to the profitability of RCM. Stock Ratings are defined as follows Recommendation Interpretation (Recommendation structure changed with effect from March 1, 2009) Recommendation Buy Hold Sell Expected absolute returns (%) over 12 months More than 15% Between 15% and –5% Less than –5% Expected absolute returns are based on the share price at market close unless otherwise stated. Stock recommendations are based on absolute upside (downside) and have a 12-month horizon. Our target price represents the fair value of the stock based upon the analyst’s discretion. We note that future price fluctuations could lead to a temporary mismatch between upside/downside for a stock and our recommendation. Stock Ratings Distribution As of 1 January 2015, out of 194 rated stocks in the RCM coverage universe, 109 have BUY ratings (including 7 that have been investment banking clients in the last 12 months), 59 are rated HOLD and 26 are rated SELL. Research Conflict Management Policy RCM research has been published in accordance with our conflict management policy, which is available here. Disclaimers This report is not directed to, or intended for distribution to or use by, any person or entity who is a citizen or resident of or located in any locality, state, country or other jurisdiction where such distribution, publication, availability or use would be contrary to law or regulation or which would subject RCM to any registration or licensing requirement within such jurisdiction(s). This report is strictly confidential and is being furnished to you solely for your information. All material presented in this report, unless specifically indicated otherwise, is under copyright to RCM. None of the material, its content, or any copy of such material or content, may be altered in any way, transmitted, copied or reproduced (in whole or in part) or redistributed in any form to any other party, without the prior express written permission of RCM. All trademarks, service marks and logos used in this report are trademarks or service marks or registered trademarks or service marks of RCM or its affiliates, unless specifically mentioned otherwise. not treat recipients as its customers by virtue of their receiving the report. The investments or services contained or referred to in this report may not be suitable for you and it is recommended that you consult an independent investment advisor if you are in doubt about such investments or investment services. In addition, nothing in this report constitutes investment, legal, accounting or tax advice or a representation that any investment or strategy is suitable or appropriate to your individual circumstances or otherwise constitutes a personal recommendation to you. Information and opinions presented in this report were obtained or derived from sources that RCM believes to be reliable, but RCM makes no representations or warranty, express or implied, as to their accuracy or completeness or correctness. RCM accepts no liability for loss arising from the use of the material presented in this report, except that this exclusion of liability does not apply to the extent that liability arises under specific statutes or regulations applicable to RCM. This report is not to be relied upon in substitution for the exercise of independent judgment. RCM may have issued, and may in the future issue, a trading call regarding this security. Trading calls are short term trading opportunities based on market events and catalysts, while stock ratings reflect investment recommendations based on expected absolute return over a 12-month period as defined in the disclosure section. Because trading calls and stock ratings reflect different assumptions and analytical methods, trading calls may differ directionally from the stock rating. Past performance should not be taken as an indication or guarantee of future performance, and no representation or warranty, express or implied, is made regarding future performance. Information, opinions and estimates contained in this report reflect a judgment of its original date of publication by RCM and are subject to change without notice. The price, value of and income from any of the securities or financial instruments mentioned in this report can fall as well as rise. The value of securities and financial instruments is subject to exchange rate fluctuation that may have a positive or adverse effect on the price or income of such securities or financial instruments. Investors in securities such as ADR’s, the values of which are influenced by currency volatility, effectively assume this risk. This report is distributed in India by Religare Capital Markets Limited, which is a registered intermediary regulated by the Securities and Exchange Board of India. In Dubai, it is being distributed by Religare Capital Markets (Hong Kong) Limited (Dubai Branch) which is licensed and regulated by the Dubai Financial Services Authority. In Singapore, it is being distributed (i) by Religare Capital Markets (Singapore) Pte. Limited (“RCMS”) (Co. Reg. No. 200902065N) which is a holder of a capital markets services licence and an exempt financial adviser in Singapore and (ii) solely to persons who qualify as ““institutional investors” or “accredited investors” as defined in section 4A(1) of the Securities and Futures Act, Chapter 289 of Singapore (the “SFA”). Pursuant to regulations 33, 34, 35 and 36 of the Financial Advisers Regulations (the “FAR”), sections 25, 27 and 36 of the Financial Advisers Act, Chapter 110 of Singapore shall not apply to RCMS when providing any financial advisory service to an accredited investor, or “overseas investor” (as defined in regulation 36 of the FAR). Persons in Singapore should contact RCMS in respect of any matters arising from, or in connection with this publication/communication. In Hong Kong, it is being distributed by Religare Capital Markets (Hong Kong) Limited (“RCM HK”), which is licensed and regulated by the Securities and Futures Commission, Hong Kong. In Australia, it is being distributed by RCMHK which is approved under ASIC Class Orders. In Sri Lanka, it is being distributed by Bartleet Mallory Stockbrokers, which is licensed under Securities and Exchange Commission of Sri Lanka. If you wish to enter into a transaction please contact the RCM entity in your home jurisdiction unless governing law provides otherwise. In jurisdictions where RCM is not registered or licensed to trade in securities, transactions will only be effected in accordance with applicable securities legislation which may vary from one jurisdiction to another and may require that the trade be made in accordance with applicable exemptions from registration or licensing requirements. Religare Capital Markets does and seeks to do business with companies covered in our research report. As a result, investors should be aware that the firm may have a conflict of interest that could affect the objectivity of research produced by Religare Capital Markets. Investors should consider our research as only a single factor in making their investment decision. Any reference to a third party research material or any other report contained in this report represents the respective research organization's estimates and views and does not represent the views of RCM and RCM, its officers, employees do not accept any liability or responsibility whatsoever with respect to its accuracy or correctness and RCM has included such reports or made reference to such reports in good faith. This report may provide the addresses of, or contain hyperlinks to websites. Except to the extent to which the report refers to material on RCM’s own website, RCM takes no responsibility whatsoever for the contents therein. Such addresses or hyperlinks (including addresses or hyperlinks to RCM’s own website material) is provided solely for your convenience and information and the content of the linked site does not in any way form part of this report. Accessing such website or following such link through this report or RCM’s website shall be at your own risk. Special Disclosures (if applicable) Not Applicable The information, tools and material presented in this report are provided to you for information purposes only and are not to be used or considered as an offer or the solicitation of an offer to sell or to buy or subscribe for securities or other financial instruments. RCM has not taken any steps to ensure that the securities referred to in this report are suitable for any particular investor. RCM will 28 January 2015 Page 6 of 6


© Copyright 2026