
Thermax - Business Standard
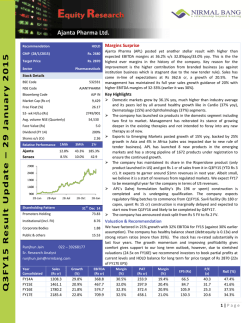
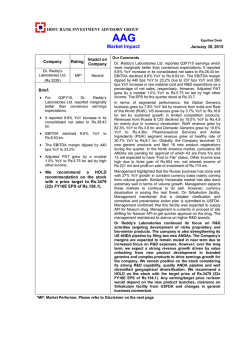
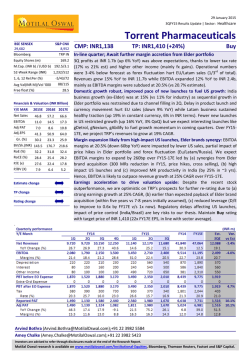
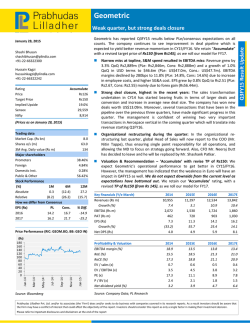
Results Review INDIA CAPITAL GOODS 30 January 2015 SELL Thermax TP: INR 940.00 17.9% TMX IN Valuations ahead of fundamentals; d/g to SELL TMX’s Q3 results (sales/PAT at Rs 11.5bn/Rs 762mn; +13%/+14% YoY) were in line with estimates. Order inflows for the quarter were relatively strong (Rs 12.3bn) after weak order inflows through H1FY15. We note that while the results and order inflows are strong, our estimates factor in the same and also a gradual pick-up in the investment cycle through FY16/FY17E. We REPORT AUTHORS Misal Singh believe, current valuations are expensive given TMX’s expected returns and growth profile. Maintain TP, however downgrade to SELL (from HOLD). +91 22 6766 3466 [email protected] Abhishek Raj Execution pick-up supports revenue growth: TMX clocked a revenue growth of 13%/9% YoY for Q3FY15/9MFY14 on a likely pick-up in execution in the Rs 17bn CFBC boiler order from the petrochem sector. Revenue booking in the energy segment was up by 20% YoY and that in the environment segment by 4% YoY. +91 22 6766 3485 [email protected] Lower input costs aid EBITDA margins: EBITDA margins expanded 250bps YoY to 11.5% as input costs came off on lower commodity prices. Gross margins for the quarter improved 250bps YoY to 35.4%. EBITDA margins for the energy segment expanded 60bps YoY to 11.5% and that for environment segment 500bps YoY to 7.3% (off a low base). International order booking aid inflows: During Q3FY15, TMX booked a CPP order worth Rs 3.51bn for a cement plant in Africa, which supported order inflows of Rs 12.3bn (-10% YoY) during the quarter. Implied order book at Q3FY15-end stands at Rs 51bn (-11% YoY) and that for the group at Rs 62bn (-4% YoY). Losses in subsidiaries narrow down: Pro-forma losses in subsidiaries contracted sequentially to Rs 185mn in Q3 (from Rs 491mn in Q2FY15 and Rs 241mn in Q1FY15). While consolidated sales for Q3 were up 8% YoY, consolidated PAT was down 7% YoY, possibly on continued losses in Thermax (Zhejiang) Cooling & Heating Engineering and B&W JV. PRICE CLOSE (30 Jan 15) INR 1,145.20 MARKET CAP INR 136.5 bln USD 2.2 bln SHARES O/S 119.2 mln FREE FLOAT 33.9% 3M AVG DAILY VOLUME/VALUE 0.1 mln / USD 1.2 mln 52 WK HIGH 52 WK LOW INR 1,232.95 INR 615.00 Financial Highlights Y/E 31 Mar FY13A FY14A FY15E FY16E FY17E Revenue (INR mln) 54,917 50,999 54,441 60,972 65,474 EBITDA (INR mln) 4,902 4,373 4,571 6,101 7,360 1,170 Adjusted net profit (INR mln) 3,201 2,460 2,924 4,002 4,750 970 26.9 20.6 24.5 33.6 39.9 770 (20.7) (23.2) 18.8 36.9 18.7 570 DPS (INR) 7.0 6.0 6.0 6.0 6.0 ROIC (%) 12.0 7.2 7.7 11.6 14.7 Adjusted ROAE (%) 18.3 12.6 13.6 16.6 17.2 Adjusted P/E (x) 42.6 55.5 46.7 34.1 28.7 EV/EBITDA (x) 27.0 31.4 30.5 22.3 18.2 7.3 6.7 6.1 5.3 4.6 (INR) Adjusted EPS (INR) Adjusted EPS growth (%) P/BV (x) 370 Stock Price Index Price 29,400 24,400 19,400 14,400 Source: Company, Bloomberg, RCML Research This report has been prepared by Religare Capital Markets Limited or one of its affiliates. For analyst certification and other important disclosures, please refer to the Disclosure and Disclaimer section at the end of this report. Analysts employed by non-US affiliates are not registered with FINRA regulation and may not be subject to FINRA/NYSE restrictions on communications with covered companies, public appearances, and trading securities held by a research analyst account. SELL Thermax TP: INR 940.00 17.9% TMX IN Results Review INDIA CAPITAL GOODS Result highlights Fig 1 - Quarterly performance, Standalone (Rs mn) Net sales Q3FY15A Q3FY14 YoY Q2FY15A QoQ 9MFY15 9MFY14 YoY 11,466 10,138 13.1% 11,908 (3.7%) 31,767 29,199 8.8% Less: Direct Cost 7,402 6,803 8.8% 7,750 (4.5%) 20,310 18,546 9.5% Staff Cost 1,078 1,039 3.8% 1,137 (5.2%) 3,243 3,038 6.8% Other Expenses Expenditure Operating profit Other income Interest 1,672 1,387 20.5% 1,798 (7.0%) 5,101 4,956 2.9% 10,152 9,229 10.0% 10,685 (5.0%) 28,654 26,539 8.0% 1,314 909 44.6% 1,222 7.5% 3,113 2,659 17.1% 71 229 (69.1%) 232 (69.4%) 494 386 28.0% 19 23 (16.6%) 24 (21.1%) 73 50 46.6% 156 147 6.3% 182 (14.1%) 488 430 13.6% PBT 1,209 968 25.0% 1,248 (3.1%) 3,046 2,566 18.7% Tax 447 301 48.5% 388 15.3% 1,010 1,095 (7.8%) 37% 31% 18.8% 31% 19.0% 33% 43% (22.3%) 762 667 14.3% 860 (11.4%) 2,036 1,471 38.4% Depreciation Extraordinary (income)/loss Tax rate % Reported PAT Adj. PAT 762 667 14.3% 860 (11.4%) 2,036 1,761 15.6% 11.5% 9.0% 250 bps 10.3% 119 bps 9.8% 9.1% 69 bps PAT margin (%) 6.6% 6.6% 7 bps 7.2% (58 bps) 6.4% 6.0% 6.3% RM Costs as % of Sales 65% 67% (255 bps) 65% (52 bps) 63.9% 63.5% 42 bps Staff Costs as % of Sales 9% 10% (84 bps) 10% (15 bps) 10.2% 10.4% (19 bps) Other Costs as % of Sales 15% 14% 89 bps 15% (52 bps) 16.1% 17.0% (91 bps) EBITDA margin (%) Source: Company, RCML Research Fig 2 - Segmental performance, Standalone (Rs mn) Q3FY15A Q3FY14 YoY Q2FY15A QoQ 9MFY15 9MFY14 YoY Energy 9,208 7,671 20.0% 9,562 (3.7%) 25,216 21,860 15.4% Environment 2,641 2,538 4.1% 2,648 (0.3%) 7,437 7,619 (2.4%) 384 71 439.8% 301 27.6% 884 281 214.6% 11,466 10,138 13.1% 11,910 (3.7%) 31,769 29,199 8.8% Less: Inter segment rev Net revenue EBIT Energy EBIT margin (%) Environment 1,056 832 26.9% 1,182 (10.7%) 2,660 2,486 7.0% 11.5% 10.9% 62 bps 12.4% (89 bps) 10.5% 11.4% (83 bps) 193 59 229.4% 189 2.3% 480 515 (6.8%) EBIT margin (%) 7.3% 2.3% 500 bps 7.1% 18 bps 6.5% 6.8% (30 bps) Total EBIT 1,249 891 40.2% 1,371 (8.9%) 3,140 3,001 4.6% 6,067 1,780 240.9% 6,833 (11.2%) 6,067 1,780 240.9% Capital employed Energy Environment 3,439 3,403 1.0% 3,441 (0.1%) 3,439 3,403 1.0% Unallocated 12,660 14,766 (14.3%) 11,237 12.7% 12,660 14,766 (14.3%) Total 22,165 19,949 11.1% 21,511 3.0% 22,165 19,949 11.1% Source: Company, RCML Research 30 January 2015 Page 2 of 6 SELL Thermax TP: INR 940.00 17.9% TMX IN Results Review INDIA CAPITAL GOODS Fig 3 - Order book trend (Rs bn) Fig 4 - Order inflow trend Standalone (Rs bn) Subsidiaries 70 30 60 25 50 Standalone Subsidiaries 20 40 15 30 Source: Company, RCML Research Source: Company, RCML Research Fig 5 - Segmental margin, % Fig 6 - Consolidated performance Energy (Rs mn) Environment Q3FY15 Q2FY15 Q1FY15 Q4FY14 Q3FY14 Q2FY14 Q4FY13 Q3FY15 Q2FY15 Q1FY15 Q4FY14 Q3FY14 0 Q2FY14 0 Q1FY14 5 Q4FY13 10 Q1FY14 10 20 Adj. PAT margin (R) Sales 4% 5,000 2% 0 0% Source: Company, RCML Research Q3FY15A Q2FY15A Q1FY15A Q4FY14A Q3FY14 Q2FY14 Q1FY14 Q4FY13 Q3FY13 0% Q3FY15A 4% Q2FY15A 10,000 Q1FY15A 8% Q4FY14A 6% Q3FY14 15,000 Q2FY14 12% Q1FY14 8% Q4FY13 20,000 Q3FY13 16% Source: Company, RCML Research 30 January 2015 Page 3 of 6 SELL Thermax TP: INR 940.00 17.9% TMX IN Results Review INDIA CAPITAL GOODS Per Share Data Y/E 31 Mar (INR) FY13A FY14A FY15E FY16E FY17E Reported EPS 26.9 20.6 24.5 33.6 39.9 Adjusted EPS 26.9 20.6 24.5 33.6 39.9 7.0 6.0 6.0 6.0 6.0 156.8 171.1 188.6 215.2 248.0 FY13A FY14A FY15E FY16E FY17E 2.4 2.7 2.6 2.2 2.0 EV/EBITDA 27.0 31.4 30.5 22.3 18.2 Adjusted P/E 42.6 55.5 46.7 34.1 28.7 7.3 6.7 6.1 5.3 4.6 FY13A FY14A FY15E FY16E FY17E EBITDA margin 8.9 8.6 8.4 10.0 11.2 EBIT margin 7.5 6.8 6.5 8.2 9.4 Adjusted profit margin 5.8 4.8 5.4 6.6 7.3 Adjusted ROAE 18.3 12.6 13.6 16.6 17.2 ROCE 10.9 6.7 6.5 9.0 10.5 DPS BVPS Valuation Ratios Y/E 31 Mar (x) EV/Sales P/BV Financial Ratios Y/E 31 Mar Profitability & Return Ratios (%) YoY Growth (%) Revenue (9.8) (7.1) 6.8 12.0 7.4 EBITDA (17.2) (10.8) 4.5 33.5 20.6 Adjusted EPS (20.7) (23.2) 18.8 36.9 18.7 55.2 24.9 (3.1) 2.6 2.2 Invested capital Working Capital & Liquidity Ratios Receivables (days) 103 105 105 105 105 Inventory (days) 38 47 51 51 52 Payables (days) 71 75 72 71 71 Current ratio (x) 1.3 1.5 1.5 1.6 1.7 Quick ratio (x) 0.1 0.2 0.2 0.3 0.4 Gross asset turnover 4.4 3.1 2.6 2.9 3.0 Total asset turnover 1.1 0.9 0.9 0.9 0.9 25.0 12.6 12.0 17.2 21.0 0.1 0.1 0.0 (0.1) (0.2) FY13A FY14A FY15E FY16E FY17E 66.5 63.2 70.2 68.5 67.3 116.5 112.8 117.6 117.1 114.7 Turnover & Leverage Ratios (x) Net interest coverage ratio Adjusted debt/equity DuPont Analysis Y/E 31 Mar (%) Tax burden (Net income/PBT) Interest burden (PBT/EBIT) EBIT margin (EBIT/Revenue) 7.5 6.8 6.5 8.2 9.4 Asset turnover (Revenue/Avg TA) 113.7 93.3 88.2 91.2 90.5 Leverage (Avg TA/Avg equities) 276.2 279.7 288.0 278.0 262.3 18.3 12.6 13.6 16.6 17.2 Adjusted ROAE 30 January 2015 Page 4 of 6 SELL Thermax TP: INR 940.00 17.9% TMX IN Results Review INDIA CAPITAL GOODS Income Statement Y/E 31 Mar (INR mln) FY13A FY14A FY15E FY16E FY17E Total revenue 54,917 50,999 54,441 60,972 65,474 EBITDA 4,902 4,373 4,571 6,101 7,360 EBIT 4,131 3,451 3,544 4,988 6,156 Net interest income/(expenses) (165) (274) (295) (290) (294) 849 716 918 1,141 1,197 Other income/(expenses) Exceptional items 0 0 0 0 0 4,814 3,893 4,167 5,839 7,060 (1,773) (1,696) (1,785) (2,195) (2,430) 0 0 0 0 0 161 262 541 358 120 3,201 2,460 2,924 4,002 4,750 0 0 0 0 0 3,201 2,460 2,924 4,002 4,750 FY13A FY14A FY15E FY16E FY17E 9,723 9,319 10,222 11,145 11,616 12,417 15,811 17,343 18,910 19,707 Provisions 2,812 2,668 2,668 2,668 2,668 Debt funds 4,210 7,387 7,387 7,387 7,387 Other liabilities 924 2,457 2,457 2,457 2,457 Equity capital 238 238 238 238 238 Reserves & surplus 18,449 20,145 22,232 25,397 29,311 Shareholders' fund 18,687 20,383 22,470 25,636 29,549 Total liabilities and equities 49,875 59,421 64,014 69,742 75,000 3,211 4,508 7,503 10,066 13,466 15,467 14,685 15,676 17,557 18,853 3,240 4,158 4,561 4,973 5,182 11,174 17,904 18,634 20,020 20,976 EBT Income taxes Extraordinary items Min. int./Inc. from associates Reported net profit Adjustments Adjusted net profit Balance Sheet Y/E 31 Mar (INR mln) Accounts payables Other current liabilities Cash and cash eq. Accounts receivables Inventories Other current assets Investments 0 0 0 0 0 Net fixed assets 8,727 15,265 14,738 14,225 13,621 CWIP 5,175 537 537 537 537 Intangible assets 0 0 0 0 0 Deferred tax assets, net 0 0 0 0 0 Other assets 2,881 2,364 2,364 2,364 2,364 Total assets 49,875 59,421 64,014 69,742 75,000 Cash Flow Statement Y/E 31 Mar (INR mln) FY13A FY14A FY15E FY16E FY17E Net income + Depreciation 3,972 3,381 3,951 5,115 5,954 Interest expenses (683) (442) (623) (851) (903) 0 0 0 0 0 (1,566) (1,371) 311 (1,189) (1,194) Non-cash adjustments Changes in working capital Other operating cash flows 0 0 0 0 0 1,723 1,569 3,639 3,075 3,856 (3,742) (2,849) (500) (600) (600) 0 0 0 0 0 Other investing cash flows (1,122) 518 0 0 0 Cash flow from investing (4,865) (2,331) (500) (600) (600) 0 Cash flow from operations Capital expenditures Change in investments Equities issued 0 0 0 0 Debt raised/repaid 1,506 3,178 0 0 0 Interest expenses 683 442 623 851 903 (836) Dividends paid (976) (836) (836) (836) Other financing cash flows (1,842) (724) 70 73 77 Cash flow from financing (629) 2,060 (144) 88 144 (3,771) 1,297 2,995 2,563 3,400 3,211 4,508 7,503 10,066 13,466 Changes in cash and cash eq Closing cash and cash eq 30 January 2015 Page 5 of 6 RESEARCH DISCLAIMER Important Disclosures This report was prepared, approved, published and distributed by a Religare Capital Markets (“RCM”) group company located outside of the United States (a “non-US Group Company”). This report is distributed in the U.S. by Enclave Capital LLC (“Enclave Capital”), a U.S. registered broker dealer, on behalf of RCM only to major U.S. institutional investors (as defined in Rule 15a-6 under the U.S. Securities Exchange Act of 1934 (the “Exchange Act”)) pursuant to the exemption in Rule 15a-6 and any transaction effected by a U.S. customer in the securities described in this report must be effected through Enclave Capital. Neither the report nor any analyst who prepared or approved the report is subject to U.S. legal requirements or the Financial Industry Regulatory Authority, Inc. (“FINRA”) or other regulatory requirements pertaining to research reports or research analysts. No non-US Group Company is registered as a broker-dealer under the Exchange Act or is a member of the Financial Industry Regulatory Authority, Inc. or any other U.S. self-regulatory organization. Subject to any applicable laws and regulations at any given time, non-US Group Companies, their affiliates or companies or individuals connected with RCM (together, “Connected Companies”) may make investment decisions that are inconsistent with the recommendations or views expressed in this report and may have long or short positions in, may from time to time purchase or sell (as principal or agent) or have a material interest in any of the securities mentioned or related securities or may have or have had a business or financial relationship with, or may provide or have provided investment banking, capital markets and/or other services to, the entities referred to herein, their advisors and/or any other connected parties. Any particular arrangements or relationships are disclosed below. As a result, recipients of this report should be aware that Connected Companies may have a conflict of interest that could affect the objectivity of this report. See “Special Disclosures” for certain additional disclosure statements, if applicable. This report is only for distribution to investment professionals and institutional investors. Analyst Certification Each of the analysts identified in this report certifies, with respect to the companies or securities that the individual analyses, that (1) the views expressed in this report reflect his or her personal views about all of the subject companies and securities and (2) no part of his or her compensation was, is or will be directly or indirectly dependent on the specific recommendations or views expressed in this report. Analysts and strategists are paid in part by reference to the profitability of RCM. Stock Ratings are defined as follows Recommendation Interpretation (Recommendation structure changed with effect from March 1, 2009) Recommendation Buy Hold Sell Expected absolute returns (%) over 12 months More than 15% Between 15% and –5% Less than –5% Expected absolute returns are based on the share price at market close unless otherwise stated. Stock recommendations are based on absolute upside (downside) and have a 12-month horizon. Our target price represents the fair value of the stock based upon the analyst’s discretion. We note that future price fluctuations could lead to a temporary mismatch between upside/downside for a stock and our recommendation. Stock Ratings Distribution As of 1 January 2015, out of 194 rated stocks in the RCM coverage universe, 109 have BUY ratings (including 7 that have been investment banking clients in the last 12 months), 59 are rated HOLD and 26 are rated SELL. Research Conflict Management Policy RCM research has been published in accordance with our conflict management policy, which is available here. Disclaimers This report is not directed to, or intended for distribution to or use by, any person or entity who is a citizen or resident of or located in any locality, state, country or other jurisdiction where such distribution, publication, availability or use would be contrary to law or regulation or which would subject RCM to any registration or licensing requirement within such jurisdiction(s). This report is strictly confidential and is being furnished to you solely for your information. All material presented in this report, unless specifically indicated otherwise, is under copyright to RCM. None of the material, its content, or any copy of such material or content, may be altered in any way, transmitted, copied or reproduced (in whole or in part) or redistributed in any form to any other party, without the prior express written permission of RCM. All trademarks, service marks and logos used in this report are trademarks or service marks or registered trademarks or service marks of RCM or its affiliates, unless specifically mentioned otherwise. not treat recipients as its customers by virtue of their receiving the report. The investments or services contained or referred to in this report may not be suitable for you and it is recommended that you consult an independent investment advisor if you are in doubt about such investments or investment services. In addition, nothing in this report constitutes investment, legal, accounting or tax advice or a representation that any investment or strategy is suitable or appropriate to your individual circumstances or otherwise constitutes a personal recommendation to you. Information and opinions presented in this report were obtained or derived from sources that RCM believes to be reliable, but RCM makes no representations or warranty, express or implied, as to their accuracy or completeness or correctness. RCM accepts no liability for loss arising from the use of the material presented in this report, except that this exclusion of liability does not apply to the extent that liability arises under specific statutes or regulations applicable to RCM. This report is not to be relied upon in substitution for the exercise of independent judgment. RCM may have issued, and may in the future issue, a trading call regarding this security. Trading calls are short term trading opportunities based on market events and catalysts, while stock ratings reflect investment recommendations based on expected absolute return over a 12-month period as defined in the disclosure section. Because trading calls and stock ratings reflect different assumptions and analytical methods, trading calls may differ directionally from the stock rating. Past performance should not be taken as an indication or guarantee of future performance, and no representation or warranty, express or implied, is made regarding future performance. Information, opinions and estimates contained in this report reflect a judgment of its original date of publication by RCM and are subject to change without notice. The price, value of and income from any of the securities or financial instruments mentioned in this report can fall as well as rise. The value of securities and financial instruments is subject to exchange rate fluctuation that may have a positive or adverse effect on the price or income of such securities or financial instruments. Investors in securities such as ADR’s, the values of which are influenced by currency volatility, effectively assume this risk. This report is distributed in India by Religare Capital Markets Limited, which is a registered intermediary regulated by the Securities and Exchange Board of India. In Dubai, it is being distributed by Religare Capital Markets (Hong Kong) Limited (Dubai Branch) which is licensed and regulated by the Dubai Financial Services Authority. In Singapore, it is being distributed (i) by Religare Capital Markets (Singapore) Pte. Limited (“RCMS”) (Co. Reg. No. 200902065N) which is a holder of a capital markets services licence and an exempt financial adviser in Singapore and (ii) solely to persons who qualify as ““institutional investors” or “accredited investors” as defined in section 4A(1) of the Securities and Futures Act, Chapter 289 of Singapore (the “SFA”). Pursuant to regulations 33, 34, 35 and 36 of the Financial Advisers Regulations (the “FAR”), sections 25, 27 and 36 of the Financial Advisers Act, Chapter 110 of Singapore shall not apply to RCMS when providing any financial advisory service to an accredited investor, or “overseas investor” (as defined in regulation 36 of the FAR). Persons in Singapore should contact RCMS in respect of any matters arising from, or in connection with this publication/communication. In Hong Kong, it is being distributed by Religare Capital Markets (Hong Kong) Limited (“RCM HK”), which is licensed and regulated by the Securities and Futures Commission, Hong Kong. In Australia, it is being distributed by RCMHK which is approved under ASIC Class Orders. In Sri Lanka, it is being distributed by Bartleet Mallory Stockbrokers, which is licensed under Securities and Exchange Commission of Sri Lanka. If you wish to enter into a transaction please contact the RCM entity in your home jurisdiction unless governing law provides otherwise. In jurisdictions where RCM is not registered or licensed to trade in securities, transactions will only be effected in accordance with applicable securities legislation which may vary from one jurisdiction to another and may require that the trade be made in accordance with applicable exemptions from registration or licensing requirements. Religare Capital Markets does and seeks to do business with companies covered in our research report. As a result, investors should be aware that the firm may have a conflict of interest that could affect the objectivity of research produced by Religare Capital Markets. Investors should consider our research as only a single factor in making their investment decision. Any reference to a third party research material or any other report contained in this report represents the respective research organization's estimates and views and does not represent the views of RCM and RCM, its officers, employees do not accept any liability or responsibility whatsoever with respect to its accuracy or correctness and RCM has included such reports or made reference to such reports in good faith. This report may provide the addresses of, or contain hyperlinks to websites. Except to the extent to which the report refers to material on RCM’s own website, RCM takes no responsibility whatsoever for the contents therein. Such addresses or hyperlinks (including addresses or hyperlinks to RCM’s own website material) is provided solely for your convenience and information and the content of the linked site does not in any way form part of this report. Accessing such website or following such link through this report or RCM’s website shall be at your own risk. Special Disclosures (if applicable) Not Applicable The information, tools and material presented in this report are provided to you for information purposes only and are not to be used or considered as an offer or the solicitation of an offer to sell or to buy or subscribe for securities or other financial instruments. RCM has not taken any steps to ensure that the securities referred to in this report are suitable for any particular investor. RCM will 30 January 2015 Page 6 of 6

© Copyright 2026