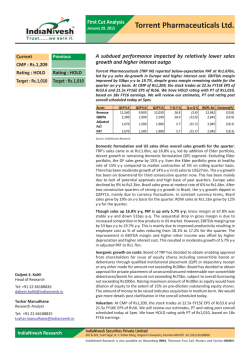
Torrent Pharmaceuticals (TORPHA) | 1100
Result Update
February 2, 2015
Rating matrix
Rating
Target
Target Period
Potential Upside
:
:
:
:
Torrent Pharmaceuticals (TORPHA)
Hold
| 1165
12 months
6%
Muted quarter but outlook unchanged…
What’s Changed?
Target
EPS FY15E
EPS FY16E
EPS FY17E
Rating
Changed from | 1036 to | 1165
Changed from | 47.8 to | 47.2
Changed from | 49.9 to | 50.4
Changed from | 63.1 to | 64.7
Unchanged
Quarterly Performance
Revenue
EBITDA
EBITDA (%)
Net Profit
Q3FY15
1,168.0
240.0
20.5
167.0
Q3FY14
1,015.0
215.0
21.2
158.0
YoY (%)
15.1
11.6
-63 bps
5.7
Q2FY15 QoQ (%)
1,217.0
-4.0
273.0
-12.1
22.4 -188 bps
198.0
-15.7
FY14
4184.0
952.0
663.9
39.2
FY15E
4710.7
1136.7
798.7
47.2
FY16E
5573.0
1393.1
852.2
50.4
FY17E
6502.5
1666.1
1095.8
64.7
FY14
28.0
29.7
13.4
6.6
34.9
28.5
FY15E
23.3
24.7
12.3
5.1
32.4
21.4
FY16E
21.8
23.1
9.8
4.1
28.0
26.7
FY17E
17.0
18.0
7.8
3.3
28.6
30.5
Key Financials
(|crore)
Revenues
EBITDA
Net Profit
EPS (|)
Valuation summary
PE (x)
Target PE (x)
EV to EBITDA (x)
Price to book (x)
RoNW (%)
RoCE (%)
Stock data
Particular
Market Capitalisation
Debt (FY14)
Cash (FY14)
EV
52 week H/L
Equity capital
Face value
Amount
| 18614 crore
| 1132 crore
| 769 crore
| 18977 crore
785/385
| 84.6 crore
|5
Price performance (%)
Torrent Pharma
Aurobindo Pharma
Biocon
Ipca Labs
1M
3.1
10.2
-1.5
-13.9
3M
31.3
27.5
-7.8
-13.0
| 1100
6M
57.9
80.2
-12.0
-9.2
1Y
116.7
178.4
-4.2
-21.7
Research Analyst
Siddhant Khandekar
[email protected]
Mitesh Shah
[email protected]
Nandan Kamat
[email protected]
ICICI Securities Ltd | Retail Equity Research
• Revenues grew 15% YoY to | 1168 crore, below I-direct estimate of
| 1217 crore on account of lower-than expected export sales
• EBITDA margins declined 63 bps to 20.6% against I-direct estimate of
24% and the delta was on account of forex losses in Europe and
Brazil. EBITDA in absolute terms grew 11.6% to | 240 crore against Idirect estimate of | 292.1 crore
• Net profit witnessed a YoY increase of 5.7% to | 167 crore, below Idirect estimate of | 188.4 crore mainly on account of a lower-thanexpected operational performance
Chronic focus, diversified portfolio, nimble-footed approach
Torrent has remained ahead of the curve when it comes strategic
decision making. In domestic formulations, it concentrated on high
yielding chronic therapies like cardiovascular and neuropathy when most
Indian players were growing in anti-infectives (acute). It was one of the
early entrants in the Brazilian markets. It acquired a marketing company in
Germany in 2005. It also struck a CRAMS deal with Novo-Nordisk in the
Indian market for Insulin. Just when it was witnessing a slowdown in
domestic formulations, it acquired Elder’s lucrative formulations business.
US launches such as gCymbalta and gMicardis have strengthened the US
business and overall financial health. Strong margins and high return
ratios are some of the major differentiators for Torrent.
Exports business remains in sweet spot
The exports business (~55% of the total turnover) is witnessing strong
traction especially from the US. Brazil has started showing signs of a
recovery with a recalibrated approach. Other export markets such as
Europe and RoW are growing at a steady pace. In the US, the company
owns a healthy product pipeline (72 filed ANDAs, 53 approvals and 39
launches). We expect US sales to grow at a CAGR of 12.8% in FY14-17E
to | 1113 crore on a higher base. Similarly, RoW and European sales are
likely to grow at a CAGR of 10% and 7.1% to | 505.3 crore and | 1141.8
crore, respectively, during FY14-17E.
Indian formulations growth steady
Despite having higher proportion of chronic therapies, the company
remained an underachiever in the branded formulations space, growing
at a CAGR of 13% in FY09-14. The acquisition of Elder Pharma’s branded
portfolio is likely to add new therapies such as neutraceuticals and
gynaecology and fill up the portfolio gaps. Elder’s portfolio is also margin
accretive. We expect Indian branded formulations to grow at a CAGR of
28% in FY14-17E to | 2455.1 crore.
US, Brazil, India key catalysts for future; maintain HOLD
The US, Brazil and domestic formulations remain the troika for future
growth based on new product launches and improvement in market
share. The US remains in good shape despite the exclusivity sunset of
gCymbalta as the pipeline remains promising. The management also
remains optimistic on Elder’s portfolio, which is likely to improve the
margins scenario considerably. Brazilian growth is crawling back to
normal with a recalibrated approach. Other segments such as RoW and
Europe, however, remain draggers in an otherwise high growth engine.
We have increased multiple to 18x from 16x on the back of improved
visibility. Accordingly, our new target price stands at | 1165 based on 18x
FY17E EPS of | 64.7.
Variance analysis
Q3FY15 Q3FY15E
1,168.0 1,217.0
Revenue
Q3FY14
1,015.0
Q2FY15
1,217.0
YoY (%)
15.1
QoQ (%)
-4.0
Raw Material Expenses
Employee Expenses
Other Expenditure
EBITDA
EBITDA (%)
Interest
372.0
199.0
357.0
240.0
20.5
50.0
365.1
213.0
346.9
292.1
24.0
54.0
318.0
179.0
303.0
215.0
21.2
16.0
381.0
224.0
339.0
273.0
22.4
54.0
Depreciation
Other Income
PBT before EO & Forex
EO
PBT
Tax
PAT before MI
MI
Net Profit
54.0
65.0
201.0
0.0
201.0
34.0
167.0
0.0
167.0
55.0
59.7
242.7
0.0
242.7
53.4
189.3
0.9
188.4
21.0
10.0
188.0
0.0
188.0
30.0
158.0
0.0
158.0
56.0
72.0
235.0
0.0
235.0
37.0
198.0
0.0
198.0
157.1
550.0
6.9
0.0
6.9
13.3
5.7
0.0
5.7
-3.6
-9.7
-14.5
0.0
-14.5
-8.1
-15.7
0.0
-15.7
Key Metrics
India
421.0
445.0
300.0
444.0
40.3
-5.2
80.0
155.8
171.7
106.4
225.7
77.0
161.7
170.2
90.3
260.4
70.0
147.0
148.0
95.0
248.0
96.0
160.0
167.0
97.0
247.0
14.3
6.0
16.0
12.0
-9.0
-16.7
-2.6
2.8
9.7
-8.6
Contract manufacturing
Brazil
USA
ROW
Europe (incl Germany)
17.0
-2.4
11.2
-11.2
17.8
5.3
11.6
-12.1
-63 bps -188 bps
212.5
-7.4
Comments
The revenue growth was mainly driven by Domestic formulation sales growth (42%)
and US growth (16%).
Dent in margin was mainly on the back of forex losses.
YoY spurt in interest on the back of assuming of debt of | 1400 crore for Elder
Pharma acquisition.
Higher other income was largely due to forex gains
Muted growth on the back of lower operational performance which was partially
offset by lower tax outgo.
Growth was on the back of acquisition of Elder's porfolio. Excluding this the base
business growth was 15%.
Costant currency YoY growrth was 19%.
In constant currency the growth was flat
Source: Company, ICICIdirect.com Research
Change in estimates
(| Crore)
Revenue
EBITDA
EBITDA Margin (%)
PAT
EPS (|)
Old
4,846.4
1,221.7
25.2
FY15E
New % Change
4,710.7
-2.8
1,136.7
-7.0
24.1 -108 bps
808.7
47.8
798.7
47.2
-1.2
-1.3
Old
5,675.0
1,390.4
24.5
845.1
49.9
FY16E
New % Change
5,573.0
-1.8
1,393.1
0.2
25.0
50 bps
852.2
50.4
Comments
Currency fluctuation impacted the company's FY15 operational performance
Margin would be impacted in FY15 mainly due to adverse currency movement
0.8
0.8
Source: Company, ICICIdirect.com Research
Assumptions
(| crore)
India Formulations
Contract manufacturing
Brazil
USA
RoW
Europe (incl Germany)
FY13
1,034.5
230.5
512.8
FY14
1,176.0
279.0
533.0
355.3
295.3
650.9
776.0
380.0
930.0
Current
FY15E
FY16E
1,643.5 2,054.4
276.8
349.9
624.8
718.5
787.7
397.6
943.6
890.5
459.4
1,038.0
Earlier
FY15E
FY16E
1,641.7 2,052.2
273.8
346.7
611.5
672.7
871.4
390.9
1,015.9
995.1
430.0
1,117.5
Comments
We have increased brazil sales on the back of likely improvement in product launches
and expects strong growth from Institutional and generic generic business
We have altered US sales on account of likely delays in product approvals.
Adverse currency movement is likely to impact the company's FY15 growth
Source: Company, ICICIdirect.com Research
ICICI Securities Ltd | Retail Equity Research
Page 2
Company Analysis
Incorporated in 1959, the company is a mid-size generic player with a
strong presence in the domestic and semi-regulated markets and a
growing presence in regulated markets. It is also present in the Indian
CRAMS space via supply agreement with Danish pharma major Novo
Nordisk for the latter’s insulin business in India. Chronic therapies such as
cardiovascular, neurology and diabetology are the main focus areas for
the company along with acute therapies such as anti-infectives and
gastrointestinal. The company has a significant presence in the exports
market in countries such Brazil, Germany and lately in the US among
others. Chronic focus, financial discipline, successful M&A/deal making
track record, higher return rations and higher dividend payouts are some
of the USPs of Torrent Pharma. We expect sales to grow at a CAGR of
15.8% in FY14-17E to | 6502.5 crore driven by India and the US.
Exhibit 1: Revenues to grow at CAGR of 15.8% in FY14-17E
7,000
6,503
5,573
6,000
(| crore)
5,000
4,184
4,000
3,000
2,000
1,631
1,916
2,226
4,711
3,211
2,696
1,000
0
FY09
FY10
FY11
FY12
FY13
Revenues
FY14
FY15E
FY16E
FY17E
Source: Company, ICICIdirect.com Research
Indian Branded Formulations (34% of overall sales) - Indian branded
formulations have grown at a CAGR of 13.4% in FY09-14. The chronic:
acute ratio is 50:50 post the Elder acquisition. As per AIOCD (MAT
December 2014), the company is ranked 15th in the IPM with a market
share of 2.24%. It ranks fourth in both cardiovascular and neurology
therapies in the IPM as per AIOCD. We expect domestic branded
formulations to grow at a CAGR of 28% in FY14-17E to | 2455 crore.
Exhibit 2: Indian branded formulations growth trend
3,000
2,455
2,500
2,054
(| crore)
2,000
1,644
1,500
1,000
628
729
842
917
FY11
FY12
1,034
1,176
500
0
FY09
FY10
FY13
FY14
FY15E
FY16E
FY17E
India
Source: Company, ICICIdirect.com Research
US (18% of overall sales) - Torrent was a relatively late entrant in the US.
However, during this short period the company has achieved significant
ICICI Securities Ltd | Retail Equity Research
Page 3
critical mass, thanks to some niche launches like gCymbalta.
Cumulatively, the company has filed 72 ANDAs and received approvals
for 53 products. So far, it has launched 39 products in the US.
Exhibit 3: US growth piggybacking on product launches
1,200
1,113
1,000
890
(| crore)
800
776
788
FY14
FY15E
600
355
400
218
200
28
91
109
FY10
FY11
0
FY09
FY12
FY13
FY16E
FY17E
USA
Source: Company, ICICIdirect.com Research
ROW markets - (8% of overall sales) - These markets mainly cover the
Middle East, Africa and South East Asian regions. The RoW markets have
grown at a CAGR of 35% in FY10-14. Going ahead, we expect this
segment to grow at 10% CAGR driven by new product registration.
Exhibit 4: RoW markets to maintain steady growth rate
600
505
459
500
(| crore)
400
398
FY14
FY15E
295
300
200
100
380
89
114
128
FY10
FY11
152
0
FY09
FY12
FY13
FY16E
FY17E
RoW markets
Source: Company, ICICIdirect.com Research
Europe (21% of overall sales) - European sales are driven by partnership
deals (excluding Germany). In Germany, the company operates through
marketing company Heumann Pharma. The German business is tender
based. Europe has grown at a CAGR of 26% in FY10-14. Going ahead, we
expect European sales to grow at a CAGR of 7.1% in FY14-17E driven by
new tenders and dossier income.
ICICI Securities Ltd | Retail Equity Research
Page 4
Exhibit 5: Heumann sales, dossier income to drive European growth
1,200
1,000
(| crore)
800
930
944
FY14
FY15E
651
518
600
400
1,142
1,038
358
371
FY09
FY10
423
200
0
FY11
FY12
FY13
FY16E
FY17E
Europe (inc. Germany)
Source: Company, ICICIdirect.com Research
Exhibit 6: EBITDA to grow at CAGR of 20.5% in FY14-17E
1,800
1,666
24.1
1,400
(| crore)
1,200
22.0
21.6
1,000
600
400
15.9 421
22.8 1,137
25.6 26
24
22
952
20
18.6 692
18.4
800
1,39325.0
18
501
409
(%)
1,600
28
16
14
259
200
12
0
10
FY09
FY10
FY11
FY12
EBITDA
FY13
FY14
FY15E
FY16E
FY17E
EBITDA Margins (%)
Source: Company, ICICIdirect.com Research
Exhibit 7: Net profit to grow at CAGR of 18.2% in FY14-17E
1,000
15.9 799
(| crore)
800
664
600
184
231 12.1
16
15.3
15
14
13
270 12.1 284
12
11.3
11
10.5
0
FY09
FY10
FY11
FY12
Net Profit
10
FY13
FY14
FY15E
FY16E
FY17E
Net Profit Margins (%)
Source: Company, ICICIdirect.com Research
ICICI Securities Ltd | Retail Equity Research
18
16.9 17
852
433 13.5
400
200
1,096
17.0
Page 5
(%)
1,200
Exhibit 8: Acquisition of Elder brands to bring down return ratios
40
35
34.9
32.4
(%)
30
28.3
25
20
30.4
28.8
27.8
26.2
28.5
26.4
26.7
23.8
21.7
19.1
30.5
28.6
28.0
21.4
23.6
15
FY09
FY10
FY11
FY12
FY13
RoNW (%)
FY14
FY15E
FY16E
FY17E
ROCE (%)
Source: Company, ICICIdirect.com Research
Exhibit 9: Trends in quarterly financials
| Crore
Net sales
OOI
Revenues
Total RM cost
RM cost % Revenues
Gross Profit
GPM (%)
Employee cost
% sales
Other expenditure
% of sales
Total Expenditure
% of Revenues
EBITDA
EBITDA Margins (%)
Depreciation
Interest cost
Other Income
PBT before forex & EO
Forex & EO
PBT
Tax
Tax rate (%)
PAT
PAT (%)
MI
PAT after MI
EPS (|)
Q3FY12
675.5
21.1
696.6
222.3
31.9
474.3
68.1
119.9
17.2
232.9
33.4
575.1
82.6
121.5
17.4
19.7
0.2
2.3
104.0
0.0
104.0
20.1
19.3
83.9
12.0
0.7
83.2
4.9
Q4FY12
654.0
20.3
674.3
222.8
33.0
451.5
67.0
144.2
21.4
222.2
33.0
589.3
87.4
85.0
12.6
21.8
8.9
-52.9
1.4
0.0
1.4
2.4
169.3
-1.0
-0.1
0.7
-1.7
-0.1
Q1FY13
735.6
31.3
766.9
220.0
28.7
547.0
71.3
153.1
20.0
237.9
31.0
611.0
79.7
156.0
20.3
20.1
9.4
14.0
140.4
0.0
140.4
37.4
26.6
103.0
13.4
1.2
101.9
6.0
Q2FY13
747.0
30.0
777.0
217.0
27.9
560.0
72.1
155.0
19.9
251.0
32.3
623.0
80.2
154.0
19.8
20.0
7.0
12.0
139.0
0.0
139.0
31.0
22.3
108.0
13.9
1.0
107.0
6.3
Q3FY13
768.0
29.0
797.0
246.0
30.9
551.0
69.1
152.0
19.1
237.0
29.7
635.0
79.7
162.0
20.3
21.0
7.0
9.0
143.0
0.0
143.0
31.0
21.7
112.0
14.1
0.0
112.0
6.6
Q4FY13
803.0
68.0
871.0
243.0
27.9
628.0
72.1
164.0
18.8
244.0
28.0
651.0
74.7
220.0
25.3
22.0
10.0
8.0
196.0
-37.0
159.0
48.0
30.2
111.0
12.7
0.0
111.0
6.6
Q1FY14
903.0
69.0
972.0
304.0
31.3
668.0
68.7
172.0
17.7
288.0
29.6
764.0
78.6
208.0
21.4
21.0
8.0
8.0
187.0
0.0
187.0
38.0
20.3
149.0
15.3
0.0
149.0
8.8
Q2FY14
936.0
36.0
972.0
301.0
31.0
671.0
69.0
182.0
18.7
310.0
31.9
793.0
81.6
179.0
18.4
22.0
15.0
10.0
152.0
0.0
152.0
39.0
25.7
113.0
11.6
0.0
113.0
6.7
Q3FY14
990.0
25.0
1015.0
318.0
31.3
697.0
68.7
179.0
17.6
303.0
29.9
800.0
78.8
215.0
21.2
21.0
16.0
10.0
188.0
0.0
188.0
30.0
16.0
158.0
15.6
0.0
158.0
9.3
Q4FY14
1207.0
18.0
1225.0
320.0
26.1
905.0
73.9
208.0
17.0
347.0
28.3
875.0
71.4
350.0
28.6
23.0
20.0
10.0
317.0
0.0
317.0
73.0
23.0
244.0
19.9
0.0
244.0
14.4
Q1FY15
1092.0
22.0
1114.0
301.0
27.0
813.0
73.0
184.0
16.5
284.0
25.5
769.0
69.0
345.0
31.0
21.0
24.0
49.0
349.0
0.0
349.0
93.0
26.6
256.0
23.0
0.0
256.0
15.1
Q2FY15
1203.0
14.0
1217.0
381.0
31.3
836.0
68.7
224.0
18.4
339.0
27.9
944.0
77.6
273.0
22.4
56.0
54.0
72.0
235.0
0.0
235.0
37.0
15.7
198.0
16.3
0.0
198.0
11.7
Q3FY15
1156.0
12.0
1168.0
372.0
31.8
796.0
68.2
199.0
17.0
357.0
30.6
928.0
79.5
240.0
20.5
54.0
50.0
65.0
201.0
0.0
201.0
34.0
16.9
167.0
14.3
0.0
167.0
9.9
YoY (%) QoQ (%)
16.8
-3.9
-52.0
-14.3
15.1
-4.0
17.0
-2.4
14.2
-52 bps
11.2
-4.8
-54 bps
-11.2
17.8
5.3
16.0
-1.7
11.6
-12.1
-63 bps -188 bps
157.1
-3.6
212.5
-7.4
550.0
-9.7
6.9
-14.5
6.9
13.3
-14.5
-8.1
5.7
-15.7
5.7
-15.7
Source: Company, ICICIdirect.com Research
SWOT Analysis
Strengths - Chronic focus, high operating margins, high return ratios,
strong emerging US pipeline and one of the highest dividend payout
ratios.
Weakness - Brazilian market remains dicey due to frequent changes in
regulations and pricing. Relatively late US entrant.
Opportunities - The US Generics space.
Threats - Increased USFDA scrutiny across the globe regarding cGMP
issues and consolidation in the US pharmacy space.
ICICI Securities Ltd | Retail Equity Research
Page 6
Conference call highlights
•
•
•
•
•
•
•
•
•
•
•
ICICI Securities Ltd | Retail Equity Research
The company received board approval to raise | 10000 crore for
future acquisition.
MR productivity – Torrent has | 4.3 lakh per person productivity
while Elder has | 3 lakh. The company’s endeavour is to improve
its combined per MR productivity to more than | 5 lakh by April
2015
The company has reduced domestic divisions to 15 from16 (14
divisions of Torrent and two divisions of Elder) to achieve synergy
benefit
In YTDFY15, the company has won highest tenders in Germany
among all companies. Currently, the company is selling 130
molecules in this market.
In Brazil, the company has 13 products in the pipeline for branded
segment and eight products for Generic Generic segment
In Q3FY15, the company filled one ANDA and got approval for
three ANDAs. Till date, the company owns 53 ANDA approvals
(including nine tentative approvals) and is awaiting approvals for
19 products. It expects to launch ~10 products in FY16
Capex of | 200-250 crore expected annually for next two to three
years
It expects its Dahej SEZ facility to be operational in FY16, which
would mainly cater to developed market formulation sales
The company enjoys 10% and 12% market shares in Telmisartan
HCT and Telmisartan in the US, which it expects to improve to1520% for both the products.
The company expects to get gNexium and gDetrol XR approvals
by middle of 2015.
For gAbilify, the company expects to get the approval after April
20, 2015 post exclusivity expiry. The company is facing litigation.
Hence, it may launch this product at risk
Page 7
Valuation
The Brazilian market demonstrated meaningful traction, thanks to the
recalibrated approach of adding institutional and generic generics in the
branded portfolio. The management also sounded quite bullish on Elder’s
portfolio, which is likely to improve the margins scenario considerably.
The US remains in good shape despite the exclusivity sunset of
gCymbalta as the pipeline remains healthy. Other segments such as RoW
and Europe are the only draggers in an otherwise high growth engine. We
have increased our multiple to 18x from 16x on the back of strong future
outlook and improvement in margin on synergy benefit. Accordingly, we
have enhanced our target price to | 1165 on 18x FY17E EPS of | 64.7.
However, we maintain HOLD on the stock owing to sharp run up recently.
Exhibit 10: One year forward PE
800
|
600
400
200
Price
15.5x
8.0x
13.6x
11.7x
Sep-14
Mar-14
Sep-13
Mar-13
Sep-12
Mar-12
Sep-11
Mar-11
Sep-10
Mar-10
Sep-09
Mar-09
Sep-08
Mar-08
Sep-07
Mar-07
Sep-06
Mar-06
0
9.9x
[
Source: Company, ICICIdirect.com Research
Exhibit 11: One year forward PE of company vs. BSE Healthcare Index
35
30
25
(x)
20
15
10
5
0
Mar-06 Dec-06 Sep-07 Jun-08 Mar-09 Dec-09 Sep-10 Jun-11 Mar-12 Dec-12 Sep-13 Jun-14
Torrent Pharma
Healthcare Index
Source: Company, ICICIdirect.com Research
Exhibit 12: Valuation
FY14
FY15E
FY16E
FY17E
Revenues
(| crore)
4184
4711
5573
6503
Growth
(%)
30
13
18
17
Adj. EPS
(|)
39.2
47.2
50.4
64.7
Growth
(%)
53
20
7
29
P/E EV/EBITDA
(x)
(X)
19.0
13.4
15.8
12.3
14.8
9.8
11.5
7.8
RoNW
(%)
34.9
32.4
28.0
28.6
Source: Company, ICICIdirect.com Research
ICICI Securities Ltd | Retail Equity Research
Page 8
RoCE
(%)
28.5
21.4
26.7
30.5
Company snapshot
1,400
Target Price:| 1165
1,200
1,000
800
600
400
200
Jan-16
Oct-15
Jul-15
Apr-15
Jan-15
Oct-14
Jul-14
Apr-14
Jan-14
Oct-13
Jul-13
Apr-13
Jan-13
Oct-12
Jul-12
Apr-12
Jan-12
Oct-11
Jul-11
Apr-11
Jan-11
Oct-10
Jul-10
Apr-10
Jan-10
Oct-09
Jul-09
Apr-09
Jan-09
0
Source: Bloomberg, Company, ICICIdirect.com Research
Key events
Date
Nov-09
Event
Starts new facility to manufacture human insulin for its partner Novo Nordisk
Mar-10
Signs agreement with AstraZeneca to supply 18 finished dosage formulations for emerging markets
Aug-10
Torrent Pharma enters gynaecology segment in Indian market
Apr-11
Enters oncology segment in the domestic market
May-13
Announces bonus shares in the ratio of 1:1
Dec-13
Launches generic Cymbalta (Duloxerine) with 180 days exclusivity in the US market
Dec-13
Announces acquisition of 30 brands of Elder Pharma for | 2000 crore. The brands include big brands of Shelcal and Chymoral.
Source: Company, ICICIdirect.com Research
Top 10 Shareholders
Shareholding Pattern
Rank
1
2
3
4
5
6
7
8
9
10
(in %)
Promoter
FII
DII
Others
Name
Latest Filing Date % O/S Position (m) Position Chan
Torrent Group
31-Dec-14 50.89
86.1
0.0
Mehta (Samir Uttamlal)
31-Dec-14 4.88
8.3
0.0
Mehta (Anita S)
31-Dec-14 3.75
6.3
0.0
Mehta (Sudhir Uttamlal)
31-Dec-14 3.48
5.9
0.0
Mehta (Sapna S)
31-Dec-14 3.17
5.4
0.0
Lavender Investments, Ltd.
31-Dec-14 2.68
4.5
0.0
Franklin Templeton Asset Management (India) Pvt. Ltd.
31-Dec-14 2.31
3.9
0.5
Franklin Advisers, Inc.
30-Nov-14 2.28
3.9
0.6
Mehta (Samir Uttamlal) HUF
31-Dec-14 1.23
2.1
0.0
HDFC Asset Management Co., Ltd.
31-Dec-14 1.19
2.0
0.0
Dec-13 Mar-14 Jun-14 Sep-14 Dec-14
71.5
71.5
71.5
71.5
71.5
10.5
12.0
12.6
12.8
12.9
8.1
7.6
7.0
6.5
6.6
9.8
8.9
8.8
9.1
9.1
Source: Reuters, ICICIdirect.com Research
Recent Activity
Buys
Investor name
Franklin Advisers, Inc.
Franklin Templeton Asset Management (India) Pvt. Ltd.
Axis Asset Management Company Limited
Norges Bank Investment Management (NBIM)
J.P. Morgan Asset Management (Hong Kong) Ltd.
Value
9.15m
9.01m
2.87m
1.22m
0.70m
Shares
0.55m
0.51m
0.16m
0.09m
0.07m
Sells
Investor name
Canara Robeco Asset Management Company Ltd.
Religare Invesco Asset Management Company Private Limited
ICICI Prudential Asset Management Co. Ltd.
Adamant Biomedical Investments AG
Reliance Capital Asset Management Ltd.
Value
-2.58m
-2.42m
-1.37m
-1.33m
-0.82m
Shares
-0.30m
-0.18m
-0.14m
-0.12m
-0.07m
Source: Reuters, ICICIdirect.com Research
ICICI Securities Ltd | Retail Equity Research
Page 9
Financial summary
Profit and loss statement
(Year-end March)
Revenues
Growth (%)
Raw Material Expenses
Employee Expenses
Other expenses
Total Operating Expenditure
EBITDA
Growth (%)
Depreciation
Interest
Other Income
PBT
EO
Taxation
PAT
MI
Net Profit
Growth (%)
EPS (|)
| Crore
FY14
4,184.0
30.3
1243
741
1248.0
3232
952.0
37.5
87
59
38
844
0
180
664
0
663.9
53.4
39.2
FY15E
4,710.7
12.6
1436
819
1319.3
3574
1,136.7
19.4
185
178
239
1,014
0
214
800
1
798.7
20.3
47.2
FY16E
5,573.0
18.3
1742
934
1504.7
4180
1,393.1
22.6
194
145
44
1,098
0
242
856
4
852.2
6.7
50.4
FY17E
6,502.5
16.7
2024
1057
1755.7
4836
1,666.1
19.6
215
90
51
1,412
0
311
1,101
6
1,095.8
28.6
64.7
Source: Company, ICICIdirect.com Research
| Crore
FY14
84.6
1,817.8
1,902.4
1131.8
47.5
0.4
200.5
3,282.5
1,420.0
544.7
875.3
534.1
1,409.5
185.7
65.6
129.5
60.7
769.4
1,099.4
85.0
1,006.1
259.0
3,218.9
1,429.1
358.2
1,787.3
1,431.6
3,282.5
(Year-end March)
Profit after Tax
Depreciation
(Inc)/Dec in Current Assets
(Inc)/Dec in Current Liabilities
CF from operation
Purchase of Fixed Assets
(Inc)/Dec in Investments
(Inc)/Dec in Minority interest
Others
Long Term Provision
CFfrom Investing Activities
Inc / (Dec) in Loan Funds
Inc / (Dec) in Equity Capital
Dividend and dividend tax
Others
CF from Financing Activities
Cash generation during the year
Op bal Cash & Cash equivalents
Closing Cash/ Cash Equivalent
| Crore
FY14
663.9
87.0
-577.0
316.1
490.1
-391.4
-125.2
0.0
-147.4
60.9
-603.0
438.8
0.0
-198.0
14.6
255.4
142.5
627.0
769.4
FY15E
798.7
184.7
-234.9
541.8
1,290.2
-2354.0
185.6
0.9
48.9
20.0
-2,118.6
850.0
0.0
-237.6
0.0
612.4
-216.0
769.4
553.4
FY16E
852.2
193.6
-402.4
353.4
996.8
-350.0
0.0
4.3
-2.0
20
-347.7
-530.0
0.0
-277.2
0.0
-807.2
-158.1
553.4
395.3
FY17E
1095.8
215.0
-514.8
447.4
1,243.4
-350.0
0.0
5.5
-3.8
20
-348.3
-550.0
0.0
-297.0
0.0
-847.0
48.1
395.3
443.4
Source: Company, ICICIdirect.com Research
Balance sheet
(Year-end March)
Equity Capital
Reserve and Surplus
Total Shareholders funds
Total Debt
Deferred Tax Liability
Minority Interest
Other LT Liabitlies & LT Provision
Total Liabilities
Gross Block
Less: Acc Depreciation
Net Block
Capital WIP
Total Fixed Assets
Investments
Deferred tax assets
Long term loans & advaces
Othe non current liabilties
Cash
Trade Receivables
Loans & Advances
Inventory
Other current assets
Total Current Assets
Creditors
Provisions & other current liability
Total Current Liabilities
Net Current Assets
Application of Funds
Cash flow statement
FY15E
84.6
2,378.9
2,463.5
1981.8
47.5
1.3
225.5
4,719.5
4,208.2
729.4
3,478.8
100.0
3,578.8
0.0
65.6
95.6
70.7
553.4
1,143.8
114.1
1,143.8
282.5
3,237.7
1,588.7
740.4
2,329.0
908.7
4,719.5
FY16E
84.6
2,953.9
3,038.5
1451.8
47.5
5.6
250.5
4,793.7
4,558.2
923.0
3,635.2
100.0
3,735.2
0.0
65.6
112.6
80.7
395.3
1,272.4
134.4
1,347.2
332.7
3,482.0
1,871.1
811.3
2,682.5
799.6
4,793.7
Source: Company, ICICIdirect.com Research
FY17E
84.6
3,752.6
3,837.2
901.8
47.5
11.1
275.5
5,073.0
4,908.2
1,138.0
3,770.2
100.0
3,870.2
0.0
65.6
131.4
90.7
443.4
1,484.6
156.8
1,571.9
388.2
4,044.9
2,183.2
946.6
3,129.9
915.1
5,073.0
Key ratios
(Year-end March)
Per share data (|)
EPS
Cash EPS
BV
DPS
Cash Per Share
Operating Ratios (%)
EBITDA margins
PBT margins
Net Profit margins
Inventory days
Debtor days
Creditor days
Return Ratios (%)
RoE
RoCE
RoIC
Valuation Ratios (x)
P/E
EV / EBITDA
EV / Revenues
Market Cap / Revenues
Price to Book Value
Solvency Ratios
Debt/EBITDA
Debt / Equity
Current Ratio
Quick Ratio
FY14
FY15E
FY16E
FY17E
39.2
44.4
112.4
10.0
45.5
47.2
58.1
145.6
12.0
32.7
50.4
61.8
179.5
14.0
23.4
64.7
77.5
226.7
15.0
26.2
22.8
20.2
15.9
91
99
129
24.1
21.5
17.0
90
90
125
25.0
19.7
15.3
90
85
125
25.6
21.7
16.9
90
85
125
34.9
28.5
48.2
32.4
21.4
23.4
28.0
26.7
27.9
28.6
30.5
32.0
19.0
13.4
3.2
3.1
6.6
15.8
12.3
3.0
2.7
5.1
14.8
9.8
2.5
2.3
4.1
11.5
7.8
2.0
2.0
3.3
1.2
0.6
1.8
1.2
1.7
0.8
1.4
0.9
1.0
0.5
1.3
0.8
0.5
0.2
1.3
0.8
Source: Company, ICICIdirect.com Research
.
ICICI Securities Ltd | Retail Equity Research
Page 10
ICICIdirect.com coverage universe (Healthcare)
ICICIdirect Healthcare coverage Universe
I-Direct
CMP TP
Rating M Cap
EPS (|)
PE(x)
EV/EBITDA (x)
RoCE (%)
RoNW (%)
Code
(|)
(|)
(| Cr)
FY14 FY15E FY16E FY14 FY15E FY16E FY14 FY15E FY16E FY14 FY15E FY16E FY14 FY15E FY16E
Company
Ajanta Pharma
AJAPHA 2555 3220 BUY
9108.7 66.2 75.0 85.6 38.6 34.1 29.9 24.7 21.5 17.8 44.9 40.6 38.1 39.4 32.8 28.9
Apollo Hospitals
APOHOS
1314 1075 HOLD
19050.0
22.8
27.5
35.1
57.7
47.8
37.4
29.7
25.4
19.4
11.6
12.7
14.9
10.6
11.8
13.6
Aurobindo Pharma
AURPHA
1248 1111 HOLD
35904.5
47.3
51.8
59.7
26.4
24.1
20.9
20.0
20.3
13.4
24.1
25.7
25.9
31.3
29.4
26.0
Biocon
BIOCON
414.8
410 HOLD
8256.8
20.7
20.0
22.6
20.0
20.7
18.3
12.2
12.2
10.7
13.4
11.6
12.9
13.7
12.3
12.9
Cadila Healthcare
CADHEA
1640 1538 HOLD
34243.6
39.2
51.1
66.2
41.8
32.1
24.8
30.3
22.6
17.6
15.9
19.0
21.7
23.4
24.6
25.4
Cipla
CIPLA
695.8
585 HOLD
56411.3
17.3
15.9
21.7
40.2
43.7
32.0
26.8
24.3
19.5
15.5
14.8
17.2
13.8
11.5
13.7
Divi's Laboratories
DIVLAB
1742 1633 HOLD
23642.7
56.0
62.4
81.7
31.1
27.9
21.3
23.2
19.7
16.3
29.6
28.1
29.7
26.1
23.2
25.1
Dr Reddy's Labs
DRREDD
3233 3273 HOLD
57722.1 126.7 130.7 150.5
25.5
24.7
21.5
17.4
16.5
14.2
19.2
18.6
20.0
23.7
20.2
19.4
Glenmark Pharma
GLEPHA
719.2
19649.1
25.7
21.5
16.9
15.0
11.6
16.0
21.0
22.7
18.3
21.8
22.2
775 HOLD
20.0
28.0
33.4
35.9
Indoco Remedies
INDREM
325.5
274 HOLD
2975.9
6.3
9.5
13.3
51.8
34.3
24.4
25.2
17.2
13.2
16.6
21.2
25.0
12.6
16.4
19.4
Ipca Laboratories
IPCLAB
638.3
655 HOLD
8102.7
37.9
40.5
50.7
16.8
15.7
12.6
10.6
10.4
9.9
27.6
23.1
24.7
24.4
21.4
21.7
12.1
Jubilant Life Sciences
VAMORG 172.7
123 SELL
2823.0
6.8
-6.5
20.0
25.2 -26.7
8.6
6.7
12.1
5.9
10.1
3.4
10.6
4.2
-4.2
Lupin
LUPIN
1585 1590 BUY
70345.2
41.0
49.1
58.6
38.7
32.3
27.1
24.2
18.2
16.1
34.5
36.0
34.1
26.5
25.4
24.4
Sun Pharma
SUNPHA
917.8 1036 BUY
191896.3
29.0
34.8
39.9
31.6
26.4
23.0
19.6
18.9
16.1
32.4
31.2
28.8
27.0
25.3
23.1
Torrent Pharma
TORPHA
1100 1165 HOLD
19404.9
39.2
47.2
50.4
28.0
23.3
21.8
20.6
18.3
14.7
28.5
21.4
26.7
34.9
32.4
28.0
Unichem Laboratories
UNILAB
2029.5
18.7
6.4
13.2
11.9
35.0
16.9
11.3
18.6
11.5
15.7
6.5
12.8
20.7
7.1
14.0
223
206 HOLD
Source: Company, ICICIdirect.com Research
ICICI Securities Ltd | Retail Equity Research
Page 11
RATING RATIONALE
ICICIdirect.com endeavours to provide objective opinions and recommendations. ICICIdirect.com
assigns ratings to its stocks according to their notional target price vs. current market price and then
categorises them as Strong Buy, Buy, Hold and Sell. The performance horizon is two years unless
specified and the notional target price is defined as the analysts' valuation for a stock.
Strong Buy: >15%/20% for large caps/midcaps, respectively, with high conviction;
Buy: >10%/15% for large caps/midcaps, respectively;
Hold: Up to +/-10%;
Sell: -10% or more;
Pankaj Pandey
Head – Research
[email protected]
m
ICICIdirect.com
Research
Desk,
ICICI Securities Limited,
1st Floor, Akruti Trade Centre,
Road No 7, MIDC,
Andheri (East)
Mumbai – 400 093
[email protected]
ICICI Securities Ltd | Retail Equity Research
Page 12
ANALYST CERTIFICATION
We /I, Siddhant Khandekar, CA INTER and Mitesh Shah, MS (finance), Nandan Kamat MBA Research Analysts, authors and the names subscribed to this report, hereby certify that all of the views expressed
in this research report accurately reflect our views about the subject issuer(s) or securities. We also certify that no part of our compensation was, is, or will be directly or indirectly related to the specific
recommendation(s) or view(s) in this report.
Terms & conditions and other disclosures:
ICICI Securities Limited (ICICI Securities) is a full-service, integrated investment banking and is, inter alia, engaged in the business of stock brokering and distribution of financial products. ICICI Securities is
a wholly-owned subsidiary of ICICI Bank which is India’s largest private sector bank and has its various subsidiaries engaged in businesses of housing finance, asset management, life insurance, general
insurance, venture capital fund management, etc. (“associates”), the details in respect of which are available on www.icicibank.com.
ICICI Securities is one of the leading merchant bankers/ underwriters of securities and participate in virtually all securities trading markets in India. We and our associates might have investment banking
and other business relationship with a significant percentage of companies covered by our Investment Research Department. ICICI Securities generally prohibits its analysts, persons reporting to analysts
and their relatives from maintaining a financial interest in the securities or derivatives of any companies that the analysts cover.
The information and opinions in this report have been prepared by ICICI Securities and are subject to change without any notice. The report and information contained herein is strictly confidential and
meant solely for the selected recipient and may not be altered in any way, transmitted to, copied or distributed, in part or in whole, to any other person or to the media or reproduced in any form, without
prior written consent of ICICI Securities. While we would endeavour to update the information herein on a reasonable basis, ICICI Securities is under no obligation to update or keep the information current.
Also, there may be regulatory, compliance or other reasons that may prevent ICICI Securities from doing so. Non-rated securities indicate that rating on a particular security has been suspended
temporarily and such suspension is in compliance with applicable regulations and/or ICICI Securities policies, in circumstances where ICICI Securities might be acting in an advisory capacity to this
company, or in certain other circumstances.
This report is based on information obtained from public sources and sources believed to be reliable, but no independent verification has been made nor is its accuracy or completeness guaranteed. This
report and information herein is solely for informational purpose and shall not be used or considered as an offer document or solicitation of offer to buy or sell or subscribe for securities or other financial
instruments. Though disseminated to all the customers simultaneously, not all customers may receive this report at the same time. ICICI Securities will not treat recipients as customers by virtue of their
receiving this report. Nothing in this report constitutes investment, legal, accounting and tax advice or a representation that any investment or strategy is suitable or appropriate to your specific
circumstances. The securities discussed and opinions expressed in this report may not be suitable for all investors, who must make their own investment decisions, based on their own investment
objectives, financial positions and needs of specific recipient. This may not be taken in substitution for the exercise of independent judgment by any recipient. The recipient should independently evaluate
the investment risks. The value and return on investment may vary because of changes in interest rates, foreign exchange rates or any other reason. ICICI Securities accepts no liabilities whatsoever for any
loss or damage of any kind arising out of the use of this report. Past performance is not necessarily a guide to future performance. Investors are advised to see Risk Disclosure Document to understand the
risks associated before investing in the securities markets. Actual results may differ materially from those set forth in projections. Forward-looking statements are not predictions and may be subject to
change without notice.
ICICI Securities or its associates might have managed or co-managed public offering of securities for the subject company or might have been mandated by the subject company for any other assignment
in the past twelve months.
ICICI Securities or its associates might have received any compensation from the companies mentioned in the report during the period preceding twelve months from the date of this report for services in
respect of managing or co-managing public offerings, corporate finance, investment banking or merchant banking, brokerage services or other advisory service in a merger or specific transaction.
ICICI Securities or its associates might have received any compensation for products or services other than investment banking or merchant banking or brokerage services from the companies mentioned
in the report in the past twelve months.
ICICI Securities encourages independence in research report preparation and strives to minimize conflict in preparation of research report. ICICI Securities or its analysts did not receive any compensation
or other benefits from the companies mentioned in the report or third party in connection with preparation of the research report. Accordingly, neither ICICI Securities nor Research Analysts have any
material conflict of interest at the time of publication of this report.
It is confirmed that Siddhant Khandekar, CA INTER and Mitesh Shah, MS (finance), Nandan Kamat MBA, Research Analysts of this report have not received any compensation from the companies
mentioned in the report in the preceding twelve months.
Compensation of our Research Analysts is not based on any specific merchant banking, investment banking or brokerage service transactions.
ICICI Securities or its subsidiaries collectively or Research Analysts do not own 1% or more of the equity securities of the Company mentioned in the report as of the last day of the month preceding the
publication of the research report.
Since associates of ICICI Securities are engaged in various financial service businesses, they might have financial interests or beneficial ownership in various companies including the subject
company/companies mentioned in this report.
It is confirmed that Siddhant Khandekar, CA INTER and Mitesh Shah, MS (finance), Nandan Kamat MBA, Research Analysts do not serve as an officer, director or employee of the companies mentioned in
the report.
ICICI Securities may have issued other reports that are inconsistent with and reach different conclusion from the information presented in this report.
Neither the Research Analysts nor ICICI Securities have been engaged in market making activity for the companies mentioned in the report.
We submit that no material disciplinary action has been taken on ICICI Securities by any Regulatory Authority impacting Equity Research Analysis activities.
This report is not directed or intended for distribution to, or use by, any person or entity who is a citizen or resident of or located in any locality, state, country or other jurisdiction, where such distribution,
publication, availability or use would be contrary to law, regulation or which would subject ICICI Securities and affiliates to any registration or licensing requirement within such jurisdiction. The securities
described herein may or may not be eligible for sale in all jurisdictions or to certain category of investors. Persons in whose possession this document may come are required to inform themselves of and
to observe such restriction.
ICICI Securities Ltd | Retail Equity Research
Page 13
© Copyright 2026
