
NiveshDaily - 29 January 2015.pmd
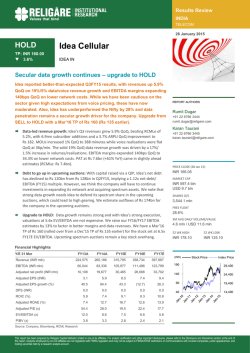
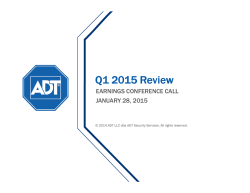
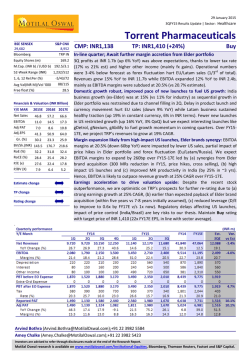
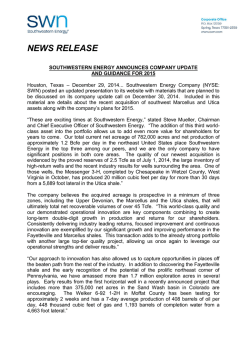
NiveshDaily January 29, 2015 INDICES Indices Previous (day) Close % chg Sensex Nifty 29,559.18 8,914.30 -0.04% +0.04% (As on 28th January, 2015) FROM RESEARCH DESK Stock Updates Max India achieves target price… continue to maintain HOLD rating with target price of Rs 518… News Updates Lupin | CCEA nod for increase in foreign investment limit in Lupin to 49% | Maintain BUY rating on the stock with price target of Rs1,710 HDFC Bank | CCEA approves HDFC Bank’s proposal of raising capital of Rs 100 bn… positive over long term, maintain HOLD with target price of Rs 910… Company Updates Bajaj Finance Ltd. (BFL) | Company Update | Outperformance likely to continue… upgrade to BUY with upwards revised target price to Rs 5,500 Results Preview DRREDDY, SSLT First Cut Analysis Torrent Pharmaceuticals| Q3FY15 First Cut Analysis | A subdued performance impacted by relatively lower sales growth and higher interest outgo | HOLD rating with PT of Rs1,010 Result Updates Ajanta Pharma Ltd.| Q3FY15 Result Update |Good show continues | Maintain HOLD rating with TP of Rs2,402 (from Rs1,846 earlier) Lumax Auto Technologies (LATL)| Q3FY15 Result Update | In line with our expectation | Maintain BUY rating on LATL with target price of Rs. 575 Alstom T&D India Ltd.| Q3FY15 Result Update | Unexpectedly Disappointing Performance | We change the rating from HOLD to SELL with TP of Rs 444 Global Markets - Outlook Result Today DRREDDY & SSLT Daljeet S. Kohli Head of Research Tel: +91 22 66188826 [email protected] IndiaNivesh Research IndiaNivesh Securities Private Limited 601 & 602, Sukh Sagar, N. S. Patkar Marg, Girgaum Chowpatty, Mumbai 400 007. Tel: (022) 66188800 IndiaNivesh Research is also available on Bloomberg INNS, Thomson First Call, Reuters and Factiva INDNIV. Stock Updates Daljeet S. Kohli Head of Research Tel: +91 22 66188826 [email protected] Yogesh Hotwani Research Analyst Tel: +91 22 66188839 [email protected] Max India achieves target price… continue to maintain HOLD rating with target price of Rs 518… Max India has moved up significantly in last 1 / 3 month by 30% / 52% on back of 1) news of Increase in FDI limit in insurance by passing ordinance and 2) disclosure by company for corporate restructuring. We had recommended buy on Max India in our report ‘Investment strategy…. Regardless of election outcome’ on 5th March 2014 at Rs 190 with target price of Rs 274 which was further upgraded to Rs 329 on 18th August 2014 and to Rs 465 on 14th January 2015 and to Rs 518 on 27th January 2015. Yesterday the stock has achieved all our earlier targets yielding returns of 162% since 5th March 2014. The key rationales for recommendation were 1) Max India taking advantage of India’s increasing insurance market size, increasing penetration and improving demographics and 2) leveraged its expertise in healthcare business by taking the advantages of under penetrated healthcare segment, lower bed density and lowest per capita spending. Max Life Insurance business continues to do well and maintain its growth momentum at mid teen growth rate with strong persistency rate. Max Health also continues to show traction on operating front with improving occupancy rate and EBITDA margins. At CMP of Rs 498, Consolidated Max India is trading at P/ABV of 3.9x and 2.9x for FY16E and FY17E respectively. We continue to maintain hold rating on Max India with SOTP target price to Rs 518, valuing Max Life based on past deals in insurance sector at ~3x embedded value for FY17E, 16x EV/EBITDA Max Healthcare business for FY17E and 1x invested capital for Max bupa for FY17E. However we continue to like the company and individual businesses and maintain positive outlook on the stock. Daljeet S. Kohli Head of Research Tel: +91 22 66188826 [email protected] Tushar Manudhane Research Analyst Tel: +91 22 66188835 [email protected] Lupin | CCEA nod for increase in foreign investment limit in Lupin to 49% | Maintain BUY rating on the stock with price target of Rs1,710 The Cabinet Committee on Economic Affairs (CCEA) gave its approval on 28 January 2015 to a proposal by pharmaceuticals company Lupin Limited for an increase in the aggregate limit of investment by foreign institutional investors (FIIs) and their sub-accounts registered with Securities and Exchange Board of Inda (SEBI) from 33 percent to 49 percent. (for details, pls clink the link below) http://netindian.in/news/2015/01/28/00032397/ccea-nod-increase-foreigninvestment-limit-lupin-49 Our view: This has been awaited for long time now. Foreign investment limit has now revised to 49% from 33% earlier. We believe that this could be sentiment booster for Lupin. We continue to like business model of Lupin as it is on track in terms of building blocks for future growth in sales as well as profitability. At CMP price of Rs1,513, the stock is trading at 27.5x FY15E EPS of Rs55.1 and 22.1x FY16E EPS of Rs68.4. We maintain BUY rating on the stock with price target of Rs1,710, based on 25x FY16E earnings. IndiaNivesh Research NiveshDaily January 29, 2015 | 2 News Updates Daljeet S. Kohli Head of Research Tel: +91 22 66188826 [email protected] Yogesh Hotwani Research Analyst Tel: +91 22 66188839 [email protected] CCEA approves HDFC Bank’s proposal of raising capital of Rs 100 bn… positive over long term, maintain hold with target price of Rs 910… On 28th January 2015, Cabinet committee on Economic Affairs (CCEA) has approved HDFC Bank’s fund raising plan of Rs 100 bn. On 19th December 2014, Foreign Investment Promotion Board (FIPB) had given clearance to HDFC Bank’s fund raising plan of Rs 100 bn. HDFC bank’s board has already given approval for raising Rs 100 bn in its board meeting held in May 2014. Our take Currently HDFC bank’s capital adequacy ratio is at 15.7% as per Basel III norms with Tier I capital of 11.8% which is higher than the regulatory requirement of 11.5% which the banks have to reach by FY19 as per Basel III norms. Post this capital, we are expecting capital adequacy ratio for HDFC bank to increase to 17.1% and tier I capital to 13.5% assuming it raise capital at current market price of Rs 1035. Currently HDFC bank is trading at P/ABV of 5.1x and 4.2x for FY15E and FY16E ABV respectively. We continue to maintain our positive view and hold rating on the stock with target price of Rs 910. Capital Adequacy CAR (%) Tier I (%) Tier II (%) Current After Capital raising 15.7 17.1 11.8 13.5 3.9 3.6 Source: IndiaNivesh Research, Assumptions are taken at CMP of IndiaNivesh Research NiveshDaily January 29, 2015 | 3 Results Preview Tushar Manudhane Research Analyst Dr Reddy’s Lab | Reco: BUY | TP: Rs.3,581 Tel: +91 22 66188835 [email protected] SALES DRRD IN (Rs Mn) Q3FY15E Q3FY14 Q2FY15 Y-o-Y Ch. (%) Q-o-Q Ch. (%) 37,458 35,338 35,879 6.0 4.4 Operating Profit (EBIT) 6,700 8,467 6,200 (20.9) 8.0 Adj Net Profit 5,881 6,185 5,860 (4.9) 0.4 - 497 (118) NA - Rep Net Profit 5,881 6,683 5,742 (12.0) 2.4 EPS (Rs.) 34.63 36.41 34.50 (4.9) 0.4 bps bps Forex (loss) gain/ other EBIT Margins (%) 17.9 24.0 17.3 (607) 60 Net Margins (%) 15.7 17.5 16.3 (180) (63) Source: Company Filings, IndiaNivesh Research We expect Dr. Reddy Laboratories to report contraction in adjusted PAT for second consecutive quarter. We expect adjusted PAT to decline by 12% y-y to Rs5.9bn for the quarter, led by muted US sales and Russian currency devaluation. We expect US sales to remain almost flat y-y to US$270mn for the quarter due to high base of past year. Domestic formulation sales are expected to grow at industry average rate of 15% y-y. We expect EBITDA margin to decline by 607bps y-y due to lower share of limited competition products in the total sales. Key factors to watch: performance in PSAI segment, domestic formulation segment and US market. R&D spend would also be the key factor to watch. Valuation At CMP of Rs3,238, the stock trades at 25.0x FY15E EPS of Rs129 and 22.6x FY16E EPS of Rs143. We have BUY rating with price target of Rs3,581, based on 25x FY16 earnings. Abhishek Jain Research Analyst Tel: +91 22 66188832 [email protected] Sesa Sterlite | Reco: BUY | TP: Rs.378 Quick Fundamentals (Rs. Mn) Sesa Sterlite Revenue EBIDTA PAT EPS (RS.) EBITDA % PAT % Q3FY15e BL 192,920 58,612 14,150 4.77 Margin % 30.4 7.3 Q2FY15 195,494 63,269 16,193 5.46 Margin % 32.4 8.3 Q3FY14 195,230 64,903 18,683 6.30 Margin % 33.2 9.6 Q-o-Q % ‐1.3 ‐7.4 ‐12.6 ‐12.6 bps -198 -95 Y-o-Y% ‐1.2 ‐9.7 ‐24.3 ‐24.3 -286 -224 Source: Company Filings; IndiaNivesh Research; BL‐ Bloomberg Consolidated net sales to decline 1.3% QoQ and 1.2% YoY Rs. 192.9b, driven by (1) lower oil prices driving 30% drop in sales at Cairn, and (2) lower iron ore and copper realization, offset partly by higher realization in zinc business. We expect EBITDA margin to contract 286 bps YoY due to impact of lower oil prices at Cairn offset partly by (a) higher realizations in zinc business (b) better profitability in power business on slightly better utilization Key points to watch out Resumption of mining activity in Goa Forex gain/loss Valuation Sesa Sterlite is one of the largest diversified metal companies in India, with operations in aluminium, copper, zinc, iron ore, oil and power. Thus earning streams would be relatively stable given its diversification across commodities. Further resumption of Karnataka and Goa mines would lead to rerating on the stock. At CMP Rs 201 the stock is trading at 4.2 x FY16E EV/EBITDA. We maintain BUY rating on the stock with target price to Rs. 378 (based on 7x FY16 EV/EBITDA). IndiaNivesh Research NiveshDaily January 29, 2015 | 4 Company Update January 29, 2015 Bajaj Finance Ltd. (BFL) Previous Outperformance likely to continue… upgrade to BUY with upwards revised target price to Rs 5,500 Rating : BUY Rating : HOLD Target : Rs.5,500 Target : Rs.3,418 BFL continues to remain preferred pick for investors led by strong business growth, safer business model with lowest NPAs in industry and limited investment options in financial space. We believe sharp move in stock price is mainly led by continuous foreign flow in markets specifically in businesses which continues to do well in terms of overall business metrics. Within the financial space, we believe private sector banks and NBFCs qualifies for the said investment purpose. However since investment options to foreign investors are very limited as foreign investment limit in most of the private sector banks is either close to allowable limit or already breached the limit, Bajaj Finance in NBFC space qualifies for both strong company fundamentals and also in terms of scope for further foreign investments. Current CMP : Rs.4,323 STOCK INFO BSE NSE Bloomberg Reuters Sector Face Value (Rs) Equity Capital (Rs Mn) Mkt Cap (Rs Mn) 52w H/L (Rs) Avg Daily Vol (BSE+NSE) 500034 BAJFINANCE BAF IN BJFN.BO NBFC 10 502 216,778 4492/1460 41,947 SHAREHOLDING PATTERN % (as on Dec. 2014) Institutions Others, Incl Public Promoters 19.4 19.0 61.6 Source: BSE STOCK PERFORMANCE (%) BAJFINANCE SENSEX 1m 25 9 3m 54 10 12m 180 43 Source: Capitaline, IndiaNivesh Research BAJFINANCE v/s SENSEX 250 210 170 130 BAJFINANCE Sensex Source: Capitaline, IndiaNivesh Research Daljeet S. Kohli Head of Research Tel: +91 22 66188826 [email protected] Yogesh Hotwani Research Analyst Tel: +91 22 66188839 [email protected] IndiaNivesh Research 26/01/2015 12/01/2015 29/12/2014 15/12/2014 01/12/2014 17/11/2014 03/11/2014 20/10/2014 06/10/2014 22/09/2014 08/09/2014 25/08/2014 11/08/2014 28/07/2014 14/07/2014 30/06/2014 16/06/2014 02/06/2014 19/05/2014 05/05/2014 21/04/2014 07/04/2014 24/03/2014 10/03/2014 24/02/2014 10/02/2014 27/01/2014 90 BFL continues to perform well on overall business metrics with Asset Under Management growth of 57% CAGR in FY09-14. As a result, AUM has grown 12.1x since FY09 which remains best in the industry. This growth is mainly due to company’s presence in segments which continues to remain unaffected by recent slowdown in the economy. Penetration level in Consumer financing specially consumer durables financing, digital product financing and two wheeler financing continue to increase. Also cross selling of other products and SME financing (Mortgage and LAP) remains the other key growth drivers. Further BFL continues its growth trajectory in Q3FY15 as well with AUM growth 37% yoy to Rs 308 bn led by strong demand for consumer financing in festive season. Growth in SME Financing (which includes Mortgage, Loan against property Small Business Loan and Loan Against securities) for BFL also remains strong at 46% yoy in Q3FY15. NIMs (calc) for BFL is best in the industry at 11.2% in FY14 which has improved marginally to 11.7% in Q3FY15 due to seasonality of higher disbursements in high yielding consumer segment on back of festive season. Bank Borrowings for BFL has come down significantly 56% in FY14 to 47% in Q3FY15 mainly due to cost differentials between bank and market borrowings. Asset quality of BFL also remains strong and best in the industry at Gross NPA of 1.5% and Net NPA of 0.49%. Further there is no impact on BFL on back of change in regulations by RBI of higher standard asset provisioning and early recognition of NPAs. BFL already follows substantially stringent policy on provisioning which was higher than RBI norms applicable for NBFCs. BFL continues to provide 0.4% on all standard assets as against earlier regulatory requirement of 0.25% and inline with current regulatory requirement of 0.4%. BFL recognize NPAs on 90 days overdue as against earlier regulatory requirement of 180 days and current requirement of 90 days. On capital adequacy front as well, BFL remains best with CAR of 18.7% and Tier I capital of 14.7% in Q3FY15. Valuation BFL continues to remain preferred pick for investors led by strong business growth, safer business model with lowest NPAs in industry and limited investment options in financial space. We believe BFL deserves premium valuation compared to other NBFCs and private sector banks due to reasons stated above and better return profile with ROE / ROA of 21% / 3% for FY17E. We have built in 25% AUM CAGR FY15-17E leading to 23-25% growth in Net interest income and Net profit. At CMP of Rs 4,323, the stock is trading at P/ABV of 3.7x and 3.2x for FY16E and FY17E respectively. We upgrade BFL to buy from hold with upwards revised target price of Rs 5,500, 4x FY17E ABV. IndiaNivesh Securities Private Limited 601 & 602, Sukh Sagar, N. S. Patkar Marg, Girgaum Chowpatty, Mumbai 400 007. Tel: (022) 66188800 IndiaNivesh Research is also available on Bloomberg INNS, Thomson First Call, Reuters and Factiva INDNIV. Company Updates (contd...) (We have initiated BUY on BFL on 24th April 2012 at Rs 847 with target price of Rs 1,040 and initiated coverage on 12th July 2013 with strong BUY rating on the stock at Rs 939 with target price of Rs 1,125. Further we have upgraded the target price continuously to Rs 3418 on 15th January 2015. All our earlier targets on BFL was achieved yielding returns of 410% (based on yesterday’s closing price) since 24th April 2012). Income Statement (Rs Mn) Interest Earned Interest Expended Net Interest Income Other Income Net Income Total Income Total Expenses Pre Provision Profit Provisions Profit before tax Tax Net Profit Source: IndiaNivesh Research Balance Sheet (Rs Mn) Liabilities Equity Reserves and Surplus Net Worth Borrowings Other Liabilities & Provisions Total Liabilities Assets Assets on Finance Investments Net Block Other Assets Total Assets Source: IndiaNivesh Research FY14 37886 15732 22153 2848 25001 40733 11511 13490 2578 10912 3722 7190 FY14 FY15E 51506 22670 28836 3011 31847 54517 14532 17315 3550 13765 4703 9062 FY15E FY16E 66156 29205 36950 3289 40240 69445 18292 21948 4683 17264 5898 11366 FY17E 81588 36279 45309 3555 48864 85143 22249 26616 5841 20775 7098 13678 FY16E FY17E 498 39411 39909 197496 7220 244625 502 48925 49426 262181 11378 322985 502 59227 59729 333024 13059 405812 502 70413 70915 410133 14359 495408 229710 282 2199 12434 244625 308914 282 2419 11370 322985 391085 282 2660 11784 405812 481049 282 2926 11150 495408 IndiaNivesh Research Valuation Ratios Earning Per Share (Rs) Book Value Per Share (Rs) Adj Book Value Per Share (Rs) Dividend Per Share (Rs) P/E (x) P/BV (x) P/ABV (x) Growth Y‐o‐Y (%) Asset Under Management Borrowings Balance Sheet Net Interest Income Other Income Net Profit Return Ratios (%) ROAE ROAA Yield / Margin (%) Yield on Funds Cost of Funds Interest Spread Net Interest Margin Net Profit Margin Dividend Yield Other Ratios (%) Cost / Income Provision Coverage Ratio Net NPA Source: IndiaNivesh Research Bajaj Finance Ltd.|Company Updates FY14 145 802 783 16.1 31.1 5.6 5.8 FY15E 181 986 956 17.1 24.9 4.6 4.7 FY16E 227 1191 1153 18.1 19.9 3.8 3.9 FY17E 273 1414 1367 19.1 16.5 3.2 3.3 37.4 50.4 38.1 28.9 52.6 25.2 33.9 32.8 32.0 30.2 5.7 26.1 26.9 27.0 25.6 28.1 9.2 25.4 23.0 23.2 22.1 22.6 8.1 20.3 19.6 3.4 20.3 3.2 20.8 3.1 20.9 3.0 18.2 9.6 8.7 10.7 17.7 0.4 18.3 9.9 8.4 10.2 16.6 0.4 18.1 9.8 8.3 10.1 16.4 0.4 17.9 9.8 8.1 9.9 16.1 0.4 46.0 75.1 0.3 45.6 65.2 0.5 45.5 65.2 0.5 45.5 65.2 0.5 January 29, 2015 | 2 First Cut Analysis January 29, 2015 Torrent Pharmaceuticals Ltd. Previous A subdued performance impacted by relatively lower sales growth and higher interest outgo Rating : HOLD Rating : HOLD Target : Rs.1,010 Target : Rs.1,010 Torrent Pharmaceuticals (TRP IN) reported below-expectation PAT at Rs1.67bn, led by y-y sales de-growth in Europe and higher interest cost. EBITDA margin improved by 53bps y-y to 19.7%, despite gross margin remaining stable for the quarter on y-y basis. At CMP of Rs1,209, the stock trades at 22.5x FY15E EPS of Rs53.6 and 21.5x FY16E EPS of Rs56. We have HOLD rating with PT of Rs1,010, based on 18x FY16 earnings. We will review our estimates, PT and rating post concall scheduled today at 5pm. Current CMP : Rs.1,209 Rs.mn Revenue EBIDTA Adjusted PAT PAT Q3FY15 11,560 2,280 Q3FY14 9,900 1,900 Q2FY15 12,030 2,590 Y-O-Y % 16.8 20.0 Q-o-Q % (3.9) (12.0) INSPL Est Variance(%) 12,962 (10.8) 2,845 (19.9) 1,670 1,580 1,980 5.7 (15.7) 2,045 (18.3) 1,670 1,580 1,980 5.7 (15.7) 2,045 (18.3) Source: IndiaNivesh Research Domestic formulation and US sales drive overall sales growth for the quarter: TRP’s sales came in at Rs11.6bn, up 16.8% y-y, led by addition of Elder portfolio, decent growth in remaining domestic formulation (DF) segment. Excluding Elder portfolio, the DF sales grew by 15% y-y. Even the Elder portfolio grew at healthy rate of 15% y-y compared to market contraction of 5% on rolling quarter basis. There has been moderate growth of 14% y-y in US sales to US$27mn. The y-y growth has been on downtrend for third consecutive quarter now. This has been mainly due to lack of potential approvals and high base of past quarters. Europe sales declined by 9% to Rs2.3bn. Brazil sales grew at modest rate of 6% to Rs1.6bn. After two consecutive quarters of strong y-y growth in Brazil, the y-y growth dipped in Q3FY15, mainly due to currency fluctuations. In constant currency terms, Brazil sales grew by 19% on y-y basis for the quarter. ROW sales at Rs1.1bn grew by 12% y-y for the quarter. Though sales up 16.8% y-y, PAT is up only 5.7% y-y: Gross margin at 67.8% was stable y-y and down 51bps q-q. The sequential drop in gross margin is due to increased competition in few products in US market. However, EBITDA margin grew by 53 bps y-y to 19.7% y-y. This is mainly due to improved productivity resulting in employee cost as % of sales reducing from 18.1% to 17.2% for the quarter. The improvement in EBITDA margin and higher other income was offset by higher depreciation and higher interest cost. This resulted in moderate growth of 5.7% y-y in adjusted PAT to Rs1.7bn. Daljeet S. Kohli Head of Research Tel: +91 22 66188826 [email protected] Tushar Manudhane Research Analyst Tel: +91 22 66188835 [email protected] IndiaNivesh Research Inorganic growth on cards: Board of TRP has decided to obtain enabling approval from shareholders for issue of equity shares including convertible bonds or debentures through qualified institutional placement (QIP) or depository receipt or any other mode for amount not exceeding Rs30bn. Board has decided to obtain approval for private placement of unsecured/secured redeemable non-convertible debentures/bonds for amount not exceeding Rs75bn, subject to overall borrowing not exceeding Rs100bn. Raising maximum amount of Rs30bn as equity would have dilution of equity to the extent of 15% on pre-dilution outstanding equity shares. The amount of money to be raised indicates acquisition in medium term. We would give more details post clarification in the concall scheduled today. Valuation: At CMP of Rs1,209, the stock trades at 22.5x FY15E EPS of Rs53.6 and 21.5x FY16E EPS of Rs56. We will review our estimates, PT and rating post concall scheduled today at 5pm. We have HOLD rating with PT of Rs1,010, based on 18x FY16 earnings. IndiaNivesh Securities Private Limited 601 & 602, Sukh Sagar, N. S. Patkar Marg, Girgaum Chowpatty, Mumbai 400 007. Tel: (022) 66188800 IndiaNivesh Research is also available on Bloomberg INNS, Thomson First Call, Reuters and Factiva INDNIV. First Cut Analysis (contd...) Quarterly financial summary Rs mn Net Sales Other operating income Consumption of raw material Employee Cost Manufacturing & Other Expenditure Operating Expenses EBITDA Other income Depreciation and Amortization EBIT Net Interest Expenses Profit Before Tax Tax Net Profit After Tax Minority Interest Adj. PAT Adj. EPS (Rs) EO items Reported PAT Rep. EPS (Rs) Q3FY15 11,560 120 3,720 1,990 3,570 9,280 2,280 650 540 2,510 500 2,010 340 1,670 1,670 9.9 1,670 9.9 Q3FY14 9,900 250 3,180 1,790 3,030 8,000 1,900 100 210 2,040 160 1,880 300 1,580 1,580 9.3 1,580 9.3 Y-y (%) 16.8 (52.0) 17.0 11.2 17.8 16.0 20.0 550.0 157.1 23.0 212.5 6.9 13.3 5.7 NA 5.7 5.7 5.7 5.7 Q2FY15 12,030 140 3,810 2,240 3,390 9,440 2,590 720 560 2,890 540 2,350 370 1,980 1,980 11.7 1,980 11.7 Q-q (%) (3.9) (14.3) (2.4) (11.2) 5.3 (1.7) (12.0) (9.7) (3.6) (13.1) (7.4) (14.5) (8.1) (15.7) NA (15.7) (15.7) (15.7) (15.7) 9MFY15 9MFY14 34,510 28,290 480 1,300 10,540 9,230 6,070 5,330 9,800 9,010 26,410 23,570 8,100 4,720 1,860 640 1,310 640 9,130 6,020 1,280 390 7,850 5,630 1,640 1,070 6,210 4,560 6,210 4,560 36.7 26.9 (360.0) 6,210 4,200 36.7 24.8 Y-y (%) 22.0 (63.1) 14.2 13.9 8.8 12.0 71.6 190.6 104.7 51.7 228.2 39.4 53.3 36.2 NA 36.2 36.2 47.9 47.9 Key ratios Ratios Adj Gross Margins Adj EBITDA margin Net Margin Material cost/Net Sales Employee Cost/ Net Sales Other Expenditure/ Net Slaes Tax Rate 67.8 19.7 14.3 32.2 17.2 30.9 16.9 67.9 19.2 15.6 32.1 18.1 30.6 16.0 (6) 53 (127) 6 (87) 28 96 68.3 21.5 16.3 31.7 18.6 28.2 15.7 (51) (181) (197) 51 (141) 270 117 69.5 23.5 17.7 30.5 17.6 28.4 20.9 67.4 16.7 15.4 32.6 18.8 31.8 19.0 208 679 234 (208) (125) (345) 189 Sales breakdown ( Rs Mn) Q3FY15 Q3FY14 Y-y (%) Q2FY15 Q-q (%) 9MFY15 9MFY14 Y-y (%) Branded business 4,203 881 5,084 1,558 1,717 2,257 1,064 11,680 2,960 760 3,720 1,470 1,480 2,480 1,000 10,150 42.0 15.9 36.7 6.0 16.0 (9.0) 6.4 15.1 4,420 980 5,440 1,600 1,670 2,480 980 12,170 (4.9) (10.1) (6.5) (2.6) 2.8 (9.0) 8.6 (4.0) 12,143 2,121 14,314 4,648 6,077 7,037 2,914 34,990 9,050 2,430 11,510 4,050 3,760 6,790 3,470 29,580 34.2 (12.7) 24.4 14.8 61.6 3.6 (16.0) 18.3 Contract Manufacture Total Domestic Sales Brazil USA Europe ROW Net Sales Source: Company Filings; IndiaNivesh Research IndiaNivesh Research Torrent Pharmaceuticals Ltd|First Cut Analysis January 29, 2015| 2 First Cut Analysis (contd...) Financial Summary Profit & Loss Y E March (Rs m) Net sales Growth % Other Operating Income Total sales Expenditure Raw Material Employee cost Other expenses EBITDA Growth % EBITDA Margin % Depreciation EBIT EBIT Margin % Other Income Interest PBT Tax Effective tax rate % Extraordinary items Minority Interest Adjusted PAT Growth% PAT margin % Reported PAT Growth% Balance sheet FY12 FY13 FY14 FY15E FY16E 25,944 22.3% 1,015 26,959 30,540 17.7% 1,580 32,120 40,360 32.2% 1,480 41,840 49,334 22.2% 1,562 50,896 57,643 16.8% 1,722 59,365 9,260 12,430 6,230 7,410 9,700 12,480 6,930 9,520 38.4% 37.4% 22.7% 23.6% 830 870 6,100 8,650 20.0% 21.4% 430 380 340 590 6,190 8,440 1,470 1,800 23.7% 21.3% (370) (20) 4,700 6,640 34.5% 41.3% 15.4% 16.5% 4,330 6,640 52.4% 53.3% 14,677 9,425 14,251 12,543 31.8% 25.4% 1,030 11,513 23.3% 1,810 1,788 11,535 2,457 21.3% 9,078 36.7% 18.4% 9,078 36.7% 18,302 11,040 16,401 13,622 8.6% 23.6% 1,125 12,497 21.7% 1,000 1,474 12,023 2,525 21.0% 9,498 4.6% 16.5% 9,498 4.6% 8,631 5,337 7,984 5,007 22.4% 19.3% 817 4,189 16.1% 445 395 4,240 723 17.1% (654) (23) 3,494 29.3% 13.5% 2,840 5.1% Y E March (Rs m) FY12 FY13 FY14 FY15E FY16E Share Capital Reserves & Surplus Net Worth Minority Interest 423 11,803 12,226 40 423 13,796 14,219 4 846 18,178 19,024 4 846 25,562 26,409 4 846 33,081 33,927 4 Secured Loans Unsecured Loans Total debt Net defered tax liability Total Liabilities 3,220 2,520 5,740 510 18,516 5,474 1,587 7,061 258 21,542 8,890 19,890 17,890 2,464 2,464 2,464 11,354 22,354 20,354 (182) (182) (182) 30,201 48,586 54,104 Gross Block Less: Depreciation Net Block Capital Work in Progress Investments Current Assets Inventories Sundry Debtors Cash & Bank Balance Other Current Assets Loans & advances 12,650 4,105 9,160 1,070 666 12,955 4,757 8,198 3,273 844 14,200 5,447 8,753 6,177 2,464 37,654 6,477 31,177 6,177 2,464 41,689 7,602 34,087 6,177 2,464 5,320 5,230 7,610 1,150 560 19,870 9,239 6,878 6,270 1,859 968 25,213 10,060 10,994 7,694 2,590 1,209 32,547 14,192 11,083 3,819 2,590 1,216 32,901 16,582 12,950 5,934 2,590 1,421 39,477 11,550 700 12,250 7,620 18,516 12,266 3,720 15,986 9,227 21,542 16,202 3,538 19,740 12,807 30,201 20,595 3,538 24,133 8,768 48,586 24,564 3,538 28,102 11,376 54,104 FY12 16.8 21.6 4.3 72.2 FY13 25.6 30.5 11.5 84.0 FY14 39.2 44.4 10.0 112.4 FY15E 53.6 59.7 8.6 156.0 FY16E 56.1 62.8 10.0 200.5 ROCE ROE 12.6% 23.2% 13.4% 30.5% 16.9% 34.9% 14.1% 34.4% 14.3% 28.0% EBITDA Margin % Net Margin % 19.3% 13.5% 22.7% 15.4% 23.6% 16.5% 25.4% 18.4% 23.6% 16.5% PER (x) P/BV (x) P/CEPS (x) EV/EBITDA (x) Dividend Payout (%) 72.04 16.7 55.9 40.5 23.6 47.25 14.4 39.7 29.64 45.6 30.81 10.8 27.2 21.88 27.0 22.54 7.7 20.2 17.79 20.0 21.54 6.0 19.3 16.08 20.0 7.9 (0.2) (0.4) 6.7 0.1 0.1 5.1 0.2 0.4 4.1 0.7 1.5 3.5 0.4 1.1 Current Liabilities & provisions Current Liabilities Provisions Net Current Assets Total assets Key ratios Cash Flow Y E March (Rs m) PBT Depreciation Interest Other non cash charges Changes in working capital Tax Cash flow fromoperations Capital expenditure Free Cash Flow Other income Investments Cash flow from investments Equity capital raised Loans availed or (repaid) Interest paid Dividend paid (incl tax) Cash flow from Financing Net change in cash Cash at the beginning of the year Foreign currency exchange impact Cash at the end of the year FY12 3,586 817 66 (87) 1,436 (827) 4,991 (1,613) 3,378 305 (62) (1,370) (248) (307) (1,373) (1,927) 1,694 6,048 (134) 7,610 FY13 5,820 827 430 (4,218) (1,325) 1,535 (2,929) (1,394) 425 87 (2,417) 1,343 (312) (834) 197 (685) 7,608 (49) 6,270 FY14 8,440 870 312 186 (1,197) (2,617) 5,994 (4,001) 1,994 337 106 (3,558) 4,149 (610) (2,674) 865 3,301 6,270 (624) 7,694 FY15E FY16E 9,679 12,023 1,030 1,125 1,788 1,474 164 (493) (2,457) (2,525) 10,204 11,604 (3,453) (4,035) 6,751 7,569 (20,000) (23,453) (4,035) 11,000 (2,000) (1,788) (1,474) (1,693) (1,980) 7,518 (5,454) (5,731) 2,115 9,550 3,819 3,819 5,934 Y E March EPS (Rs) Cash EPS (Rs) DPS (Rs) BVPS m cap/sales (x) net debt/equity (x) net debt/ebitda (x) Source: Company Filings; IndiaNivesh Research IndiaNivesh Research Torrent Pharmaceuticals Ltd|First Cut Analysis January 29, 2015| 3 Result Update January 29, 2015 Ajanta Pharma Ltd. Good show continues Current Previous CMP : Rs.2,681 Rating : HOLD Rating : HOLD Target : Rs.2,402 Target : Rs.1,846 STOCK INFO BSE NSE Bloomberg Reuters Sector Face Value (Rs) Equity Capital (Rs mn) Mkt Cap (Rs mn) 52w H/L(Rs) Avg Daily Vol (BSE+NSE) 532331 AJANTPHARM AJP IN AJPH.BO Pharmaceutical 5 177 94,441 2,750 / 777 118,338 SHAREHOLDING PATTERN % (as on Dec. 2014) Promoters FIIs DIIs Public & Others 73.8 7.3 1.5 17.4 Source: BSE STOCK PERFORMANCE (%) 1m AJP 12.7 SENSEX 8.5 3m 12m 43.1 184.9 10.0 42.9 Source: Capitaline, IndiaNivesh Research AJANTA PHARMA v/s SENSEX 300 250 200 150 100 50 ‐ AJANTA PHARMA SENSEX Index Source: Capitaline, IndiaNivesh Research Daljeet S. Kohli Head of Research Tel: +91 22 66188826 [email protected] Tushar Manudhane Research Analyst Tel: +91 22 66188835 [email protected] IndiaNivesh Research Adjusted PAT of Ajanta Pharma (AJP IN) at Rs821mn, was better-than-expectation, led by improved operating margin. AJP has delivered highest ever EBITDA margin at 35% in past fifteen quarters. The superior product mix and improved efficiency led to such improvement in operating performance. We raise our FY15E and FY16E EPS by 8.6% and 7.2% to Rs88.5 and Rs99, respectively. We also introduce FY17E earnings and roll forward our valuation to 20x (unchanged) FY17E EPS of Rs120.1 to arrive at revised price target of Rs2,402 (from Rs1,846 earlier). At CMP of Rs2,681, the stock is trading at 27x FY16E EPS of Rs99 and 22.3x FY17E EPS of Rs120. We maintain HOLD based on valuation. Particulars (Rs Mn) Q3FY15 Q3FY14 Q2FY15 YoY % Net Sales 3,563 EBITDA 1,251 Adj PAT Reported PAT QoQ % INSPL Est Variance (%) 2,926 3,312 21.8 7.6 3544 0.5 910 1,046 37.6 19.6 1095 14.3 821 644 775 27.5 6.0 751 9.4 848 624 786 35.8 7.8 751 12.9 Source: IndiaNivesh Research Highest ever quarterly EBITDA margin in past 15 quarters: AJP’s adjusted PAT grew by 27.5% y-y to Rs821mn. It surpasses previous high in terms of quarterly adjusted PAT. The robust performance was driven by domestic formulation (DF), Asia region and improved efficiency. The superior product mix led to lower material cost, resulting in gross margin improving by 310bps y-y and 104bps q-q to 71.8% for the quarter. In addition, lower antimalarial business in Africa also led to increase in gross margin. Employee cost remained at similar rate of 13.5% of net sales for the quarter. Other expenses, though increased by 15.2% y-y on absolute basis, it formed 23.2% of net sales, down 133bps y-y and 258bps q-q, indicating increased efficiency. R&D expense was at Rs110mn for Q3FY15 and formed 3% of net sales. Management has guided of 4.5% of net sales to be spent on R&D for FY15. The R&D spend would be divided equally for DF, regulated markets and emerging markets, respectively. Tax rate for quarter at 32.3% was higher by 259bps y-y and 143bps q-q. Ophthalmology and Cardiology drive DF sales for the quarter: Domestic sales at Rs1.3bn, grew by 36%y-y, led by 29.8% y-y growth in domestic branded formulation sales and 76.9% y-y growth in institutional sales. Ophthalmology and cardiology remained the key therapy areas, where AJP has shown superior growth of 38% y-y and 35.7% y-y, respectively. Dermatalogy grew at relatively moderate rate of 14.3% y-y for the quarter. AJP launched six new products during the quarter, out of which, two were new to market. The new product launches and increased volume growth in existing products led to better-than-industry growth for AJP during the quarter. We expect robust growth to continue for AJP on the back of new product launches and increased market share in existing products. Lower anti-malaria business led to relatively moderate growth in emerging markets: Emerging market sales grew by 14.4% y-y to Rs2.2bn. There has been downtrend in y-y growth in emerging market sales for past two quarters, mainly due to lower anti-malarial business in Africa. Excluding anti-malarial business, Africa sales grew at commendable rate of 48% y-y. Asia sales grew at steady rate of 25% yy to Rs1.1bn for the quarter. AJP launched four products each in Africa and Asia region. We expect newer products and increased reach of brands in emerging market would drive growth in this segment for AJP. AJP’s effort on track for regulated market: AJP’s cumulative ANDA filing stands at 25. AJP has approval for 2 ANDAs and has launched one in US through its own front end. AJP had sales to the tune of Rs30mn from this product in 9MFY15. AJP has guided for at-least 6 ANDA filing every year over next 2-3 years. IndiaNivesh Securities Private Limited 601 & 602, Sukh Sagar, N. S. Patkar Marg, Girgaum Chowpatty, Mumbai 400 007. Tel: (022) 66188800 IndiaNivesh Research is also available on Bloomberg INNS, Thomson First Call, Reuters and Factiva INDNIV. Result Update (contd...) Capex update: The capex program at Dahej, located in Gujarat, is on track. AJP has spent Rs1.96bn till date out of Rs2.2bn to be spent in total. AJP expects commercialization of this facility by Q1FY16. AJP has envisaged capex of Rs1.8bn for Savli facility, located in Gujarat and have spent Rs150mn till date. The technical issue at the site has led to delay in construction of this facility and is now expected to start in Q1FY16 and complete by Q4FY17. Board approved splitting of equity shares Rs5 to Rs2 per share: Board has approved sub-division of nominal value of equity shares from Rs5 to nominal value of Rs2, resulting in increase in equity shares to 87.9mn from 35.1mn currently. The paid-up share capital would remain same at Rs175.8mn. Management has guided for the procedure to complete by the end of Q4FY15. Valuation: On the back of robust performance, we raise our adjusted PAT estimate for FY15E and FY16E by 8.6% and 7.2% to Rs3.2bn and Rs3.5bn, respectively. We also introduce FY17E earnings and roll forward our valuation. We now value AJP at 20x (unchanged) FY17E earnings to Rs2,402 (from Rs1,846 earlier. We have not factored any earnings from regulated market in our FY17E financials. Hence there remains upward bias in earnings, depending on regulatory approval for its facility. We remain bullish on business model of AJP. However, we maintain HOLD rating based on limited upside from current levels. Key changes in estimates and introducing FY17E estimates Rs mn Sales EBITDA PAT EPS (Rs) PT (Rs) Old estimates FY15E FY16E 13,935 16,466 4,306 4,989 2,880 3,262 81.5 92.3 1,846 New estimates FY15E FY16E 14,329 17,159 4,671 5,371 3,128 3,498 88.5 99.0 Change (%) Introducing FY15E FY16E FY17E 2.8 4.2 20,095 8.5 7.6 6,109 8.6 7.2 4,244 8.6 7.2 120.1 2,402 Source: IndiaNivesh Research IndiaNivesh Research Ajanta Pharma Ltd|Result Update January 29, 2015 | 2 Result Update (contd...) Quarterly results summary Particulars (Rs Mn) Standalone Q3FY15 Q3FY14 Net Sales 3,563 2,926 Consumption of raw material 1,003 Employee Cost y-o-y (%) Q2FY15 9MFY15 9MFY14 7.6 9,683 7,787 9.7 967 3.7 2,773 2,590 7.1 25.5 445 8.2 1,355 1,096 23.7 718 15.2 854 (3.2) 2,427 1,966 23.4 2,312 2,016 14.6 2,266 2.0 6,556 5,652 16.0 1,251 910 37.6 1,046 19.6 3,127 2,136 46.4 126 95 32.7 122 3.2 368 271 36.0 1,125 815 38.1 924 21.8 2,759 1,865 47.9 99 123 (19.4) 208 (52.4) 461 381 21.1 13 (7.7) (34.9) 21.8 3,312 915 482 384 Other Expenditure 827 Total Expenditure EBITDA Depreciation & Amortization EBIT Other Income 12 22 (45.0) 1,212 916 32.4 1,119 Tax 391 272 Adj Net Profit 821 644 Interest Pre-tax Profit y-o-y (%) 24.3 39 60 8.3 3,181 2,186 44.0 345 13.3 998 658 51.7 27.5 774 6.1 2,183 1,528 42.9 27 (20) 12 Net Profit Reported 848 624 35.8 786 Adj EPS (Rs) Equity Capital (face value of Rs 5 each 23.2 18.2 21.9 177 177 27.5 - Q3FY15 Q3FY14 Forex gain (loss) Q-o-Q(%) 45.5 27 (20) 7.8 2,209 1,508 46.5 61.7 43.2 177 6.1 - 177 177 42.9 - Q2FY15 bps 9MFY15 9MFY14 - - Key ratios bps bps Gross margins (%) 71.8 68.7 310 70.8 104 71.4 66.7 461 EBITDA margin (%) 35.1 31.1 403 31.6 354 32.3 27.4 487 Net Margin (%) 23.1 28.2 22.0 31.3 104 (310) 23.4 29.2 (32) Material cost/Net Sales (%) (104) 22.5 28.6 19.6 33.3 (461) Employee Cost/ Net Sales (%) 13.5 13.1 40 13.4 14.0 14.1 (8) 8 293 Other Expenditure/ Net Sales (%) 23.2 24.5 (133) 25.8 (258) 25.1 25.2 (18) Tax Rate (%) 32.3 29.7 259 30.8 143 31.4 30.1 128 Q3FY15 Q3FY14 9MFY15 9MFY14 1,320 290 320 380 230 100 2,230 1,100 1,090 40 3,550 970 210 280 280 130 70 1,950 1,060 870 20 2,920 3,660 900 900 1,110 450 300 5,990 3,140 2,750 100 9,650 2,870 647 754 774 482 213 4,886 2,628 2,156 103 7,756 Sales Breakdown Domestic formulation - Ophthalmology - Dermatology - Cardiology - Institution - Others Emerging market - Africa - Asia - Latam Total y-o-y (%) 36.1 38.1 14.3 35.7 76.9 42.9 14.4 3.8 25.3 100.0 21.6 Q2FY15 1,140 300 260 360 120 100 2,160 1,120 1,010 30 3,300 Q-o-Q(%) 15.8 (3.3) 23.1 5.6 91.7 3.2 (1.8) 7.9 33.3 7.6 y-o-y (%) 27.5 39.1 19.3 43.4 (6.6) 41.1 22.6 19.5 27.6 (2.5) 24.4 Source: Company Filings; IndiaNivesh Research IndiaNivesh Research Ajanta Pharma Ltd|Result Update January 29, 2015 | 3 Result Update (contd...) Therapeutic category-wise composition of domestic formulation sales for the quarter Domestic formulation Region-wise composition of emerging market sales for the quarter Latam 2% Emerging markets Others 8% Ophthalmology 22% Institution 17% Africa 49% Asia 49% Dermatology 24% Cardiology 29% Source: Company Filings; IndiaNivesh Research Source: Company Filings; IndiaNivesh Research Proportion of DF increases sequentially due to lower Anti-malaria sales in Africa EBITDA margin remains on uptrend 50.0 39 DF (as % of total sales) EBITDA margin (%) 44.8 34 31.6 31.1 29.6 40.0 37.1 36.0 29 27.7 27.6 34.8 33.2 35.0 30.0 35.1 34.0 43.0 45.0 31.6 24 22.1 28.5 19 25.0 14 20.0 Q4FY13 Q1FY14 Q2FY14 Q3FY14 Q4FY14 Q1FY15 Q2FY15 Q3FY15 Source: Company Filings; IndiaNivesh Research IndiaNivesh Research Q4FY13 Q1FY14 Q2FY14 Q3FY14 Q4FY14 Q1FY15 Q2FY15 Q3FY15 Source: Company Filings; IndiaNivesh Research Ajanta Pharma Ltd|Result Update January 29, 2015 | 4 Result Update (contd...) Consolidated Financial Statements Income statement Balance sheet Y E March (Rs m) Y E March (Rs m) FY13 FY14 FY15E FY16E Share Capital 118 177 177 177 177 3,816 5,756 8,572 11,650 15,258 3,934 5,933 8,749 11,827 15,434 Long term borrowings 733 523 623 323 323 Deferred Tax liabilities 237 230 230 230 230 25 Net sales Growth % FY13 9,201 38.3% FY14 11,783 28.1% FY15E 14,329 21.6% FY16E 17,159 19.7% FY17E 20,095 17.1% Expenditure Reserves & Surplus FY17E Non Current Liabilities Material Cost 3,026 3,455 4,084 5,062 6,029 Employee cost 1,232 1,570 1,906 2,265 2,813 Other expenses 2,806 3,371 3,668 4,461 5,144 Other long term Liabilities 25 25 25 25 EBITDA 2,138 3,387 4,671 5,371 6,109 Long term Provisions 30 28 28 28 28 Growth % 64.8% 58.4% 37.9% 15.0% 13.7% 1,025 806 906 606 606 EBITDA Margin % 23.2% 28.7% 32.6% 31.3% 30.4% 342 439 468 630 715 EBIT 1,796 2,948 4,203 4,741 5,394 Trade payables EBIT Margin % 18.8% 27.7% 32.1% 30.4% 29.7% Deprecaition Other Income 129 409 482 569 671 Interest 191 87 85 88 88 1,734 3,270 4,601 5,221 5,977 647 960 1,472 1,723 1,733 37.3% 29.4% 32.0% 33.0% 29.0% PBT Tax Effective tax rate % Extraordinary items Current Liabilities Short term borrowings 513 606 606 606 606 1,317 1,245 1,287 1,664 2,065 Other current liabilities 194 476 224 223 281 Short term Provisions 199 427 427 287 343 2,223 2,754 2,543 2,779 3,295 7,182 9,494 12,198 15,213 19,335 2,851 3,729 4,981 5,380 5,871 - - - - - Total Non Current Assets Net Block CWIP 34 29 - - - Non current investment 71 88 88 88 - - - - - Long term loans and advances 85 85 85 85 85 1,087 2,310 3,128 3,498 4,244 486 392 392 507 507 Growth% 32.1% 112.5% 35.4% 11.8% 21.3% 3,492 4,293 5,545 6,060 6,551 PAT margin % 11.8% 19.6% 21.8% 20.4% 21.1% Current Assets Reported PAT 1,121 2,339 3,128 3,498 4,244 Current Investments Inventories 550 550 550 550 1,476 1,554 1,884 2,257 2,643 Sundry Debtors Minority Interest Adjusted PAT Growth% 32.1% 112.5% 35.4% 11.8% 21.3% Other non current assets - 88 1,505 2,022 2,459 2,945 3,449 Cash & bank Balances 462 604 1,324 2,880 5,534 Loans & Advances 240 464 430 515 603 7 6 6 6 6 3,690 5,201 6,653 9,152 12,784 7,182 9,494 12,198 15,213 19,335 Other current Assets Total Key ratios Cash Flow FY14E FY15E FY16E FY17E Y E March FY13 FY14 FY15E FY16E 1,768 3,270 4,601 5,221 5,977 Adj EPS (Rs) 30.8 65.4 88.5 99.0 120.1 Depreciation 342 439 468 630 715 Cash EPS (Rs) 40.4 77.8 101.8 116.8 140.3 Interest 191 87 5 11 Y E March (Rs m) PBT FY13 Other non cash charges 85 - 88 - FY17E 88 DPS (Rs) 2.9 10.0 8.9 11.9 18.0 - BVPS 111 168 248 335 437 Changes in working capital 385 (745) (944) (823) (463) Tax (331) (937) (1,472) (1,723) (1,733) ROCE 15.7% 21.9% 23.4% 20.9% 19.8% 2,124 2,737 3,394 4,584 ROE 27.6% 38.9% 35.8% 29.6% 27.5% (1,348) (1,720) (1,030) (1,206) 1,018 2,365 3,378 - - - Cash flow from operations 2,360 Capital expenditure Free Cash Flow (912) 1,448 Other income (141) CWIP Cash flow from investments 776 (530) - - - - - (1,053) (1,878) (1,720) (1,030) (1,206) (748) 57 100 (300) 48 63 Trades Payable days 159 132 115 120 125 22.3 41.0 30.3 27.1 16.0 10.8 8.0 6.1 P/CEPS (x) 66.3 34.5 26.3 23.0 19.1 EV/EBITDA (x) 44.7 28.1 20.3 17.3 14.8 Dividend Yield % 0.1% 0.4% 0.3% 0.4% 0.7% 4.7 (87) (85) (88) (88) (171) (313) (420) (637) Inc from other investments (808) 63 87.2 (195) (298) 48 63 24.1 (102) (201) 48 63 P/BV (x) Interest paid (1,045) 48 60 PER (x) Dividend paid (incl tax) Cash flow from Financing 59 Sundry Debtors Days - Equity capital raised Loans availed or (repaid) Inventories Days (725) Net change in cash 262 45 720 1,557 2,654 m cap/sales (x) 10.3 8.0 6.6 5.5 Cash at the beginning of the year 115 462 604 1,324 2,880 net debt/equity (x) 0.3 0.2 0.1 0.1 0.1 85 97 net debt/ebitda (x) 0.4 0.2 0.0 -0.4 -0.8 462 604 Adjusted cash Cash at the end of the year 1,324 2,880 5,534 Source: Company Filings; IndiaNivesh Research IndiaNivesh Research Ajanta Pharma Ltd|Result Update January 29, 2015 | 5 Result Update January 29, 2015 Lumax Auto Technologies Ltd. In line with our expectation Current Previous CMP : Rs.359 Rating : BUY Rating : BUY Target : Rs.575 Target : Rs.575 STOCK INFO BSE NSE Bloomberg Reuters Sector Face Value (Re) Equity Capital (Rs Mn) Mkt Cap (Rs Mn) 52w H/L (Rs) Avg Daily Vol (BSE+NSE) 532796 LUMAXTECH LUAT.BO LMAX IN Auto Ancilliary 10 136 4,894 386/91 29,239 SHAREHOLDING PATTERN % (as on Sep. 2014) Institutions Others, Incl Public Promoters 14.28 30.05 55.67 Source: BSE STOCK PERFORMANCE (%) 1m LATL 17 SENSEX 9 3m 45 11 12m 263 43 Source: Capitaline, IndiaNivesh Research LATL v/s SENSEX 400.00 360.00 320.00 280.00 240.00 200.00 160.00 120.00 LATL Sensex Source: Capitaline, IndiaNivesh Research Daljeet S. Kohli Head of Research Tel: +91 22 66188826 [email protected] Abhishek Jain Research Analyst Tel: +91 22 66188832 [email protected] IndiaNivesh Research 26/01/2015 12/01/2015 29/12/2014 15/12/2014 01/12/2014 17/11/2014 03/11/2014 20/10/2014 06/10/2014 22/09/2014 08/09/2014 25/08/2014 11/08/2014 28/07/2014 14/07/2014 30/06/2014 16/06/2014 02/06/2014 19/05/2014 05/05/2014 21/04/2014 07/04/2014 24/03/2014 10/03/2014 24/02/2014 10/02/2014 27/01/2014 80.00 Lumax Auto technologies (LATL) reported Q3 FY15 numbers in line with our expectation. The company witnessed 9% YoY and 1% QoQ growth in the revenue to Rs 2.09 bn (in line with our expectation of Rs 2.04 bn) due to higher volume. On operational front, EBITDA margin expanded 101 bps YoY to 8.4 due to lower raw material expenses. Net profit increased by 30% YoY to Rs 83 mn, slightly lower than our expectation of Rs. 85 mn due to higher interest expenses. Rs.mn Revenue EBIDTA PAT Adjusted PAT Q3FY15 2093 177 83 83 Q2FY15 2197 186 91 91 Q3FY14 Q‐o‐Q % Y‐o‐Y % INSPL Q3FY15e 1929 -5 9 2,045 144 -4 23 179 64 -10 30 85 64 -10 30 85 Variance(%) 2.36 -0.98 -2.86 -2.86 Source: Company Filings; IndiaNivesh Research We have seen a 11 percent rise in top-line in 9MFY15, Q3FY15 was little subdued compared to the first two quarters mainly because of the less number of working days as company undertakes annual maintenance shut down in December. However Q4FY15 should be much stronger growth compared to the initial quarters. So, we expect 14.5% growth in revenue for the whole year. With comfortable debt to equity of just 0.2x & strong ROE of ~22% we believe the company has potential to yield very high returns in next 2-3 years. The company has a consistent dividend track record with dividend payout of above 25%. At CMP of Rs 359, LATL is trading at 8.60x FY16e and 6.2x FY17e EPS. We find current valuation attractive and maintain BUY rating on LATL with target price of Rs. 575 (10x FY17E EPS). Quick Fundamentals (Rs. Mn) Revenue Other Operating Income Total Income Cost of Revenues Raw Materials Other Expenditure Employee Expenses EBIDTA Depreciation EBIT Interest Expense Other income Exceptional item PBT Provision for taxation PAT Adjusted PAT EPS (RS.) Margin % EBITDA EBIT PBT PAT Q3FY15 2,093 22 2,115 1,938 1,549 214 174 177 51 126 13 8 Q2FY15 2,197 21 2,218 2,032 1,637 218 174 186 51 134 12 10 121 39 83 83 6.07 132 41 91 91 6.72 8.4 6.0 5.7 3.9 8.4 6.1 6.0 4.1 Q3FY14 QoQ % YoY % 1,929 ‐5 9 18 3 21 1,947 ‐5 9 1,804 -5 7 1,460 -5 6 185 -2 16 159 0 10 144 ‐4 23 48 0 6 95 -6 33 9 10 51 5 -16 65 91 28 64 64 4.68 7.4 4.9 4.7 3.3 -8 -5 ‐10 ‐10 32 39 30 30 Basis Points (BPS) 2 101 -9 108 -23 103 -22 63 9MFY15 6,258 62 6,320 5,798 4,655 635 507 522 155 368 39 34 214 577 165 413 199 14.64 9MFY14 5,615 48 5,663 5,241 4,278 525 438 421 126 296 21 23 YoY% 11 30 12 11 9 21 16 24 23 24 82 48 298 89 209 209 15.34 8.3 5.8 9.1 6.5 7.4 5.2 5.3 3.7 94 85 98 ‐5 ‐5 BPS 83 60 388 285 Source: Company Filings; IndiaNivesh Research IndiaNivesh Securities Private Limited 601 & 602, Sukh Sagar, N. S. Patkar Marg, Girgaum Chowpatty, Mumbai 400 007. Tel: (022) 66188800 IndiaNivesh Research is also available on Bloomberg INNS, Thomson First Call, Reuters and Factiva INDNIV. Result Update (contd...) Raw material prices decreased 167 bps YoY (as a percentage of revenue) to 74% from 75.7% in Q3 FY14. Staff cost increased by 11 bps YoY to 8.3% (as a percentage of revenue) and other expenditure increased by 65 bps YoY to 10.2% (as a percentage of revenue). Cost Analysis (% of Revenue) Raw Materials (Adj.) Employee Expenses Other Expenses Q3FY15 74.0% 8.3% 10.2% Q2FY15 74.5% 7.9% 9.9% Q3FY14 bps QoQ bps YoY 75.7% -52 -167 8.2% 39 11 9.6% 32 65 9MFY15 9MFY14 Change in bps 74.4% 76.2% -181 8.1% 7.8% 30 10.1% 9.3% 80 Source: Company Filings; IndiaNivesh Research Investment rationale Lighting business, technology up gradation and innovation are the key factor of growth On consolidated basis ~36% of revenue of LATL comes from lighting products, which have become an integral part of vehicle. Styling & design of lamp is being upgraded continuously to enhance the appeal of the vehicle. Further, OEMs now demand lower wattage & higher luminosity lamps to save energy which has made these products more technologically advanced. The company has been beefing up its in-house product development capability to be self reliant & at par with evolving global light technologies. LATL has also been strengthening its design & development team to handle the increasing demand of OEMs for new products in the shortest lead time. We believe the company’s competitive strength & proven track record will help LATL in garnering large part of business share from OEM in their (OEMs) new launches & maintain its dominant position. Lumax Industries, Autolite and Phoenix Lamps are the other key player in the lighting business. We expect revenue from lighting business to grow at CAGR of 12.3% from FY14-FY17e. Further, Lumax Auto-technology has diversified into LED (Automotive and infrastructure both) lighting businesses, which we believe will be the new growth driver. LED lighting would have much higher realization than traditional lightings; this will lead to strong growth in top line. Lighting business revenue and Growth 15 4000 3500 10 3000 Rs Mn 2500 5 2000 0 1500 1000 -5 500 2903 2713 2984 3342 3744 FY13 FY14 FY15e FY16e FY17e -10 0 Revenue growth (%) Source: Company Filings; IndiaNivesh Research Automatic gears shifter game changer for the company IndiaNivesh Research Lumax produces manual automated gear shift (AGS) for different clients, however the company has started to produce automatic gear shifter. Automatic transmission cars are slowly catching the imagination of masses. At present they account for less than 5% of the total vehicles and is expected to increase at an alarming rate in the near future. An example would be phenomenal success of Maruti Suzuki’s Celerio. Maruti has two models having auto gear shift variants & also launched Alto K10, the country’s cheapest small car with automated gear shift (AGS) technology. Tata Motors might Lumax Auto Technologies Ltd. January 29, 2015| 2 Result Update (contd...) soon come out with automatic variants of its upcoming hatchback Bolt and compact sedan Zest. In order to speed the Automatic Gear Shift lever business, LATL has signed a joint venture(55:45) agreement with Japan’s Mannoh Industrial Co Ltd to design and manufacture complete gear shift lever systems for manual, automatic, AMT & CVT transmissions in India. Recently the company has sold 45% stake of LMAT to Mannoh Industrial Co, Ltd, Japan.Mannoh, a technology leader in automatic, AMT, CVT and MT type gear shift lever assemblies, will provide complete local designing & testing capability in India through its R&D centre located at Manesar, Gurgaon. Key clients of Japan’s Mannoh Industrial Co Ltd are Toyota Motor Co., Ltd., Hino Motors Ltd., Daihatsu Motor Co., Ltd., Honda Motor Co., Ltd., Mitsubishi Motors Corp., Isuzu Motors Ltd., Mazda Motor Corporation, Fuji Heavy Industries Co., Ltd. LATL is in agreement to supply for Automatic Gear Shift . We expect revenue from Gears shifter business to grow at CAGR of 30% from FY14FY17e on the back of entry in automatic gear product. Revenue from Gear shifter business 600 500 Rs Mn 400 300 200 100 480 245 319 414 538 FY13 FY14 FY15e FY16e FY17e 0 Revenue Source: Company Filings; IndiaNivesh Research Air intake system is a growing business- In 2-3 years business will be sizeable Another JV in equal proportion with Italy based Cornagila christened Lumax Cornagiia Auto Tech (LCAT) is supplying Air Intake System (AIS) to leading automobile manufactures in India like TATA, FIAT, VOLKSWAGEN, SKODA & General Motors. The air intake ensures the optimal filling of the engine cylinders with a suitable mass of comburent consisting of fresh air and recirculated exhaust gases. The intake manifold also carries out the function of integrating other engine supply control functions: fuel supply, fuel anti-evaporation system control, and engine operation point control. Hence, the air intake manifold can also carry out the function of engine supply mechatronic module, with the following advantages: compact size, cost, and assembly on the engine. We expect revenue from Air Intake business to grow at CAGR of 63% from FY14-FY17e. Revenue from Air Intake System 600 500 Rs Mn 400 300 200 100 106 127 FY13 FY14 191 324 551 FY15e FY16e FY17e 0 Revenue Source: Company Filings; IndiaNivesh Research IndiaNivesh Research Lumax Auto Technologies Ltd. January 29, 2015| 3 Result Update (contd...) Margin to expand to 11% by FY17e on the back of high operating leverage and value added products With strong volume growth expectations in automotive industry the next couple of years, we expect robust margin expansion. We expect LATL margins to gradually improve in coming quarters led by high operating leverage and value added products. 1600 11.0 1400 11 10.0 10 8.8 1000 8.7 9 7.9 800 8 600 7 400 6 200 0 5 FY13 FY14 EBITDA FY15e FY16e Growth in percentage EBITDA( Rs. mn) 1200 12 FY17e EBITDA Margin % Source: Company Filings; IndiaNivesh Research The company’s manufacturing facility is presently operating in two shifts and capacity utilization stand at 60 to 70 percent. From here on we expect capacity utilization to increase to 80- 85 percent by FY16E. Thus higher operating leverage would help in expansion of margin. We expect margins to gradually improve to 11% by FY17E vs. 7.9% margin in FY14. Valuation We expect company to witness strong volume growth coupled with margin expansion in the next couple of years on the back of revival in automotive demand and value added products. With comfortable debt to equity of just 0.2x & strong ROE of ~22% we believe the company has potential to yield very high returns in next 2-3 years. The company has a consistent dividend track record with dividend payout of above 25%. At CMP of Rs 359, LATL is trading at 8.60x FY16e and 6.2x FY17e EPS. We find current valuation attractive and maintain BUY rating on LATL with target price of Rs. 575 (10x FY17E EPS). IndiaNivesh Research Lumax Auto Technologies Ltd. January 29, 2015| 4 Result Update (contd...) Consolidated Financials Income Statement Balance Sheet Y E March (Rs m) FY13 FY14 FY15e FY16e FY17e Y E March (Rs m) Net sales 7,663 7,628 8,732 10,285 12,298 Share Capital Y/Y Ch % 2.1 ‐0.5 14.5 17.8 19.6 COGS 6,688 6,679 7,606 8,845 10,453 SG&A 304 344 367 411 492 EBITDA 672 605 760 1,028 1,353 Y/Y Ch % 4.2 ‐9.9 25.5 35.4 31.5 11.0 EBITDA Margin % FY13 FY14 FY15e FY16e 136 136 136 136 136 Reserves & Surplus 1,977 2,123 2,429 2,871 3,482 Net Worth 2,113 2,260 2,566 3,007 3,618 0 0 0 0 0 274 524 554 504 454 Minority Long-term + ST loans Others FY17e 49 54 54 54 54 Total Liabilities 2,436 2,837 3,173 3,565 4,126 4,962 8.8 7.9 8.7 10.0 Deprecaition 108 176 196 205 214 EBIT 564 429 563 823 1,138 Gross Block 3,841 4,362 4,562 4,762 7.4 5.6 6.5 8.0 9.3 Less Depreciation 1,835 2,011 2,207 2,413 2,627 6 38 44 48 53 Net Block 2,006 2,351 2,355 2,350 2,335 50 Intangible Investments 348 194 240 194 240 194 240 194 240 194 Defered tax (net) -101 -144 -144 -144 -144 EBIT Margin % Interest Other Income (Inc Forex) 37 38 41 46 Extra Ordinary Exps/(Income) - - - - PBT 594 429 561 820 1,135 Tax 183 127 168 254 352 Effective tax rate % 30.9 29.6 30.0 31.0 31.0 Current Assets 1,781 1,949 2,442 3,180 4,157 1,286 1,321 1,454 1,724 2,022 Reported PAT Y/Y Ch % - 411 302 393 566 783 Sundry Debtors ‐19.0 ‐26.4 29.9 44.2 38.4 Cash & Bank Balance Minority & Exceptional - - - - - Adj. PAT (APAT) 411 302 393 566 783 RPAT Margin % Y/Y Ch % 5.4 4.0 4.5 5.5 6.4 ‐19.0 ‐26.4 29.9 44.2 38.4 98 139 470 846 1432 Loans & advances 108 143 123 144 148 Inventories 288 346 395 465 556 2,325 Current Liabilities 1,607 1,514 1,680 1,972 Provisions 184 239 235 282 332 Net Current Assets -10 195 528 925 1,500 2,436 2,837 3,173 3,565 4,126 Total assets Key Ratios Cash Flow Y E March (Rs m) Operaing Profit Depreciation Interest Exp FY13 564 108 -6 FY14 FY15e 429 563 176 196 -38 -44 FY16e 823 205 -48 FY17e Y E March FY13 FY14 FY15e FY16e FY17e 1,138 Adj.EPS (Rs) 30.1 22.2 28.8 41.5 57.5 214 Cash EPS (Rs) 38.1 35.1 43.2 56.6 73.2 -53 DPS (Rs) 6.0 6.0 6.0 6.0 6.0 BVPS 155.0 165.8 188.2 220.6 265.5 Changes in Working Capital 208 -79 40 25 14 Cash Flow After Chang in WCapital 874 488 756 1,005 1,314 ROCE % 23.9 16.8 19.5 24.8 29.3 -352 ROE % 19.4 13.4 15.3 18.8 21.7 ROIC % 13.5 7.8 9.7 12.4 15.9 8.8 7.9 8.7 10.0 11.0 Tax Others Cash flow from operations Capital expenditure (net) Free Cash Flow Cash flow from investments -183 -127 -168 -254 0 0 0 0 0 691 361 588 751 962 EBITDA Margin % -1,111 -414 -200 -200 -200 PER (x) 11.9x 16.2x 12.5x 8.6x 6.2x -420 -53 388 551 762 P/BV (x) 2.3x 2.2x 1.9x 1.6x 1.4x P/CEPS (x) 9.4x 10.2x 8.3x 6.3x 4.9x EV/EBITDA (x) 4.0x 4.2x 6.6x 4.4x 2.9x Dividend payout % 19.9 27.1 20.8 14.4 10.4 m cap/sales (x) 0.3x 0.3x 0.6x 0.5x 0.4x -0.3x -1,111 -414 -200 -200 -200 Long-Term Debt (Decrease) Increase 257 249 30 -50 -50 Dividend paid (incl tax) -82 -82 -86 -125 -126 net debt/equity (x) 0.1x 0.2x 0.0x -0.1x net debt/ebitda (x) -44 -74 0 0 0 0.3x 0.6x 0.1x -0.3x -0.7x Cash flow from Financing 132 94 -56 -175 -176 Debtors (Days) 60 62 61 61 60.0x Net change in cash -288 41 332 376 585 Creditors (Days) 75 71 70 70 69 846 Inventory (Days) 14 17 17 17 17 Cash Conversion Cycle (Days) -1 7 7 8 8 Share Issue / Repurchase & Others Cash at the beginning of the year Cash at the end of the year 386 98 98 139 139 470 470 846 1,432 Source: Company Filings; IndiaNivesh Research IndiaNivesh Research Lumax Auto Technologies Ltd. January 29, 2015| 5 Result Update Alstom T&D India Ltd. January 29, 2015 Unexpectedly Disappointing Performance Current Highlights: Previous CMP : Rs.538 Rating : SELL Rating : HOLD Target : Rs.444 Target : Rs.444 STOCK INFO BSE 522275 NSE ALSTOMT&D Bloomberg ATD IN Reuters ALST.NS Sector Heavy Electrical Equipment Index S&P BSE 500 Face Value(Rs) 2 Equity Capital(Rs mn) 512 Mkt Cap(Rs mn) 136,473 52w H/L 565/170 3m Avg Daily Volume(BSE+NSE) 186,217 Alstom T&D India reported disappointing set of numbers for Q3FY15. Despite of large order book of Rs ~79 bn, company top-line has reported 9.7% y-o-y de-growth to Rs 7,661 mn. EBITDA margin of 5.3% reported in Q3FY15 is at multi-quarters low, which can be compared with 4.3% EBITDA margin reported in Q2FY13. Company has been maintaining double digit EBIDTA margins since Q4FY14; this streak was broken in Q3FY15 by huge variance. Company EBITDA has declined by 43.9% to Rs 405 mn, mainly on account of higher material/project costs and other expense. Net profit of the company declined by 86.4% to Rs 26 mn, led by fixed costs like depreciation (Rs 220 mn) and finance cost (Rs 149 mn). Taking into consideration the highly unexpected negative result for the quarter, we’ll introduce FY17E numbers post the concall which is scheduled on 3rd Feb, 2015. Stock has run-up in last few days from Rs 470 to Rs 538, which is at FY16E PE multiple of 36.3x. Taking notice of abrupt negative performance in Q3FY15, we change the rating from HOLD to SELL. We’ve valued the stock conservatively with TP of Rs 444 (Implied PE 30x FY16E). This is tactical SELL rating on stock as we remain positive on the long term growth story of the company. Rs mn SHAREHOLDING PATTERN % (as on Dec. 2014) Promoters FIIs DIIs Public & Others 75.00 1.37 14.97 8.66 Q3FY15 Q3FY14 Q2FY15 Y‐o‐Y Q‐o‐Q 7,661 405 26 0.10 5.3% 0.3% 8,483 722 189 0.74 8.5% 2.2% 9,137 938 355 1.39 10.3% 3.9% ‐9.7% ‐43.9% ‐86.4% ‐86.4% ‐323 ‐189 ‐16.2% ‐56.9% ‐92.7% ‐92.7% ‐498 ‐355 Net Revenue EBITDA Net Profit EPS (Rs) EBITDA margin % Net margin % INSPL Estimate 9,690 1,026 393 1.53 10.6% 4.1% Variance % ‐20.9% ‐60.6% ‐93.4% ‐93.4% ‐531 ‐371 Standalone, Source: Company, IndiaNivesh Research Source: BSE STOCK PERFORMANCE (%) 1m 3m 12m ALSTOM T&D 14.34 43.70 184.91 SENSEX 8.55 10.53 42.80 Source: Capitaline, IndiaNivesh Research ALSTOM T&D v/s SENSEX 300 250 Revenue disappointment despite of large order book: In Q3FY15, Alstom T&D India top-line has shown de-growth of 9.7% y-o-y and 16.2% q-o-q to Rs 7,661 mn. This large drop in top-line has come in-spite of company having highest ever order backlog of Rs ~79 bn. In our opinion this de-growth could be due two possible factors 1) Slower execution of current projects or 2) Delay in revenue recognition of some projects in Q3FY15, which can be covered up in Q4FY15E. On a 9-month basis, Company top-line has increased marginally by 4.5% to Rs 23,531 mn in 9MFY15. 200 150 100 Net Revenue (Rs mn) and EBITDA margin (%): Tel: +91 22 66188826 [email protected] Rahul Koli Research Associate Tel: +91 22 66188833 [email protected] IndiaNivesh Research 10.0% 8,483 5,858 11.4% 10.3% 9,137 6,733 7,129 7,661 Net Revenue (Rs mn) 12% 10% 8% 6% 4% 2% 0% Q3FY15 Q2FY15 Q1FY15 5.3% Q4FY14 4.3% 8.5% Q3FY14 Daljeet S. Kohli Head of Research 10.2% 6,830 13,130 9.3% 8,168 Q2FY14 Source: Capitaline, IndiaNivesh Research 7.5% 10.3% Q1FY14 Sensex 10,958 Q4FY13 Alstom T&D 14,000 12,000 10,000 8,000 6,000 4,000 2,000 ‐ Q3FY13 ‐ Q2FY13 50 EBITDA margin % Source: Company; IndiaNivesh Research Abrupt break in streak of double digit EBITDA margin: EBITDA margin of 5.3% reported in Q3FY15 is at multi-quarters low, which can be compared with 4.3% EBITDA margin reported in Q2FY13. Company has been maintaining double digit EBIDTA margins since Q4FY14; this streak was broken in Q3FY15 by huge variance. Employee cost and other expenses have increased by IndiaNivesh Securities Private Limited 601 & 602, Sukh Sagar, N. S. Patkar Marg, Girgaum Chowpatty, Mumbai 400 007. Tel: (022) 66188800 IndiaNivesh Research is also available on Bloomberg INNS, Thomson First Call, Reuters and Factiva INDNIV. Result Update (contd...) 149 bps and 211 bps respectively (y-o-y basis), whereas material cost has remain stable. Consequently EBITDA margin decline by 326 bps y-o-y. On q-o-q basis material cost has jumped sharply by 369 bps and employee cost has gone up by 235 bps. This resulted in q-o-q EBITDA margin contraction by 498 bps to 5.3%. Finance cost of the company has declined by 35.3% y-o-y and 29.6% q-o-q to Rs 149 mn, which reflects possible decline in debt of the company. For the 9-month-FY15, EBITDA margin has declined by 30 bps to 9%. EBITDA for 9MFY15 has shown marginal growth of 1.2% to Rs 2,108 mn. net profit for 9MFY15, has increased substantially by 21.5% to Rs 665 mn reflecting 1) lower depreciation cost of Rs 605 mn, down 6.6% y-o-y and 2) 21.1% decline in finance cost to Rs 502 mn. Cost Analysis: Rs mn Material and Project cost as % of net revenue Employee benefit expense as % of net revenue Other expenses as % of net revenue EBITDA EBITDA Margin % Other Income Depreciation as % of EBITDA EBIT EBIT margin % Q3FY15 5,283 69.0% 863 11.3% 1,110 14.5% 405 5.3% 4 220 54.5% 188 2.5% Q3FY14 Q2FY15 5,882 5,964 69.3% 65.3% 829 815 9.8% 8.9% 1,050 1,420 12.4% 15.5% 722 938 8.5% 10.3% 20 1 225 191 31.2% 20.3% 517 749 6.1% 8.2% Y‐o‐Y ‐10.2% ‐37 4.1% 149 5.7% 211 ‐43.9% ‐323 ‐81.1% ‐2.0% 2,330 ‐63.6% ‐364 Q‐o‐Q 9MFY15 9MFY14 ‐11.4% 15,299 14,607 369 65.0% 64.9% 5.9% 2,520 2,519 235 10.7% 11.2% ‐21.8% 3,604 3,299 ‐105 15.3% 14.7% ‐56.9% 2,108 2,084 ‐498 9.0% 9.3% 192.3% 7 31 15.7% 605 648 3,416 28.7% 31.1% ‐74.9% 1,510 1,467 ‐574 6.4% 6.5% Y‐o‐Y 4.7% 12 0.0% ‐48 9.2% 66 1.2% ‐30 0.0% ‐6.6% ‐240 3.0% ‐10 Source: Company, IndiaNivesh Research Valuation and Outlook: In addition to acquisition of newer orders, execution of in-hand order book and retention/expansion of margin remains key concern for the companies in capital goods sector. Alstom T&D has won many new orders in past quarters due to which it now has the highest ever order book of Rs ~79 bn. More details on the performance of the Q3FY15 will be available after the concall of the company. Taking into consideration the unexpected negative result for the quarter, we’ll introduce FY17E numbers post the concall which is scheduled on 3rd Feb, 2015. Stock has run-up in last few days from Rs 470 to Rs 538, which is at FY16E PE multiple of 36.3x. Taking notice of abrupt negative performance in Q3FY15, we change the rating from HOLD to SELL. We’ve valued the stock conservatively with TP of Rs 444 (Implied PE 30x FY16E). This is tactical SELL rating on stock as we remain positive on the long term growth story of the company. IndiaNivesh Research Alstom T&D India Ltd.|Result Update January 29, 2015 | 2 Result Update (contd...) Rs mn Net Income from operations Other Operating Income Total Income from operations Expenses: Materials and related cost Changes in inventories etc Material costs as % of net revenue Employee benefit expense Other expenses EBITDA EBITDA Margin % Other Income Depreciation EBIT EBIT margin % Finance Cost Exceptional Item PBT Tax expense Effective tax rate % Net Profit Net Profit margin % EPS (Rs) Q3FY15 7,630 31 7,661 Q3FY14 8,472 12 8,483 Q2FY15 9,076 61 9,137 5,822 -539 5,283 69.0% 863 1,110 405 5.3% 4 220 188 2.5% 149 39 14 34.4% 26 0.3% 0.10 5,587 295 5,882 69.3% 829 1,050 722 8.5% 20 225 517 6.1% 230 287 97 34.0% 189 2.2% 0.74 6,384 -420 5,964 65.3% 815 1,420 938 10.3% 1 191 749 8.2% 211 538 183 34.0% 355 3.9% 1.39 Y‐o‐Y ‐9.9% 169.7% ‐9.7% Q‐o‐Q 9MFY15 9MFY14 ‐15.9% 23,417 22,090 ‐48.8% 113 419 ‐16.2% 23,531 22,509 ‐10.2% ‐37 4.1% 5.7% ‐43.9% ‐323 ‐81.1% ‐2.0% ‐63.6% ‐364 ‐35.3% ‐11.4% 369 5.9% ‐21.8% ‐56.9% ‐498 192.3% 15.7% ‐74.9% ‐574 ‐29.6% ‐86.3% ‐92.7% ‐86.4% ‐190 ‐86.4% ‐92.7% ‐355 ‐92.7% 17,074 -1,776 15,299 65.0% 2,520 3,604 2,108 9.0% 7 605 1,510 6.4% 502 1,008 343 34.0% 665 2.8% 2.60 15,525 -919 14,607 64.9% 2,519 3,299 2,084 9.3% 31 648 1,467 6.5% 637 830 282 34.0% 548 2.4% 2.14 Y/Y 6.0% ‐73.0% 4.5% 4.7% 12 0.0% 9.2% 1.2% ‐30 ‐6.6% 3.0% ‐10 ‐21.1% 21.5% 21.5% 39 21.5% Standalone, Source: Company, India Nivesh Res earch IndiaNivesh Research Alstom T&D India Ltd.|Result Update January 29, 2015 | 3 Global Markets - Outlook Dharmesh Kant VP Strategies & Fund Manager (PMS) Mobile: +91 77383 93372 Tel: +91 22 66188890 [email protected] Global Market Update US Markets: U.S. stocks ended Wednesday’s choppy trading session sharply lower after the Federal Reserve’s policy-making committee reiterated it plans to remain patient and watch the data as it decides when to raise interest rates. Sharp losses added to declines from Tuesday, when markets sold off after disappointing earnings and economic data. A renewed slide in oil prices Wednesday sent energy and materials stocks sharply lower. The Fed gave no sign that it is wavering on hiking interest rates some time in the second half of 2015. The U.S. central bank was upbeat about the economy, while the policy makers repeated that they think inflation will move back to the 2% target after being pushed down by temporary factors. Day’s Performance: The S&P 500 closed 27.39 points, or 1.4%, lower at 2,002.23, with all 10 main sectors finishing in the red. The energy sector fell 3.9%, as oil fell to lowest levels since March 2009. The Dow Jones Industrial Average dropped 195.84 points, or 1.1%, to 17,191.37, with 27 of its 30 components ending lower. The Nasdaq Composite turned a big opening advance into a loss by the end of the session, falling 43.50 points, or 0.9%, to 4,637.99. Set ups on S&P 500, Dow Industrial Average and Nasdaq 100 are undergoing a pull back while set ups still look weak where sell on pull backs is advocated. We remain cautious on US markets, expecting a correction to 1900 levels on S&P 500. Emerging markets: Most of Asian stocks are trading with minor cuts this morning on weak global cues. Bullions & Commodities: Gold is trading at $1282 per troy ounce this morning down (0.40%) from previous close. WTI Crude future is trading at 44.46 per barrel while Brent Crude future is trading at $48.60 per barrel. Currencies: The U.S. Dollar Index tracking the U.S. currency against a basket of six others currencies trading at 94.62 this morning down (0.01%) from previous close. Long term set ups up on Dollar Index are looking strong. Our target of 89 has been achieved. The dollar and U.S. stocks often trade on opposite paths, with a weak dollar seen as providing investors with cheap funding to buy stocks. Plus the dollar’s drop generally helps U.S. companies’ overseas sales. Source: Bloomberg IndiaNivesh Research NiveshDaily January 29, 2015 | 5 Disclaimer: This document has been prepared by IndiaNivesh Securities Private Limited (“INSPL”), for use by the recipient as information only and is not for circulation or public distribution. INSPL includes subsidiaries, group and associate companies, promoters, employees and affiliates. INSPL researches, aggregates and faithfully reproduces information available in public domain and other sources, considered to be reliable and makes them available for the recipient, though its accuracy or completeness has not been verified by INSPL independently and cannot be guaranteed. The third party research material included in this document does not represent the views of INSPL and/or its officers, employees and the recipient must exercise independent judgement with regard to such content. This document has been published in accordance with the provisions of Regulation 18 of the Securities and Exchange Board of India (Research Analysts) Regulations, 2014. This document is not to be altered, transmitted, reproduced, copied, redistributed, uploaded or published or made available to others, in any form, in whole or in part, for any purpose without prior written permission from INSPL. This document is solely for information purpose and should not to be construed as an offer to sell or the solicitation of an offer to buy any security. Recipients of this document should be aware that past performance is not necessarily a guide for future performance and price and value of investments can go up or down. The suitability or otherwise of any investments will depend upon the recipients particular circumstances. INSPL does not take responsibility thereof. The research analysts of INSPL have adhered to the code of conduct under Regulation 24 (2) of the Securities and Exchange Board of India (Research Analysts) Regulations, 2014. This document is based on technical and derivative analysis center on studying charts of a stock’s price movement, outstanding positions and trading volume, as opposed to focusing on a company’s fundamentals and, as such, may not match with a report on a company’s fundamentals. Nothing in this document constitutes investment, legal, accounting and/or tax advice or a representation that any investment or strategy is suitable or appropriate to recipients’ specific circumstances. INSPL does not accept any responsibility or whatever nature for the information, assurances, statements and opinion given, made available or expressed herein or for any omission or for any liability arising from the use of this document. Opinions expressed are our current opinions as of the date appearing on this document only. The opinions are subject to change without any notice. INSPL directors/employees and its clients may have holdings in the stocks mentioned in the document. This report is based / focused on fundamentals of the Company and forward-looking statements as such, may not match with a report on a company’s technical analysis report Each of the analysts named below hereby certifies that, with respect to each subject company and its securities for which the analyst is responsible in this report, (1) all of the views expressed in this report accurately reflect his or her personal views about the subject companies and securities, and (2) no part of his or her compensation was, is, or will be, directly or indirectly, related to the specific recommendations or views expressed in this report: Daljeet S Kohli, Amar Maurya, Abhishek Jain, Yogesh Hotwani, Prerna Jhunjhunwala, Kaushal Patel, Rahul Koli, Tushar Manudhane & Dharmesh Kant. Following table contains the disclosure of interest in order to adhere to utmost transparency in the matter: Disclosure of Interest Statement 1. Details of business activity of IndiaNivesh Securities Private Limited (INSPL) INSPL is a Stock Broker registered with BSE, NSE and MCX - SX in all the major segments viz. Cash, F & O and CDS segments. INSPL is also a Depository Participant and registered with both Depository viz. CDSL and NSDL. Further, INSPL is a Registered Portfolio Manager and is registered with SEBI. 2. Details of Disciplinary History of INSPL No disciplinary action is / was running / initiated against INSPL 3. Details of Associates of INSPL Please refer to the important 'Stock Holding Disclosure' report on the IndiaNivesh website (investment Research Section - http://www.indianivesh.in/Research/Holding_Disclosure.aspx?id=10- link). Also, please refer to the latest update on respective stocks for the disclosure status in respect of those stocks. INSPL and its affiliates may have investment positions in the stocks recommended in this report. 4. Research analyst or INSPL or its relatives'/associates' financial interest in the subject No (except to the extent of shares held by Research analyst or INSPL or its relatives'/associates') company and nature of such financial interest 5. Research analyst or INSPL or its relatives'/associates' actual/beneficial ownership of 1% or more Please refer to the important 'Stock Holding Disclosure' report on the IndiaNivesh website (investment in securities of the subject company, at the end of the month immediately preceding the date Research Section - http://www.indianivesh.in/Research/Holding_Disclosure.aspx?id=10- link). of publication of the document. Also, please refer to the latest update on respective stocks for the disclosure status in respect of those stocks. INSPL and its affiliates may have investment positions in the stocks recommended in this report. 6. Research analyst or INSPL or its relatives'/associates' any other material conflict of interest at the time of publication of the document No 7. Has research analyst or INSPL or its associates received any compensation from the subject company in the past 12 months No 8. Has research analyst or INSPL or its associates managed or co-managed public offering of securities for the subject company in the past 12 months No 9. Has research analyst or INSPL or its associates received any compensation for investment banking or merchant banking or brokerage services from the subject company in the past 12 months No 10. Has research analyst or INSPL or its associates received any compensation for products or services other than investment banking or merchant banking or brokerage services from the subject company in the past 12 months No 11. Has research analyst or INSPL or its associates received any compensation or other benefits from the subject company or third party in connection with the document. No 12. Has research analyst served as an officer, director or employee of the subject company No 13. Has research analyst or INSPL engaged in market making activity for the subject company No 14. Other disclosures No INSPL, its affiliates, directors, its proprietary trading and investment businesses may, from time to time, make investment decisions that are inconsistent with or contradictory to the recommendations expressed herein. The views contained in this document are those of the analyst, and the company may or may not subscribe to all the views expressed within. This information is subject to change, as per applicable law, without any prior notice. INSPL reserves the right to make modifications and alternations to this statement, as may be required, from time to time. Definitions of ratings BUY. We expect this stock to deliver more than 15% returns over the next 12 months. HOLD. We expect this stock to deliver -15% to +15% returns over the next 12 months. SELL. We expect this stock to deliver <-15% returns over the next 12 months. Our target prices are on a 12-month horizon basis. Other definitions NR = Not Rated. The investment rating and target price, if any, have been arrived at due to certain circumstances not in control of INSPL CS = Coverage Suspended. INSPL has suspended coverage of this company. UR=Under Review. Such e invest review happens when any developments have already occurred or likely to occur in target company & INSPL analyst is waiting for some more information to draw conclusion on rating/target. NA = Not Available or Not Applicable. The information is not available for display or is not applicable. NM = Not Meaningful. The information is not meaningful and is therefore excluded. Research Analyst has not served as an officer, director or employee of Subject Company One year Price history of the daily closing price of the securities covered in this note is available at www.nseindia.com and www.economictimes.indiatimes.com/markets/stocks/stock-quotes. (Choose name of company in the list browse companies and select 1 year in icon YTD in the price chart) IndiaNivesh Securities Private Limited 601 & 602, Sukh Sagar, N. S. Patkar Marg, Girgaum Chowpatty, Mumbai 400 007. Tel: (022) 66188800 / Fax: (022) 66188899 e-mail: [email protected] | Website: www.indianivesh.in Home IndiaNivesh Research NiveshDaily January 29, 2015 | 6 IndiaNivesh Research is also available on Bloomberg INNS, Thomson First Call, Reuters and Factiva INDNIV.

© Copyright 2026