
Dabur India (DABIND)
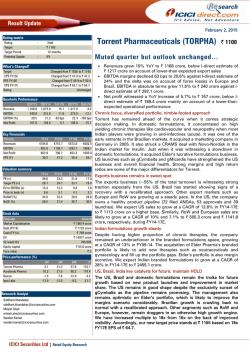
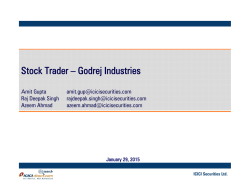
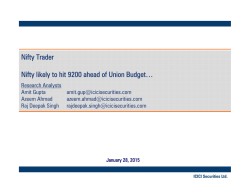
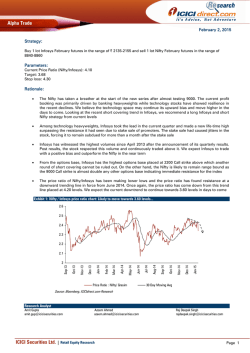
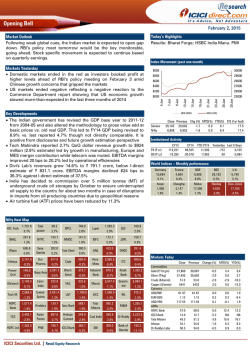
Result Update
February 2, 2015
Rating matrix
Rating
Target
Target Period
Potential Upside
:
:
:
:
Dabur India (DABIND)
Hold
263
12 months
2%
Volume growth remains strong…
What’s changed?
Target
EPS FY15E
EPS FY16E
EPS FY17E
Rating
Changed from | 222 to |263
Unchanged
Unchanged
Unchanged
Unchanged
Quarterly performance
Sales
EBITDA
EBITDA (%)
PAT
Q3FY15
2073.6
346.4
16.9
283.7
Q3FY14 YoY (%)
1904.3
8.9
292.5
18.4
15.4 156 bps
243.6
16.5
Q2FY15 QoQ (%)
1924.1
7.8
345.4
0.3
17.9 -102 bps
288.3
-1.6
Key financials
| Crore
Net Sales
EBITDA
Net Profit
EPS (|)
FY14
7,073.2
1,156.4
916.5
5.2
FY15
7,923.9
1,391.1
1,120.4
6.4
FY16E
9,412.9
1,671.5
1,302.5
7.5
FY17E
10,354.6
1,849.5
1,437.1
8.2
FY15
40.2
34.9
0.8
5.7
36.8
43.4
FY16E
34.5
30.0
1.0
4.8
33.7
42.3
FY17E
31.3
32.0
1.2
4.3
30.2
38.4
Valuation summary
P/E
Target P/E
Div. Yield
Mcap/Sales
RoNW (%)
RoCE (%)
FY14
49.2
42.8
0.7
6.4
38.3
42.4
Stock data
Particular
Market Capitalization (| Crore)
Total Debt (FY14) (| Crore)
Cash and Investments (FY14) (| Crore)
EV (| Crore)
52 week H/L
Equity capital
Face value
Amount
44,990.0
392.4
1,171.2
44,211.3
262 / 166
| 174.3 Crore
|1
Price performance
Dabur
Marico
GCPL
HUL
1M
10.3
9.2
11.2
22.8
3M
16.0
16.4
9.6
27.5
| 258
6M
27.9
41.1
25.4
34.7
12M
50.7
69.5
48.6
63.5
Research Analyst
Sanjay Manyal
[email protected]
Parineeta Rajgarhia
[email protected]
ICICI Securities Ltd | Retail Equity Research
• Dabur India’s Q3FY15 results were below our estimate on sales front
with 8.9% growth to | 2073.6 crore (I-direct estimate: | 2196.4 crore)
on the back of slower growth of 3.6% in international business.
However, domestic volume growth remains healthy at 7.4% led by
strong growth in health supplement, home care & oral care
• Skin care sales growth was impacted by loss in sales due to fire in its
Baddi plant. Foods business growth slowed down to 11.8% from
~20% in last four quarters mainly due to high base affect
• Operating margins improved 156 bps to 16.9% mainly on account of
100 bps savings in raw material cost and 70 bps savings in other
overheads. Advertisement spends increased marginally by 20 bps as
% to sales. Net profit increased 16.5% to | 283.7 crore (I-direct
estimate: | 283.2 crore) led by higher operating profit
Presence in niche categories to keep revenue growth healthy
Dabur India (DIL) has a strong portfolio of brands (Dabur Chyawanprash,
Real, Fem, Honey, Meswak, Dabur Red) with focus largely on ayurvedic
and healthcare offerings. The company’s diverse product portfolio (hair
care, oral care, skin care, home care, health supplements, digestives, OTC
& ethicals) and presence in niche categories has aided revenue growth at
a robust 21% CAGR in FY08-13. Though hair care, skin care and OTC &
ethicals have been seeing softening growth (7-10%) from FY13 onwards,
other categories (juices, health supplements, digestives & oral care) are
continuing to witness robust 15-20% growth. We believe led by DIL’s
brand strength in higher growth niche segments & further strengthening
of portfolio through new launches focusing on healthcare, revenue
growth would continue to remain healthy at 13.5% CAGR (FY14-17E).
On track to capture reviving urban growth
In the last few years (FY11-13), DIL more than doubled its rural reach from
~15,000 villages to ~38,000 villages through its ‘Project Double’. The
initiative played out extremely well for the company by increasing
contribution of booming rural demand in DIL’s revenues to 45-50% from
~30% earlier. It also aided in maintaining its volume growth at 8-11%.
Going ahead, with rural growth witnessing signs of flagging, DIL plans to
consolidate its presence by increasing number of SKUs at these rural
distribution points, rather than expanding reach further. Also, with DIL
planning to increase its healthcare offerings, it is aiming to increase its
urban coverage by capturing the untapped chemist network through a
new initiative called ‘Project CORE’. The company has increased its
chemist network reach from ~31,000 (FY13) to ~51,000 currently.
Sustains volume growth
Led by DIL’s niche portfolio and constant distribution expansion DIL’s
volume growth has maintained its 9-11% trajectory since FY11. Even in
FY13, when the FMCG industry overall was seeing a slowdown, DIL’s
volume growth was a healthy 8-11%. Going ahead, volume growth may
modest at 7-9%, with reviving demand scenario, expected from FY16E
onwards, resulting in higher volume growth of ~10% in FY16E and FY7E.
Volume growth remains healthy; fairly valued
DIL is sustaining well for the future by increasing its presence to capture
the revival in urban growth after establishing a strong presence in rural
markets. We expect the expansion to augur healthy revenue and earnings
CAGR (FY14-17E) of 14.5% and 16.2%, respectively. We value the stock
at 32x FY17E EPS of | 8.2 and arrive at a target price of | 263.
Variance analysis
Q3FY15 Q3FY15E Q3FY14 YoY (%) Q2FY15 QoQ (%)
2,073.6
2,196.4 1,904.3
8.9 1,924.1
7.8
Net Sales
Operating Income
5.5
5.3
5.0
8.8
5.5
-0.7
Raw Material Expenses
988.1
961.9
927.5
6.5
903.4
9.4
Employee Expenses
SG&A Expenses
Other operating Expenses
177.8
319.4
241.8
177.9
329.5
190.8
158.0
289.6
236.6
12.5
10.3
2.2
182.5
253.4
239.5
-2.6
26.1
1.0
EBITDA
EBITDA Margin (%)
346.4
16.7
352.2
16.0
292.5
18.4
15.4 134 bps
30.9
9.5
38.6
33.3
5.3
35.1
25.5
7.2
33.9
20.9
32.7
13.6
29.2
10.2
38.4
5.7
-6.4
0.5
PBT
350.0
Tax Outgo
66.3
PAT
283.7
Key Metrics YoY growth (%)
Volume Growth
7.4
Standalone sales growth
11.8
Subsidiary's sales growth
1.8
Source: Company, ICICIdirect.com Research
318.9
70.8
283.2
298.2
54.6
243.6
17.4
21.5
16.5
349.8
61.6
288.3
0.1
7.7
-1.6
8.0
15.5
15.0
9.0
12.6
27.9
Depreciation
Interest
Other Income
345.4
0.3
17.9 -124 bps
8.7
12.0
6.2
Comments
Net sales growth was lower at 8.9% on the back of 7.4% volume growth led
by strong growth in home care, oral care & health supplements
Raw material cost for the company dipped 100 bps as percentage of sales as
packaging cost dipped due to a sharp fall in crude prices
Operating margins improved 134 bps mainly due to saving in RM cost
Net proffit increased 16.5% in line with our estimates
Domestic volume growth remained strong at 7.4%
International business witnessed subduded growth of 3.6%
Change in estimates
Std. Sales (| crore)
Volume Growth (%)
Subs. Sales (| crore)
FY13
FY14
4,349.4 4,860.4
10.6
9.3
1,797.3 2,212.9
RM exp. To sales %
49.1
48.1
Adex to sales %
13.6
14.1
Interest Cost (| crore)
58.9
54.2
Source: Company, ICICIdirect.com Research
Current
Earlier
FY15E FY16E FY17E FY15E FY16E
5,438.2 6,286.0 6912.6 5,486.4 6,286.0
NA
NA
NA
NA
NA
2,485.7 3,126.9 3,442.0 2,560.4 3,126.9
47.7
14.1
38.7
46.4
14.4
18.6
46.6
14.3
18.6
47.9
14.0
34.5
46.4
14.4
18.6
Comments
FY17E
6,912.6 We have not changed our estimates
NA
3,442.0
46.6
14.3
18.6
Assumptions
(| Crore)
Old
Sales
8,158.0
EBITDA
1,356.6
16.6
EBITDA Ma
PAT
1,075.1
EPS (|)
6.2
FY15E
New
7,923.9
1,391.1
17.5
1,120.4
6.4
% Change
-2.9
2.5
88 bps
4.2
4.2
Old
9,412.9
1,648.8
17.5
1,289.8
7.4
FY16E
FY17
Old
New % Change
Comments
New % Change
9,412.9
0.0 10354.6 10354.6
0.0 We have not changed our estimates
1,671.5
1.4 1825.7 1825.7
0.0
17.7 20 bps
17.6
17.8
1.1
1,302.5
1.0 1437.1 1437.1
0.0
7.5
1.0
8.2
8.2
0.0
Source: Company, ICICIdirect.com Research
ICICI Securities Ltd | Retail Equity Research
Page 2
Company Analysis
Revenue growth to remain healthy largely led by volumes
DIL’s revenue growth has remained robust at 20.3% CAGR (FY09-14)
buoyed by its diverse & niche product portfolio, a slew of product
launches and synergistic inorganic acquisitions (Fem in FY09, Namaste in
FY11, Hobi in FY11) both in the domestic and international markets. Even
in a slowing consumer demand scenario from H2FY13, DIL has managed
to maintain its healthy revenue growth of 12-16% led by volume growth
of 8-11%. The slowdown has, however, largely impacted the company’s
hair oil (segment as a whole witnessing stagnation in growth) and skin
care (impacted by lower discretionary demand following the slowdown in
the economy) growth while keeping the oral care (Meswak & Dabur Red),
health supplements (Dabur Chyawanprash, Dabur Honey), home care
(Odonil, Odomos), foods (Real, Real Activ), digestive (Hajmola) and OTC &
ethicals portfolio growth healthy.
Going ahead, we believe that aided by the company’s increasing focus on
the healthcare portfolio (new launches expected by DIL in healthcare
space) and strengthening presence both in rural and urban India, revenue
growth would continue to remain strong at 13.5% CAGR in FY14-17E,
aided by a higher mix of volumes.
Though FY15E is witnessing some moderation in growth following
concerns of a slower recovery in urban demand, we believe that if the
economy bounces back to a healthy growth phase, Dabur would follow
the trend.
Exhibit 1: DIL’s revenues (| crore) and revenue growth (%)
12000
35
30.1
30
10000
8000
18.8
20.9
20.3
15.9
6000
15.1
12.0
0
20
10.0
4000
2000
25
18.8
15
10
2805.4
3390.5
4077.4
5305.4
6146.7
7073.2
7923.9
9412.9
10354.6
FY09
FY10
FY11
FY12
FY13
FY14
FY15E
FY16E
FY17E
Sales (| crore)
5
0
Sales growth (%)
Source: Company, ICICIdirect.com Research
Exhibit 2: Category wise revenue growth in % (YoY)
Hair Care
Oral Care
Health Supp.
Digestives
Skin Care
Home Care
Foods
OTC & Ethicals
Retail
Q1FY12 Q2FY12 Q3FY12 Q4FY12
9.0
15.9
19.6
19.8
12.5
6.0
11.4
7.8
-0.3
7.7
13.4
11.0
16.7
0.7
1.3
19.4
15.6
-1.9
5.1
17.8
24.9
0.6
17.7
18.1
31.5
27.6
17.3
30.4
5.8
-8.0
21.6
13.8
162.5
97.9 131.0
83.6
FY12 Q1FY13 Q2FY13 Q3FY13 Q4FY13
16.0
10.4
13.2
13.9
9.6
9.5
8.2
7.0
13.6
12.3
9.4
18.0
15.7
12.0
22.6
9.9
9.9
-3.5
-5.4
1.3
9.0
13.3
25.8
15.7
11.1
14.4
14.6
23.0
30.5
33.3
26.5
34.5
17.9
22.2
22.6
8.2
12.7
37.2
15.6
13.7
106.8
58.3
48.4
32.8
28.5
FY13 Q1FY14 Q2FY14 Q3FY14 Q4FY14
11.7
11.8
3.9
7.0
6.0
10.4
8.6
18.8
10.4
17.3
16.2
7.5
16.7
19.5
17.6
3.9
15.2
12.0
17.7
23.3
15.3
13.3
17.5
13.4
10.1
25.3
25.6
25.1
16.0
12.8
24.5
18.7
22.0
17.6
20.6
16.1
11.8
11.2
13.2
10.9
43.9
27.1
17.7
14.7
20.4
FY14 Q1FY15 Q2FY15
7.1
8.4
10.2
13.8
8.0
8.1
16.4
21.6
10.1
17.2
11.3
12.3
13.2
4.4
9.7
19.8
14.7
10.2
19.7
21.6
29.0
11.8
4.4
7.5
19.6
NA
NA
Source: Company, ICICIdirect.com Research
ICICI Securities Ltd | Retail Equity Research
Page 3
Q3FY15
12.1
11.3
13.5
11.6
4.0
16.2
11.8
8.8
NA
EBITDA margins to improve to 17.8% by FY17E…
DIL’s margins have remained at higher levels of 16-18% since FY08 led by
the company’s strong brand equity in the healthcare space of the FMCG
segment. Along with a changing sales mix (more towards the products
witnessing constant demand than seasonal demand), Dabur has
efficiently managed its raw material expenses and marketing expenses to
sustain its margins. Going ahead, with continued focus on the healthcare
portfolio and DIL expected to get aggressive in segment through new
launches and expansion in reach, we believe margins would improve
further to 17.8% by FY17E. We believe that aided by the company’s ability
to sustain a high brand equity in its segments, fluctuations in raw material
cost will be absorbed efficiently without impacting margins. However, any
savings in raw material costs would be directed towards higher
advertisement and promotion expenses.
Exhibit 3: EBITDA margins (%), RM cost to sales (%) and adex to sales (%)
60
50
25
18.0
19.7
19.8
17.7
17.6
14.7
40
16.8
17.7
18.8
16.7
15.6
16.7
14.5
16.3
17.5
17.7
17.8
20
15
30
10
20
5
10
0
0
FY09
FY10
FY11
FY12
Q1FY13 Q2FY13 Q3FY13 Q4FY13
RM Cost to Sales
FY13
EBITDA Margins
Q1FY14 Q2FY14 Q3FY14 Q4FY14
FY14
FY15E
FY16E
FY17E
Adex to Sales
Source: Company, ICICIdirect.com Research
Expansion in distribution network to bode well for future
DIL has efficiently expanded its distribution network in rural India through
‘Project Double’ since FY11. Through Project Double, DIL expanded its
reach from ~15000 villages in FY11 to ~38000 villages in FY13. The
extension in rural India paid off well for the company in capturing the
booming rural demand in the country in FY11-FY13. With initial signs of
softening rural demand following a weak economic scenario and slow
urban demand recovery, going ahead, the company plans to limit its rural
reach at current levels, and consolidate its position further. It plans to
increase the number of SKUs in existing rural distribution centres and
increase its offerings in existing rural markets along with a few new
launches. On the urban front, DIL is aiming to increase its presence in the
chemist channels of distribution considering the healthcare focus of the
company’s portfolio. Following the target to increase chemist coverage
DIL has launched ‘Project CORE – Chemist Outlet and Range Expansion’
launched in FY14. Until FY12, the company had a direct presence in
~55,000 chemists (~10% of chemists in India), which it has already
increased to ~2,00,000 outlets by FY14. Further, the company increased
its chemist distribution points from 31,300 outlets (FY13) to ~51,000
outlets in currently, which it is planning to increase to 75000 by the end of
FY15. Considering DIL’s strength of implementation, we believe the
company’s constant focus on managing sales and distribution efficiently
in both urban and rural markets along with a strong innovation pipeline,
revenue and margin growth would continue to remain healthy.
ICICI Securities Ltd | Retail Equity Research
Page 4
Outlook & valuation
We believe DIL’s strong and niche product portfolio would continue to
record healthy revenue and earnings growth at 14.9% and 18.8% CAGR,
respectively, in FY14-16E. Further, the increase in distribution expansion
and constant innovation would be catalysed if there is a revival in
consumer demand. We believe that given the diverse product portfolio,
the company’s margins would remain sustainable and are less prone to
fluctuations in raw material prices. Hence, we remain positive on the long
term outlook of the company.
The only concern for us remains the challenging near term consumer
demand scenario. Also, the looming risk of a weak monsoon and high
inflation could moderate consumer demand further. Hence, we remain
wary of growth in H1FY15E. Though until H1FY15, DIL could face some
margin and sales growth pressures in domestic business, we believe that
as higher price increases (5-6%) are induced and the expansion of
distribution network starts playing out for urban demand, growth would
gain traction.
DIL is currently trading at 31.2x FY17E EPS of | 8.2. We believe that with
margins expected to remain above ~17-18% by FY17E and sales growth
in the domestic business to revive given DIL’s strong brands in niche
segments, market development of niche segments (packaged foods &
juices, health supplements) and revival in urban demand, valuation
multiples will command a premium to its historic averages. We value the
stock at 32x FY17E EPS of | 8.2 and arrive at a target price of | 263 with a
HOLD recommendation.
Exhibit 4: Valuations
FY14
FY15E
FY16E
FY17E
Sales Growth
(| cr)
(%)
7073.2
15.1
8048.1
13.8
9412.9
17.0
10354.6
10.0
EPS Growth
(|)
(%)
5.2
19.3
6.4
22.6
7.5
16.0
8.2
10.3
PE EV/EBITDA
(x)
(x)
42.9
33.7
35.0
27.9
30.2
23.2
31.3
24.3
RoNW
(%)
38.3
36.8
33.7
30.2
Source: Company, ICICIdirect.com Research
ICICI Securities Ltd | Retail Equity Research
Page 5
RoCE
(%)
42.4
43.4
42.3
38.4
Company snapshot
250
200
Target Price | 263
150
100
50
Jan-17
Oct-16
Jul-16
Apr-16
Jan-16
Oct-15
Jul-15
Apr-15
Jan-15
Oct-14
Jul-14
Apr-14
Jan-14
Oct-13
Jul-13
Apr-13
Jan-13
Oct-12
Jul-12
Apr-12
Jan-12
Oct-11
Jul-11
Apr-11
Jan-11
Oct-10
Jul-10
Apr-10
Jan-10
0
Source: Bloomberg, Company, ICICIdirect.com Research
Key events
Date
Nov-08
Jul-09
Apr-10
Jul-10
Sep-10
Jan-11
Mar-11
May-12
Event
Acquisition of the company's largest skin care brand 'Fem' from Fem Care Pharma marking its entry in the high growth skin care segment
Rise in stock price following the increase in FMCG Index led by attractiveness of defensives in the economic downturn
Consistent 18-20% revenue growth with improvement in margins to ~20% tapping the revival in consumption demand
Entered Turkey through acquisition Hobi Kozmetik for | 324 crore. Acquisition is in line with the company's strategy of strengthening its presence in Middle East &
North Africa
Dabur issued bonus in the ratio od 1:1
Acquired US based personal care firm Namaste Laboratories LLC for | 451 crore. Acquisition marked Dabur's entry into US$1.5 billion hair care markets of US,
Europe and Africa
Launched 'Project Double' to double its direct reach in villages and to tap the growing aspirational demand of rural consumers
Stock performance remained lacklusture due to falling domestic revenues, declining margins and no significant innovations
In a grim economic scenario, ability to grow in double digits (volume) along with improvement in margins and market share gains across categories made it the top
preferrd stock in the FMCG pack
May-13
Source: Company, ICICIdirect.com Research
Top 10 Shareholders
Rank
1
2
3
4
5
6
7
8
9
10
Name
Chowdhry Associates
Chowdhry Associates
VIC Enterprises Pvt. Ltd.
Gyan Enterprises Pvt. Ltd.
Puran Associates Pvt. Ltd.
Ratna Commercial Enterprises Pvt. Ltd.
Milky Investment & Trading Company
Life Insurance Corporation of India
Burmans Finvest Pvt. Ltd.
Genesis Investment Management, LLP
Shareholding Pattern
Latest Filing Date
30-Sep-14
30-Jun-14
30-Jun-14
30-Jun-14
30-Jun-14
30-Jun-14
30-Jun-14
30-Jun-14
30-Jun-14
30-Jun-14
% O/S Position (m) Change (m)
12.41
217.9
0.0
12.41
217.9
0.0
12.40
217.7
0.0
11.52
202.2
0.0
10.77
189.2
0.0
8.84
155.3
0.1
6.04
106.1
0.0
4.01
70.5
1.2
3.02
53.0
0.0
2.05
36.0
0.0
(in %)
Promoter
FII
DII
Others
Dec-13 Mar-14 Jun-14 Sep-14 Dec-14
68.64 68.64 68.16 68.16 68.16
19.94 19.24 19.69 20.54 19.69
4.47
5.64
5.56
5.03
5.56
6.95
6.48
6.59
6.27
6.59
Source: Reuters, ICICIdirect.com Research
Recent Activity
Buys
Investor name
Matthews International Capital Management, L.L.C.
1832 Asset Management L.P.
BlackRock Institutional Trust Company, N.A.
Henderson Global Investors Ltd.
Norges Bank Investment Management (NBIM)
Value
15.74m
7.15m
6.00m
4.67m
3.83m
Shares
5.04m
2.30m
2.24m
1.57m
1.23m
Sells
Investor name
Life Insurance Corporation of India
Vontobel Asset Management, Inc.
HDFC Asset Management Co., Ltd.
Manulife Asset Management (Europe) Limited
Manulife Asset Management (US) LLC
Value
-29.72m
-6.46m
-5.44m
-4.99m
-3.74m
Shares
-8.29m
-2.56m
-2.05m
-1.81m
-1.36m
Source: Reuters, ICICIdirect.com Research
ICICI Securities Ltd | Retail Equity Research
Page 6
Financial summary
Profit and loss statement
(Year-end March)
Net Sales
Growth (%)
Raw Material Expenses
Employee Expenses
Marketing Expenses
Administrative Expenses
Other expenses
Total Operating Expenditure
EBITDA
Growth (%)
Depreciation
Interest
Other Income
PBT
Others
Total Tax
PAT
Growth (%)
Adjusted EPS (|)
| Crore
FY14
7073.2
15.1
3,400.0
607.7
999.7
642.9
287.7
5,938.0
1135.2
13.5
97.5
54.2
131.5
1,135.5
0.7
219.1
916.5
19.7
5.2
FY15E
7923.9
12.0
3,776.0
688.4
1,118.9
0.0
971.1
6,554.4
1369.6
20.6
120.1
38.7
148.0
1,380.4
0.0
260.0
1120.4
22.3
6.4
FY16E
9412.9
18.8
4,366.0
767.2
1,355.5
0.0
1,275.4
7,764.1
1648.8
20.4
138.5
18.6
155.4
1,669.8
0.0
367.4
1302.5
16.3
7.5
FY17E
10354.6
10.0
4,822.0
828.4
1,480.7
0.0
1,397.9
8,528.9
1825.7
10.7
151.6
18.6
163.2
1,842.4
0.0
405.3
1437.1
10.3
8.2
Source: Company, ICICIdirect.com Research
(Year-end March)
Profit before Tax
Add: Depreciation
(Inc)/dec in Current Assets
Inc/(dec) in CL and Provisions
Others
CF from operating activities
(Inc)/dec in Investments
(Inc)/dec in Fixed Assets
Others
CF from investing activities
Issue/(Buy back) of Equity
Inc/(dec) in loan funds
Dividend paid & dividend tax
Inc/(dec) in Sec. premium
Others
CF from financing activities
Net Cash flow
Opening Cash
Closing Cash
| Crore
FY14
1,135.5
97.5
-314.9
397.4
-214.4
1,101.1
10.5
-213.1
95.3
-107.3
0.1
-443.2
-278.8
0.0
-81.7
-803.7
190.1
329.3
519.4
FY15E
1,380.4
120.1
-329.4
-144.1
-221.3
805.6
-35.0
-350.0
0.0
-385.0
0.0
-115.0
-348.8
0.0
-38.7
-502.4
-81.9
519.4
437.5
FY16E
1,669.8
138.5
-821.0
125.9
-348.8
764.4
-35.0
-140.0
0.0
-175.0
0.0
-110.0
-436.0
0.0
-18.6
-564.5
24.9
437.5
462.4
FY17E
1,842.4
151.6
-1,015.4
120.8
-386.7
712.7
-110.0
-270.0
0.0
-380.0
0.0
-20.0
-523.1
0.0
-18.6
-561.7
-229.1
462.4
233.3
FY14
FY15E
FY16E
FY17E
5.2
5.8
15.2
1.8
3.0
6.4
7.1
19.7
2.0
2.5
7.5
8.3
24.6
2.5
2.7
8.2
9.1
29.9
3.0
1.3
16.3
14.2
13.0
49
34
56
17.5
15.6
14.1
50
35
36
17.7
16.1
13.8
60
36
29
17.8
16.2
13.9
70
45
25
38.3
42.4
30.8
36.8
43.4
30.2
33.7
42.3
29.4
30.2
38.4
27.1
49.2
38.7
6.3
6.4
16.9
40.2
32.1
5.6
5.7
13.1
34.5
26.7
4.7
4.8
10.5
31.3
24.3
4.3
4.3
8.6
0.2
0.1
1.3
0.9
0.1
0.0
1.5
1.0
0.0
0.0
1.8
1.1
0.1
0.0
2.1
1.2
Source: Company, ICICIdirect.com Research
Balance sheet
(Year-end March)
Liabilities
Equity Capital
Reserve and Surplus
Total Shareholders funds
Long Term Loans
Long Term Provisions
Minority Interest / Others
Total Liabilities
Assets
Gross Block
Less: Acc Depreciation
Net Block
Capital WIP
Non- Current Investments
LT loans & advances
Other Non-current Assets
Current Assets
Inventory
Debtors
Cash & Bank
ST Loans & Advances
Other Current Assets
Current Liabilities
Creditors
ST Borrowings
Other CL
Net Current Assets
Total Assets
Cash flow statement
| Crore
FY14
FY15E
FY16E
FY17E
174.4
2,481.6
2,656.0
260.4
44.8
56.8
3018.0
174.4
3,253.2
3,427.6
160.4
44.8
56.8
3689.6
174.4
4,119.7
4,294.1
60.4
44.8
56.8
4456.1
174.4
5,033.6
5,208.0
100.4
44.8
56.8
5410.1
2,412.8
645.9
1,766.9
21.7
424.7
24.5
18.1
2,662.8
766.0
1,896.8
121.7
449.7
39.5
28.1
2,782.8
904.4
1,878.4
141.7
474.7
49.5
38.1
3,032.8
1,056.1
1,976.7
161.7
574.7
109.5
48.1
972.3
675.3
519.4
132.0
756.9
1,100.5
770.4
437.5
198.1
796.9
1,568.8
941.3
462.4
339.9
836.9
2,013.4
1,294.3
233.3
517.7
876.9
1,096.5
447.7
749.5
762.1
3,018.0
792.4
547.7
809.5
1,153.8
3,689.6
758.3
647.7
869.5
1,873.8
4,456.1
719.1
747.7
929.5
2,539.3
5,410.1
Source: Company, ICICIdirect.com Research
Key ratios
(Year-end March)
Per share data (|)
Adjusted EPS
Cash EPS
BV
DPS
Cash Per Share
Operating Ratios (%)
PBITDA Margin
PBT / Total Operating income
PAT Margin
Inventory days
Debtor days
Creditor days
Return Ratios (%)
RoE
RoCE
RoIC
Valuation Ratios (x)
P/E
EV / EBITDA
EV / Net Sales
Market Cap / Sales
Price to Book Value
Solvency Ratios
Debt/EBITDA
Debt / Equity
Current Ratio
Quick Ratio
Source: Company, ICICIdirect.com Research
.
ICICI Securities Ltd | Retail Equity Research
Page 7
ICICIdirect.com coverage universe (FMCG)
CMP
M Cap
EPS (|)
(|)
TP(|) Rating
(| Cr) FY15E FY16E FY17E
Sector / Company
1,843 1,919 Hold 25,526 41.3 47.9
54.9
Colgate (COLPAL)
258
263 Hold 44,990
6.4
7.5
8.2
Dabur India (DABIND)
907
902 Hold 193,544 19.9 20.8
24.8
Hindustan Unilever (HINLEV)
360
387 Hold 280,748 11.5 12.7
14.5
ITC Limited (ITC)
288
272 Hold
5,159
8.7
9.8
10.1
Jyothy Lab (JYOLAB)
359
367
Buy 21,540
8.7 10.8
12.8
Marico (MARIN)
7,019 6,123 Hold 59,084 120.7 137.2 153.1
Nestle (NESIND)
163
182
Buy
9,802
6.6
8.7
9.1
Tata Global Bev (TATTEA)
1,848 1,962 Hold
2,924 89.7 95.8 109.0
VST Industries (VSTIND)
Source: Company, ICICIdirect.com Research
ICICI Securities Ltd | Retail Equity Research
P/E (x)
EV/EBITDA (x)
RoCE (%)
RoE (%)
FY15E FY16E FY17E FY15E FY16E FY17E FY15E FY16E FY17E FY15E FY16E FY17E
44.6 40.0 33.6 31.1 26.3 22.8 103.5 99.6 96.6 78.8 74.5 71.1
40.2 35.2 31.3 32.1 26.7 24.3 43.4 42.3 38.4 38.3 36.8 33.7
45.6 43.3 36.6 36.6 32.4 27.0 124.6 126.2 126.9 118.0 109.3 101.7
31.3 30.4 24.8 20.6 19.3 17.3 43.3 45.4 48.7 33.5 32.1 34.6
33.2 27.8 28.5 29.7 28.0 25.6 12.1 12.0 12.6 11.1 19.2 19.7
41.2 34.0 27.9 25.8 20.3 17.1 49.1 50.2 46.9 29.0 35.3 33.0
58.1 44.6 45.9 28.6 25.8 23.0 66.2 71.2 75.9 47.2 44.9 49.3
24.9 20.9 18.0 12.4 11.1 10.5
8.3
8.7
9.0
8.2
6.7
8.3
20.6 20.5 16.9 13.0 11.7 10.3 56.1 59.2 62.0 45.8 40.7 42.0
Page 8
RATING RATIONALE
ICICIdirect.com endeavours to provide objective opinions and recommendations. ICICIdirect.com assigns
ratings to its stocks according to their notional target price vs. current market price and then categorises them
as Strong Buy, Buy, Hold and Sell. The performance horizon is two years unless specified and the notional
target price is defined as the analysts' valuation for a stock.
Strong Buy: >15%/20% for large caps/midcaps, respectively, with high conviction;
Buy: >10%/15% for large caps/midcaps, respectively;
Hold: Up to +/-10%;
Sell: -10% or more;
Head – Research
Pankaj Pandey
[email protected]
ICICIdirect.com Research Desk,
ICICI Securities Limited,
1st Floor, Akruti Trade Centre,
Road No 7, MIDC,
Andheri (East)
Mumbai – 400 093
[email protected]
ICICI Securities Ltd | Retail Equity Research
Page 9
ANALYST CERTIFICATION
We /I, Sanjay Manyal, MBA (Finance) and Parineeta Rajgarhia, MBA (Finance), Research Analysts, authors and the names subscribed to this report, hereby certify that all of the views expressed in this
research report accurately reflect our views about the subject issuer(s) or securities. We also certify that no part of our compensation was, is, or will be directly or indirectly related to the specific
recommendation(s) or view(s) in this report.
Terms & conditions and other disclosures:
ICICI Securities Limited (ICICI Securities) is a full-service, integrated investment banking and is, inter alia, engaged in the business of stock brokering and distribution of financial products. ICICI Securities is
a wholly-owned subsidiary of ICICI Bank which is India’s largest private sector bank and has its various subsidiaries engaged in businesses of housing finance, asset management, life insurance, general
insurance, venture capital fund management, etc. (“associates”), the details in respect of which are available on www.icicibank.com.
ICICI Securities is one of the leading merchant bankers/ underwriters of securities and participate in virtually all securities trading markets in India. We and our associates might have investment banking
and other business relationship with a significant percentage of companies covered by our Investment Research Department. ICICI Securities generally prohibits its analysts, persons reporting to analysts
and their relatives from maintaining a financial interest in the securities or derivatives of any companies that the analysts cover.
The information and opinions in this report have been prepared by ICICI Securities and are subject to change without any notice. The report and information contained herein is strictly confidential and
meant solely for the selected recipient and may not be altered in any way, transmitted to, copied or distributed, in part or in whole, to any other person or to the media or reproduced in any form, without
prior written consent of ICICI Securities. While we would endeavour to update the information herein on a reasonable basis, ICICI Securities is under no obligation to update or keep the information current.
Also, there may be regulatory, compliance or other reasons that may prevent ICICI Securities from doing so. Non-rated securities indicate that rating on a particular security has been suspended
temporarily and such suspension is in compliance with applicable regulations and/or ICICI Securities policies, in circumstances where ICICI Securities might be acting in an advisory capacity to this
company, or in certain other circumstances.
This report is based on information obtained from public sources and sources believed to be reliable, but no independent verification has been made nor is its accuracy or completeness guaranteed. This
report and information herein is solely for informational purpose and shall not be used or considered as an offer document or solicitation of offer to buy or sell or subscribe for securities or other financial
instruments. Though disseminated to all the customers simultaneously, not all customers may receive this report at the same time. ICICI Securities will not treat recipients as customers by virtue of their
receiving this report. Nothing in this report constitutes investment, legal, accounting and tax advice or a representation that any investment or strategy is suitable or appropriate to your specific
circumstances. The securities discussed and opinions expressed in this report may not be suitable for all investors, who must make their own investment decisions, based on their own investment
objectives, financial positions and needs of specific recipient. This may not be taken in substitution for the exercise of independent judgment by any recipient. The recipient should independently evaluate
the investment risks. The value and return on investment may vary because of changes in interest rates, foreign exchange rates or any other reason. ICICI Securities accepts no liabilities whatsoever for any
loss or damage of any kind arising out of the use of this report. Past performance is not necessarily a guide to future performance. Investors are advised to see Risk Disclosure Document to understand the
risks associated before investing in the securities markets. Actual results may differ materially from those set forth in projections. Forward-looking statements are not predictions and may be subject to
change without notice.
ICICI Securities or its associates might have managed or co-managed public offering of securities for the subject company or might have been mandated by the subject company for any other assignment
in the past twelve months.
ICICI Securities or its associates might have received any compensation from the companies mentioned in the report during the period preceding twelve months from the date of this report for services in
respect of managing or co-managing public offerings, corporate finance, investment banking or merchant banking, brokerage services or other advisory service in a merger or specific transaction.
ICICI Securities or its associates might have received any compensation for products or services other than investment banking or merchant banking or brokerage services from the companies mentioned
in the report in the past twelve months.
ICICI Securities encourages independence in research report preparation and strives to minimize conflict in preparation of research report. ICICI Securities or its analysts did not receive any compensation
or other benefits from the companies mentioned in the report or third party in connection with preparation of the research report. Accordingly, neither ICICI Securities nor Research Analysts have any
material conflict of interest at the time of publication of this report.
It is confirmed that Sanjay Manyal, MBA (Finance) and Parineeta Rajgarhia, MBA (Finance), Research Analysts of this report have not received any compensation from the companies mentioned in the
report in the preceding twelve months.
Compensation of our Research Analysts is not based on any specific merchant banking, investment banking or brokerage service transactions.
ICICI Securities or its subsidiaries collectively or Research Analysts do not own 1% or more of the equity securities of the Company mentioned in the report as of the last day of the month preceding the
publication of the research report.
Since associates of ICICI Securities are engaged in various financial service businesses, they might have financial interests or beneficial ownership in various companies including the subject
company/companies mentioned in this report.
It is confirmed that Sanjay Manyal, MBA (Finance) and Parineeta Rajgarhia, MBA (Finance), Research Analysts do not serve as an officer, director or employee of the companies mentioned in the report.
ICICI Securities may have issued other reports that are inconsistent with and reach different conclusion from the information presented in this report.
Neither the Research Analysts nor ICICI Securities have been engaged in market making activity for the companies mentioned in the report.
We submit that no material disciplinary action has been taken on ICICI Securities by any Regulatory Authority impacting Equity Research Analysis activities.
This report is not directed or intended for distribution to, or use by, any person or entity who is a citizen or resident of or located in any locality, state, country or other jurisdiction, where such distribution,
publication, availability or use would be contrary to law, regulation or which would subject ICICI Securities and affiliates to any registration or licensing requirement within such jurisdiction. The securities
described herein may or may not be eligible for sale in all jurisdictions or to certain category of investors. Persons in whose possession this document may come are required to inform themselves of and
to observe such restriction.
ICICI Securities Ltd | Retail Equity Research
Page 10

© Copyright 2026