
Opening Bell - Moneycontrol
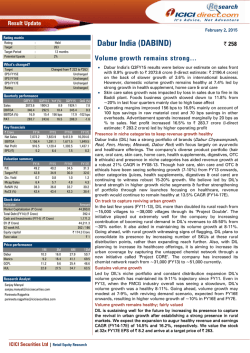
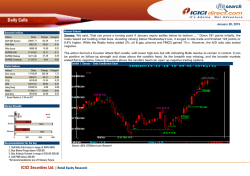
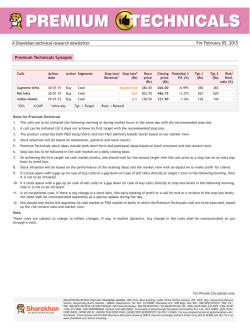
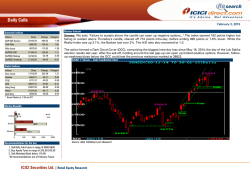
Opening Bell
February 2, 2015
Results: Bharat Forge; HSBC India Manu. PMI
Index Movement (past one month)
25000
Key Developments
13-Jan
BSE (RHS)
• The Indian government has revised the GDP base year to 2011-12
from 2004-05 and also altered the methodology to gross value add at
basic prices vs. old real GDP. This led to FY14 GDP being revised to
6.9% vs. last reported 4.7% though not directly comparable. It is
positive from disclosures and future growth estimation perspective
• Tech Mahindra reported 2.7% QoQ dollar revenue growth to $924
million (2.9% estimate) led by growth in manufacturing, Europe and
MES merger contribution while telecom was muted. EBITDA margins
improved 20 bps to 20.2% led by operational efficiencies
• Divi's Lab’s revenues grew 14.6% to | 791.1 crore, below I-direct
estimate of | 831.1 crore. EBITDA margins declined 624 bps to
36.3% against I-direct estimate of 37.5%
• India has decided to commission over 5 million tonnes (MT) of
underground crude oil storages by October to ensure uninterrupted
oil supply to the country for about two months in case of disruptions
in imports from oil producing countries due to geopolitical reasons
• Air turbine fuel (ATF) prices have been reduced by 11.3%
Sensex
Nifty
30-Jan
26000
8000
28-Jan
27000
8200
23-Jan
8400
21-Jan
28000
19-Jan
29000
8600
15-Jan
30000
8800
9-Jan
9000
7-Jan
Markets Yesterday
• Domestic markets ended in the red as investors booked profit at
higher levels ahead of RBI’s policy meeting on February 3 amid
Chinese growth concerns that gripped the markets
• US markets ended negative reflecting a negative reaction to the
Commerce Department report showing that US economic growth
slowed more-than-expected in the last three months of 2014
Today’s Highlights
5-Jan
Market Outlook
Following weak global cues, the Indian market is expected to open gap
down. RBI’s policy meet tomorrow would be the key monitorable,
going ahead. Stock specific movement is expected to continue based
on quarterly earnings.
NSE (LHS)
Close Previous Chg (%) MTD(%) YTD(%) P/E (1yr fwd)
29,183 29,682
-1.7
0.0
6.1
17.5
8,809
8,952
-1.6
0.0
6.4
17.4
Institutional Activity
FII (| cr)
DII (| cr)
CY13
112,221
-73,385
CY14
99,525
-30,570
YTD CY15
11,592
-7,982
Yesterday Last 5 Days
-772
6,155
-38
-5,094
World Indices – Monthly performance
Germany
10,694
9.1%
France
4,604
8.4%
NSE
8,809
6.8%
BSE
29,183
6.5%
U.K.
6,749
3.1%
Kospi
1,950
1.8%
Shanghai
3,147
1.4%
Nikkei
17,580
1.3%
Nasdaq
4,635
-3.0%
Dow Jones
17,165
-4.5%
Nifty Heat Map
HCL Tech
BHEL
Wipro
Infosys
Power
Grid
Ultratech
Tech M.
HDFC
Bank
TCS
HDFC Ltd
1,791.8
8.7%
291.8
1.3%
606.6
0.6%
2,141.9
-0.2%
148.0
-0.5%
3,140.4
-0.7%
2,868.5
-1.2%
1,077.4
-1.6%
2,482.1
-2.5%
1,262.5
-4.0%
Tata
power
NTPC
90.5
2.7%
143.7
1.3%
Sesa
Sterlite
202.0
Sun
Pharma
917.8
Bajaj Auto
0.2%
-0.2%
2,391.7
-0.5%
Cairn
India
232.9
United
Spirits
3,451.4
Hindalco
Asian
Paints
PNB
-0.8%
-1.3%
139.7
-1.9%
857.8
-2.7%
189.7
-4.7%
BPCL
NMDC
Tata Steel
Cipla
Bharti
Airtel
HUL
L&T
Axis Bank
Ambuja
Cement
ICICI Bank
748.9
2.0%
141.5
1.0%
390.5
0.0%
695.8
-0.2%
373.7
-0.6%
932.6
-1.0%
1,700.6
-1.4%
588.1
-1.9%
248.8
-2.8%
360.7
-5.2%
ICICI Securities Ltd. | Retail Equity Research
Lupin
IDFC
GAIL
1,585.3
2.0%
172.1
0.8%
423.0
0.0%
Hero
Moto
2,865.5
Indusind
Bank
870.2
Maruti
ACC
Tata
Motors
Coal India
SBI
-0.4%
-0.7%
3,647.4
-1.1%
1,560.5
-1.4%
585.2
-2.2%
360.9
-3.8%
309.0
-5.5%
DLF
JSPL
ONGC
ITC
169.9
2.0%
158.7
0.8%
351.4
-0.2%
368.6
-0.4%
Kotak
Bank
1,322.2
Grasim
Ind
3,884.1
RIL
M&M
Dr Reddy
Bank of
Baroda
-0.7%
-1.2%
915.3
-1.5%
1,265.1
-2.4%
3,233.3
-3.9%
193.2
-11.1%
Markets Today
Commodities
Gold (|/10 gm)
Silver (|/kg)
Crude ($/barrel)
Copper ($/tonne)
Currency
USD/INR
EUR/USD
USD/YEN
ADRs
HDFC Bank
ICICI Bank
Tata Motors
Infosys
Dr Reddys Labs
Close
Previous
Change (%) MTD(%) YTD(%)
27,960
37,495
51.5
5541
28,087
38,602
53.0
5433
-0.5
-2.9
-2.9
2.0
3.4
0.0
-2.9
0.0
3.4
2.7
-10.3
-13.0
61.87
1.13
117.55
61.87
1.13
117.49
0.0
0.2
0.1
0.0
0.2
-0.1
1.9
-6.4
1.9
57.0
12.0
49.3
34.1
50.5
60.0
12.7
51.2
34.6
54.0
-5.0
-5.3
-3.6
-1.6
-6.5
12.4
NA
15.6
8.3
0.9
12.3
NA
16.7
8.3
0.0
Exchange Cash Turnover (| crore)
Sectoral Index
Sector
3,745
25,432
4,050
24,551
10000
3,961
22,507
20000
22-Jan
23-Jan
27-Jan
28-Jan
29-Jan
30-Jan
0
BSE Cash
NSE Cash
23-Jan
27-Jan
28-Jan
29-Jan
196,875
22-Jan
580,849
700000
600000
500000
400000
300000
200000
100000
0
570,001
NSE Derivative Turnover (| crore)
30-Jan
NSE Derivative
Sectoral Performance – Monthly Returns (%)
Close
Previous
Change
% Change
Volume
Auto
19985.9
20231.1
-245.2
-1.2
2444000
Banks
22715.5
23453.1
-737.6
-3.1
13561000
BSE Small Cap
11329.3
11378.8
-49.5
-0.4
66923000
Capital Goods
17095.7
17218.1
-122.4
-0.7
10089000
Consumer Durables
10655.4
10856.3
-200.9
-1.9
843000
8275.5
8321.4
-45.9
-0.6
1667000
Healthcare
15666.5
15749.8
-83.3
-0.5
1049000
IT
11178.7
11156.4
22.3
0.2
1087000
Metals
10190.2
10276.1
-85.8
-0.8
5115000
Mid Cap
10738.6
10771.1
-32.5
-0.3
112732000
Oil & Gas
10143.2
10208.5
-65.3
-0.6
1706000
FMCG
30000
3,891
21,480
Prior Values
5,251.34bln IN
-7.8bln mo
25.4bln $
322.04bln $
5.30%
4.50%
34.83bln $
3.80%
3.00%
-34.6bln $
9.43bln $
5.20%
-7.80%
0.11%
1.57%
4.00%
7.75%
6.75%
391,074
Latest Values
5,323.81bln IN
10.1bln mo
4.70%
38.6bln $
-
4,032
21,475
Release Date
30-Jan
03~08Dec
09~16Feb
6-Feb
9-Feb
30-May
09~16Feb
12-Feb
12-Feb
03~08Dec
09~16Feb
16-Feb
16-Feb
16-Feb
16-Feb
3-Feb
3-Feb
3-Feb
350,427
Period
Dec
Q3
Jan
w/e
Q3
12M
Jan
Dec
Dec
Q3
Jan
Jan
Jan
Jan
Jan
N/A
N/A
N/A
3,557
19,255
Key Domestic Economic Indicator
Fed Fiscal Deficit
Current Account
Exports - USD
FX Reserves, USD Final
GDP Quarterly yy
GDP Annual
Imports - USD
Industrial Output yy
Manufacturing Output
Trade Deficit - RBI
Trade Deficit Govt - USD
WPI Food yy
WPI Fuel yy
WPI Inflation yy
WPI Manufacturing Inflation yy
RBI Cash Reserve Ratio
RBI Repo Rate
RBI Reverse Repo Rate
251,234
Key Data Points
Power
2224.5
2205.2
19.3
0.9
25049000
PSU
8205.1
8344.2
-139.1
-1.7
28379000
Real Estate
1811.4
1772.8
38.6
2.2
34765000
Real Estate
Capital Goods
Consumer
Power
Healthcare
Auto
FMCG
Banks
IT
Mid Cap
BSE Small
Oil & Gas
PSU
Metals
-10.0
17.7
11.4
11.2
7.4
7.4
7.0
6.9
6.3
6.1
4.7
3.3
3.2
0.2
-4.7
-5.0
0.0
5.0
(%)
10.0
15.0
20.0
Key News for Today
Company/Industry
Dabur India
News
Dabur India's Q3FY15 results were below our
estimate on the revenue front and in line with
our estimates on the EBITDA as well as earnings
front. Dabur reported revenue growth of 9.2%
YoY to | 2073.6 crore (I-direct estimate: | 2196.4
crore). Operating margins came in higher than
our estimate at 16.9% (I-direct estimate: 16.0%).
The improvement in margins has been mainly
on the back of 100 bps savings in raw material
cost. Higher EBITDA and lower tax outgo led to
16.5% growth in net profit to | 283.7 crore
ICICI Securities Ltd. | Retail Equity Research
View
WIth volume growth of 7.4%, Dabur has
seen one of the better growth rates in
the FMCG space. We remain positive on
the stock
Impact
Key News for Today
Strides Acrolab
Strides Arcolab's oral dosage facility (KRS
Gardens) at Bangalore has been found
acceptable by the United States Food and Drug
Administration (US FDA). The inspection was
carried out in August 2014
ICICI Securities Ltd. | Retail Equity Research
The oral dosage facility in Bangalore
manufactures oral dosage forms such as
tablets, capsules (both hard & soft
gelatine)
and
sachets.
The
manufacturing plants support important
current and future submissions for the
US market
Sensex Chart
Technical Outlook
We said, "Failure to sustain above the candle
can open up negative options..." The index
opened 162 points higher but failing to sustain
above Thursday's candle, shaved off 774
points intra-day, before ending 499 points or
1.6% lower. While the Realty Index was up
2.1%, the Bankex lost over 3%. The A/D ratio
also worsened to 1:2.
The action formed a Dark Cloud Cover (DCC),
comprising the biggest intra-day loss since
May 16, 2014, the day of the Lok Sabha
election results last year. After the sell-off,
holding around the last gap-up can open up
limited positive options. However, follow-up
weakness/close below the DCC could test the
previous resistance marked at 28822.
Pivot Points
CNX Nifty Technical Picture
Index/Stocks
Close
29182.95
8808.90
1560.45
627.30
51.95
1797.55
116.00
91.10
1313.55
242.55
290.75
65.70
857.75
1247.75
2391.70
193.15
266.25
1423.05
SENSEX
NIFTY
ACC
ADANI ENTER.
ADANI POWER
ADITYA BIRLA
ALLAHABAD BANK
ANDHRA BANK
APOLLO HOSPITALS
APOLLO TYRES
ARVIND
ASHOK LEYLAND
ASIAN PAINTS
AUROBINDO PHARMA
BAJAJ AUTO
BOB
BOI
BATA INDIA
S1
28887.55
8723.80
1534.05
619.90
51.90
1774.95
113.05
90.55
1280.10
241.70
285.30
64.85
845.05
1244.65
2371.85
178.95
256.75
1402.20
S2
28797.00
8697.45
1520.35
599.40
51.25
1768.25
111.30
88.35
1263.00
238.70
278.15
63.85
831.25
1237.90
2361.75
176.75
253.55
1393.35
R1
29274.40
8834.55
1562.50
660.85
53.20
1802.00
117.25
95.00
1324.30
247.70
291.75
65.90
862.25
1258.15
2392.85
196.50
268.65
1429.55
R2
29467.85
8889.95
1576.70
670.45
53.90
1815.55
119.35
95.85
1346.45
250.55
295.00
66.45
870.85
1272.25
2403.35
205.25
274.60
1443.25
Trend
-ve
-ve
-ve
+ve
+ve
-ve
-ve
+ve
-ve
+ve
-ve
-ve
-ve
+ve
-ve
-ve
-ve
-ve
Nifty
Trend
Trend Reversal
Support
Resistance
20 Days EMA
200 days EMA
Intraday
Short Term
Down
8810
8760-8720
8810-8850
0
0
Up
8600
8600
9200
8615
7826
Advances / Declines
Advances
1194
569
BSE
NSE
Declines
1669
911
Daily Technical Calls
1. Buy Apollo Tyre in range of 242.50-243.50
2. Sell Allahabad Bank below 116.00
*All recommendations are of February Future
See Momentum Pick for more details
Nifty Call – Put Strike (No. of shares in lakh) – February 2014
8400
8500
8600
8700
8800
8900
9000
9100
9200
60.0
Intraday Derivative Strategy
Buy ITC FEB Fut at 368.00-369.00
View: Bullish
Strategy: Buy Future
Target 1: 372
Target 2: 375
Stop Loss: 365
Market Lot: 1000
CMP : 371
8
33
17
48
43
40
42
37
25
20
31
43
106
28
45
3
3
40.0
20.0
52
0.0
20.0
Call
40.0
Put
60.0
80.0
100.0
120.0
Sell CANBAN FEB Fut at 455.00-456.00
View: Bearish
Strategy: Sell Future
Target 1: 452.50 Target 2: 442.60
Stop Loss: 459.50
Market Lot: 1000
CMP : 449
See Daily Derivatives for more details
ICICI Securities Ltd. | Retail Equity Research
Unchanged
112
69
Results/Events Calendar
12
January
Monday
India Industrial Prod. YoY
India CPI YoY
0
0
0
19
January
Monday
InfoEdge, Mindtree
Hindustan Zinc
HUL, Atul Auto
CCL Products
ECB Current Account
26
January
Monday
Japan Trade Balance
Japan Import/Export YoY
0
0
0
02
February
Monday
Bharat Forge
HSBC India Manu. PMI
0
0
0
09
February
Monday
Navneet Education
0
0
0
0
13
14
January
Tuesday
IndusInd Bank, DCB Bank
UK CPI YoY
UK PPI YoY
0
0
20
Kajaria Ceramics, NIIT Tech
TV18, LIC Housing Finance
Yes Bank
India WPI YoY
Eurozone Industrial Prod. YoY
21
January
Tuesday
Kotak Mahindra Bank
Rallis India
South Indian Bank
Jindal Saw
China GDP & Ind. Prod YoY
27
28
Tuesday
Maruti Suzuki
Amara Raja, Idea Cellular
Titan Company
UK GDP YoY
US Service PMI
03
04
Tuesday
Hero Motocorp,Lupin,NHPC
PNB, ACC, Shree Cement
NHPC, JSPL, Marico
Jubilant Life Sciences
India Monetary Policy
10
Tata Power
Gujarat Pipavav
Bharti Airtel
Aurobindo Pharma
APL Apollo
11
February
Tuesday
Motherson Sumi
Cadila Healthcare
ENIL
0
0
Wednesday
Bata India
NCC, BPCL
Syndicate Bank
Container Corporation
0
Date
2-Feb
2-Feb
2-Feb
3-Feb
3-Feb
3-Feb
3-Feb
4-Feb
4-Feb
4-Feb
4-Feb
5-Feb
5-Feb
5-Feb
6-Feb
6-Feb
Event
HSBC India Manu. PMI
HSBC China Manu. PMI
Markit US Manu. PMI
RBI Cash Reserve Ratio
RBI Repurchase Rate
RBI Reverse Repo Rate
PPI YoY
HSBC India Services PMI
HSBC India Composite PMI
HSBC China Composite PMI
HSBC China Services PMI
Initial Jobless Claims
Continuing Claims
Trade Balance
GDP Annual Estimate YoY
Trade Balance
06
February
Thursday
12
January
Friday
January
Friday
Mahindra Life, NTPC, eClerx
JSW Steel, Sun TV, BOB
Shoppers Stop, PVR, HCL
Dabur, Indoco Rem, Tech M
Kansai, Ashoka Buildcon
PTC India, HEG
Vardhman Textiles
Gulf Oil Lubricants
Tata Motors, Petronet LNG
Apcotex Ind., IRB Infra
February
Major Economic Events this week
30
January
05
February
Friday
EPC Industrie, Wabco
Colgate, UltraTech Cement
India Eight Infra. Industries
China Manufacturing PMI
US Manufacturing PMI
Thursday
Dr. Reddy's Lab, Essel Pro.
HDFC, IDFC, Asian Paints
Gandhi Sp. Tubes, Blue Dart
Ashok Leyland,Gateway Dist.
Sesa Sterlite, TajGVK Hotels
Wednesday
23
January
29
January
Wednesday
January
Axis bank, Wipro, V-Guard
Reliance Ind., Oberoi Realty
US Ind. Prod. MoM
US Manufacturing Prod
US CPI YoY
Thursday
Biocon, Cairn India
Somany Ceramics
Dish TV, VST Industries
Essar Ports
US Initial Jobless Claims
Torrent Pharma, EIH
Pidilite Industries, Sintex
Jyothy Labs, Havells India
Ajanta Pharma
Aban Offshore, Accelya Kale
February
22
January
16
January
Thursday
TCS, Cyient, HSIL
Bajaj Auto, DB Corp
Federal Bank, PTC India Fin.
US Initial Jobless Claims
US Continuing Claims
Wednesday
Zee Entertainment
TTK Prestige, ITC
Siyaram Silk
KPIT
0
January
15
January
Wednesday
Friday
Apollo Tyres, TV Today
Tata Steel, GAIL
Jet Airways, Dena Bank
NMDC, Rupa & Company
Maharashtra Seamless
13
February
Thursday
Page Industries
Bajaj Electricals, ONGC
Hindalco, CESC
0
0
February
February
Friday
M&M
Nestle
HPCL
0
0
17
January
Saturday
Unichem Labs
Symphony Ltd
0
0
0
24
January
Saturday
United Spirits
Gati, Tata Coffee
City Union Bank
Persistent Systems
0
31
January
Saturday
Exide Industries
Divi's Labs
0
0
0
07
February
Saturday
IPCA Labs, JK cement
VA Tech Wabag
0
0
0
14
February
Saturday
Apollo Hospitals, Cox&Kings
Sun Pharma
0
0
0
Bulk Deals
CountryPeriod
IN
Jan
CH
Jan F
US
Jan F
IN
3-Feb
IN
3-Feb
IN
3-Feb
EC
Dec
IN
Jan
IN
Jan
CH
Jan
CH
Jan
US
31-Jan
US
24-Jan
US
Dec
IN
1Q A
UK
Dec
Expected Previous
-54.5
-49.8
---4.00%
-7.75%
-6.75%
-- -1.60%
-51.1
-52.9
-51.4
-53.4
------ -$39.0B
-4.70%
-- -£1406
ICICI Securities Ltd. | Retail Equity Research
No. of
shares Price (|)
Company
BSE*
Arihant Capital Markets
Shalibhadra Finance Ltd
Client Name
Type
Midpoint Tradelink Private Limited
Signora Finance Private Limited
Sell
Buy
145,001
25,371
23.8
33.0
NSE*
HDIL
Bay Pond MB
Buy
2,502,554
106.2
Indiabulls Real Estate Ltd
Merrill Lynch Capital Markets
Buy
2,442,000
83.5
Recent Releases
Date
Report
30 January 2015
Result Update – Sesa Sterlite
30 January 2015
Result Update – East India Hotels
30 January 2015
Result Update – IDFC
30 January 2015
Result Update – Pidilite Industries
30 January 2015
Result Update – HCL Technologies
Research Product Basket
Research
Perspective
Product
Pre-market view & Recommendation
Opening Bell
Daily Calls
Daily Derivative
Daily comprehensive snapshot containing
information & in-depth analysis of Indian &
US markets, major headlines, technical view,
derivatives statistics, economic indicators,
commodities, market indicators, domestic &
global events.
Features four stocks & Nifty view with a
trading outlook for the day based on shortterm technical trends considering key
technical indicators & statistical information.
Trading strategy for a day in the futures &
options segment based on news events,
market trends, technical & other factors
governing movements in stocks.
Frequency
Time
frame
Avg. Returns
objective
Location
on ICICIdirect.com
Pre-market open –
Daily
1 Day
-
Market Page,
Trading PageScroller & iCLICK-2-GAIN
Pre-market open –
Daily
1 Day
2-3 %
Research page-We
Recommend, Trading Page
Pre-market open –
Daily
1 Day
2-3 %
Research page-We
Recommend, Trading Page
Daily
1 – 2 Days
1 - 2%
Daily
1 Days
1 - 2%
Daily
1 – 2 Days
1 - 2%
Intraday Recommendation
BTST Calls
Margin Calls
Derivative Calls
Based on short-term technical trends and
stock specific news/news expectations.
Based on short-term technical trends and
stock specific news/news expectations.
Based on short-term technical trends and
stock specific news/news expectations.
Provides simplified derivative strategies such
as spreads and covered calls
Derivative
Strategies
Weekly & Monthly recommendations
Weekly Calls
Weekly Technicals
Weekly Derivatives
Market Trends
Global Derivatives
Monthly Technical’s
Technical trends for a week considering key
technical indicators & statistical information
Features stocks with a trading outlook for a
week based on short-term technical trends
considering key technical indicators &
statistical information.
Trading opportunities in futures & options
segment based on data analysis, overall
market trend, volatility & open interest
positions of securities.
Nifty outlook for the month based on F&O
data, FII activity, Heavyweights OI analysis
along with statistical inputs.
Derivatives outlook on global equity indices,
currencies and commodities. Also,
elaborating the likely impact on the Indian
bourses.
Trading outlook for a month based on
medium-term technical trends considering
key technical indicators & statistical
information.
Medium & Long term recommendations
Tecno Funda
On basis of Technical and Fundamental
whenever opportunity occurs we give these
Pick/Technical
calls
Deliver Call
Positional Derivatives
Stocks on the move
Identifying Out-performers/Under-performers
vis a vis index along with positional
recommendation on Stocks/Nifty.
Covers stocks, which are likely to show
significant upward movement in the next 15
days due to change in trader sentiment.
Detailed Company
Report
Fundamental report understanding the
business model and future prospects of the
company & valuations.
Equity Model
Portfolio
High Dividend
Yield Stocks
A portfolio based on your risk appetite: large
cap, midcap and diversified
Features high dividend yielding stocks for
assured returns on investment
Trading Page iCLICK-2-GAIN
Trading Page iCLICK-2-GAIN
Trading Page iCLICK-2-GAIN
iClick-2-Gain
Weekly
1-7 days
5%
Research page-We
Recommend, Trading Page,
iCLICK-2-GAIN
& iClick-2-Invest
Weekly
1-7 days
4 – 5%
Research page-We
Recommend, Trading Page
Weekly
1-7 days
4 – 5%
Research page-We
Recommend, Trading Page
Monthly
30 days
-
Trading Page
Monthly
30 days
-
Trading Page
Monthly
30 days
10%
Research page-We
Recommend, Trading Page,
iClick-2-Invest
Not regularly
recommended
3 months
20%
Trading Page, iCLICK-2-GAIN
& iClick-2-Invest
Trading Page, iCLICK-2-GAIN
Fortnightly
Fortnightly – every
alternate Wednesday
> 7-15
days
5 – 7%
When published
> 1 year
> 20% &
above
Quarterly
Research page-We
Recommend, Trading Page,
Scroller, iCLICK-2-GAIN
Research page-We
Recommend, Trading Page,
iCLICK-2-GAIN
& iClick-2-Invest
Research page-We
Recommend, iClick-2-Gain
Research page-We
Recommend, iClick-2-Gain
Pankaj Pandey
Head – Research
ICICIdirect.com Research Desk,
ICICI Securities Limited,
1st Floor, Akruti Trade Centre,
Road No 7, MIDC
Andheri (East)
Mumbai – 400 093
[email protected]
ICICI Securities Ltd. | Retail Equity Research
[email protected]
Disclaimer
ANALYST CERTIFICATION
We /I, Pankaj Pandey Research Analysts, authors and the names subscribed to this report, hereby certify that all of the views expressed in this research report accurately reflect our views about the
subject issuer(s) or securities. We also certify that no part of our compensation was, is, or will be directly or indirectly related to the specific recommendation(s) or view(s) in this report.
Terms & conditions and other disclosures:
ICICI Securities Limited (ICICI Securities) is a full-service, integrated investment banking and is, inter alia, engaged in the business of stock brokering and distribution of financial products. ICICI Securities
is a wholly-owned subsidiary of ICICI Bank which is India’s largest private sector bank and has its various subsidiaries engaged in businesses of housing finance, asset management, life insurance,
general insurance, venture capital fund management, etc. (“associates”), the details in respect of which are available on www.icicibank.com.
ICICI Securities is one of the leading merchant bankers/ underwriters of securities and participate in virtually all securities trading markets in India. We and our associates might have investment banking
and other business relationship with a significant percentage of companies covered by our Investment Research Department. ICICI Securities generally prohibits its analysts, persons reporting to analysts
and their relatives from maintaining a financial interest in the securities or derivatives of any companies that the analysts cover.
The information and opinions in this report have been prepared by ICICI Securities and are subject to change without any notice. The report and information contained herein is strictly confidential and
meant solely for the selected recipient and may not be altered in any way, transmitted to, copied or distributed, in part or in whole, to any other person or to the media or reproduced in any form, without
prior written consent of ICICI Securities. While we would endeavour to update the information herein on a reasonable basis, ICICI Securities is under no obligation to update or keep the information
current. Also, there may be regulatory, compliance or other reasons that may prevent ICICI Securities from doing so. Non-rated securities indicate that rating on a particular security has been suspended
temporarily and such suspension is in compliance with applicable regulations and/or ICICI Securities policies, in circumstances where ICICI Securities might be acting in an advisory capacity to this
company, or in certain other circumstances.
This report is based on information obtained from public sources and sources believed to be reliable, but no independent verification has been made nor is its accuracy or completeness guaranteed. This
report and information herein is solely for informational purpose and shall not be used or considered as an offer document or solicitation of offer to buy or sell or subscribe for securities or other financial
instruments. Though disseminated to all the customers simultaneously, not all customers may receive this report at the same time. ICICI Securities will not treat recipients as customers by virtue of their
receiving this report. Nothing in this report constitutes investment, legal, accounting and tax advice or a representation that any investment or strategy is suitable or appropriate to your specific
circumstances. The securities discussed and opinions expressed in this report may not be suitable for all investors, who must make their own investment decisions, based on their own investment
objectives, financial positions and needs of specific recipient. This may not be taken in substitution for the exercise of independent judgment by any recipient. The recipient should independently evaluate
the investment risks. The value and return on investment may vary because of changes in interest rates, foreign exchange rates or any other reason. ICICI Securities accepts no liabilities whatsoever for
any loss or damage of any kind arising out of the use of this report. Past performance is not necessarily a guide to future performance. Investors are advised to see Risk Disclosure Document to
understand the risks associated before investing in the securities markets. Actual results may differ materially from those set forth in projections. Forward-looking statements are not predictions and may
be subject to change without notice.
ICICI Securities or its associates might have managed or co-managed public offering of securities for the subject company or might have been mandated by the subject company for any other
assignment in the past twelve months.
ICICI Securities or its associates might have received any compensation from the companies mentioned in the report during the period preceding twelve months from the date of this report for services
in respect of managing or co-managing public offerings, corporate finance, investment banking or merchant banking, brokerage services or other advisory service in a merger or specific transaction.
ICICI Securities or its associates might have received any compensation for products or services other than investment banking or merchant banking or brokerage services from the companies
mentioned in the report in the past twelve months.
ICICI Securities encourages independence in research report preparation and strives to minimize conflict in preparation of research report. ICICI Securities or its analysts did not receive any compensation
or other benefits from the companies mentioned in the report or third party in connection with preparation of the research report. Accordingly, neither ICICI Securities nor Research Analysts have any
material conflict of interest at the time of publication of this report.
It is confirmed that Pankaj Pandey Research Analysts of this report have not received any compensation from the companies mentioned in the report in the preceding twelve months.
Compensation of our Research Analysts is not based on any specific merchant banking, investment banking or brokerage service transactions.
ICICI Securities or its subsidiaries collectively or Research Analysts do not own 1% or more of the equity securities of the Company mentioned in the report as of the last day of the month preceding the
publication of the research report.
Since associates of ICICI Securities are engaged in various financial service businesses, they might have financial interests or beneficial ownership in various companies including the subject
company/companies mentioned in this report.
ICICI Securities Ltd. | Retail Equity Research


© Copyright 2026