
Daily Calls - Moneycontrol
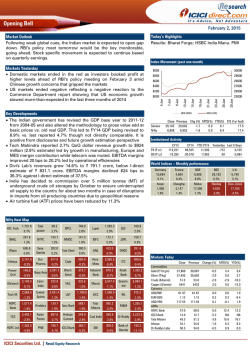
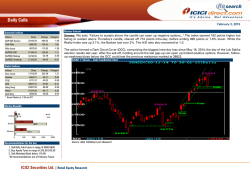
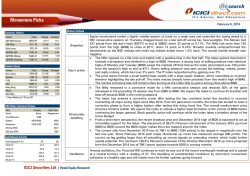
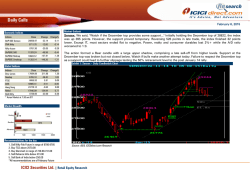
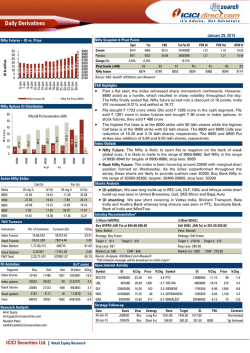
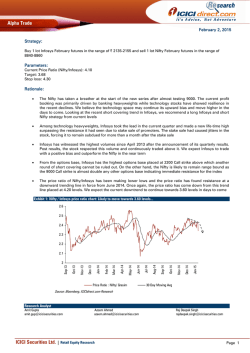
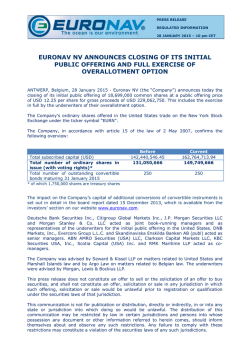
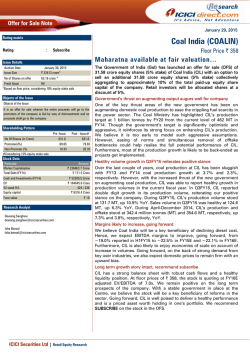
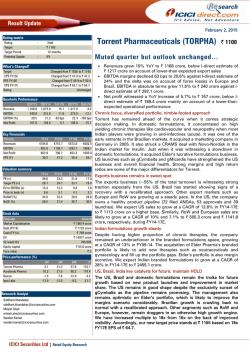
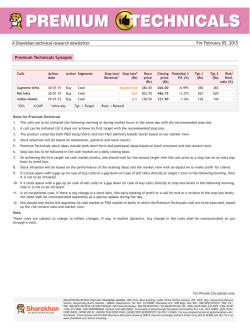
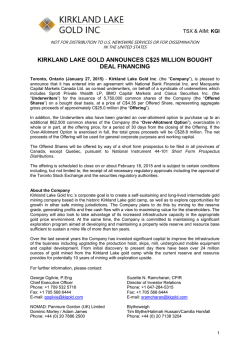
Daily Calls
January 30, 2015
Market Outlook
Domestic Indices
Indices
Close
Change
Change%
29681.77
122.59
0.41
8952.35
38.05
0.43
8986.30
19.20
0.21
S&PBSE 500
11474.52
S&PBSE Midcap
10771.08
19.17
-37.36
0.17
-0.35
S&PBSE Smallcap
11378.75
9.64
0.08
S&P BSE Sensex
CNX Nifty
Nifty future
Sensex: We said, "Doji can prove a turning point if January expiry settles below its bottom ... " Down 181 points initially, the
index based out holding initial lows. Avoiding closing below Wednesday's low, it surged in late trade and finished 123 points or
0.4% higher. While the Realty Index added 3%, oil & gas, pharma and FMCG gained 1%+. However, the A/D ratio also ended
negative.
The action formed a Counter Attack Bull candle, with lower high-low but still indicating Bulls resolve to remain in control. It can
be positive on follow-up strength and close above the candle's head. As the breadth was missing, and the broader markets
ended flat to negative, failure to sustain above the candle's head can open up negative trading options.
Exhibit 1: Sensex – Daily Candlestick Chart
Global Indices
Indices
Close
17416.85
Dow Jones
Nasdaq
4683.41
6810.60
FTSE
DAX
10737.87
24592.55
Hang Seng
Nikkei
17708.17
9016.00
SGX Nifty
* Asian Market at 7:30 am.IST
Change
225.48
45.41
-15.34
26.90
-0.88
112.60
33.00
Change%
1.31
0.98
-0.22
0.25
0.00
0.64
0.37
Market Breadth
38
131
Unchg
NSE
BSE
611
Decline
553
Advance
0
500
1453
1423
1000
1500
Recommendations for the day
1. Sell Nifty Feb Future in range of 9045-9050
2. Buy Bharat Forge above 1050.00
3. Buy Ambuja Cement in range of 255.00-256.00
4. Sell PNB below 200.00
*All recommendations are of February Future
Source: ASA, ICICIdirect.com Research
ICICI Securities Ltd. | Retail Equity Research
Exhibit 2: Nifty Future – Daily Candlestick Chart
CNX Nifty (Cash Levels) Technical Picture
Nifty
Trend
Intraday
Range bound
Short Term
Up
Support
8930-8900
8600
Resistance
8990-9020
9200
Trend Reversal
8600
20 Days EMA
8593
200 days EMA
7816
Nifty Future Recommendations
CMP :
8986.30
Comment : ‘Feb Future premium decreased from 53
points to 34. Avoids –ve follow-up to
Downward Bar Reversal, ‘Feb to test 9000mark. Reverse if holds 8960-70
Action :
Sell in the range of 9045-9050
Targets :
9015/8990/Lower
Stop-loss :
9065.00
Source: ASA, ICICIdirect.com Research
ICICI Securities Ltd. | Retail Equity Research
Page 2
Trend Scanner
Global Currencies
Spot
Positive Trends
Close
Prev.close
% Chg
Rupee (|)
61.873
61.405
-0.76
Scrip Name
Dollar Index
94.605
94.782
-0.19
Bharat Heavy Electricals Ltd
Euro
1.133
1.132
0.12
British Pound
1.508
1.507
Japanese Yen
117.970
Australian ($)
0.779
Swiss Franc
0.923
Candlestick Patterns
Close
% Change
10-day SMA
Delivery (%)
287.90
3.10
280.03
54.67
ACC Ltd
1582.95
2.54
1541.07
58.46
0.09
Larsen & Toubro Ltd
1723.90
1.50
1660.33
56.82
118.290
0.29
Tata Chemicals Ltd
450.25
2.13
443.16
60.32
0.776
0.27
Tech Mahindra Ltd
2904.40
1.08
2813.06
57.28
0.924
0.13
Bearish Candlestick Formations
Bullish Engulfing
Bearish Engulfing
Scrip Name
Century Textile
Patel Engineering
Ambuja Cement
Scrip Name
Close
% Change
10-day SMA
Delivery (%)
159.45
-3.97
160.88
51.66
Close
573.0
Aurobindo Pharma
PNB
199.7
255.4
SKS Micro Finance
425.8
1220.6
India 10 year
7.71
7.71
US 10 Year
1.75
1.75
EURO 10 Year
0.36
0.35
Piercing Line
GBP 10 Year
1.42
1.46
JPY 10 Year
L&T
1730.0
0.29
0.30
PTC
99.9
Commodities
US Dollar
Close
Prev. Close
%Chg
Gold/ounce
1260.09
1257.27
0.24
Copper /ton
5433
5519.5
-0.07
Brent Crude/barrel
48.99
49.13
-0.37
Stocks falling for 5 days & stochastic oversold
Scrip Name
Scrip Name
Institutional Activity
Cash Segment (| Cr)
29-Jan-15
FII
1,723.8
DII
-1,680.1
28-Jan-15
1,723.2
-1,292.7
27-Jan-15
953.5
-783.3
23-Jan-15
2,020.0
-1,300.0
22-Jan-15
592.8
-578.5
ICICI Securities Ltd. | Retail Equity Research
BPCL
734.0
Tata Motors
599.0
Oversold Stocks
Stocks rising for 5 days & stochastic overbought
Thermax
349.4
Bearish Continuation pattern
Previous Yield (%)
Overbought Stocks
Close
295.0
Closing Yield (%)
Idea Cellular Ltd
Scrip Name
Sun Pharma Advanced R
98.0
Bullish Continuation pattern
Arvind
Negative Trends
Global Treasury Yields
Bullish Candlestick Formations
LTP
Stochastic
1185
84.34
LTP
Stochastic
PVR
670.6
11.74
Biocon
409.9
17.3
Note: For Candlestick pattern description refer towards the end of
the report.
Stocks hitting 52 week high
Scrip Name
Cipla
LTP
695.6
FDC
167.4
HPCL
638.85
SRF
Titan
966
441.5
Page 3
Stock recommendations for the day
Exhibit 3: Bharat Forge (BHAFOR)
Daily Candlestick Chart
Short term range breakout and price sustaining above 13 days EMA signalling
continuation of positive trend
Bharat Forge (BHAFOR) February Future
CMP
1049.80
Comment : Short term range breakout and price
sustaining above 13 days EMA and RSI in
uptrend taking support at its nine period's
average in the daily chart
Action :
Buy above 1050.00
Targets :
1066/1075/Higher
Stop-loss :
1041.00
RSI in uptrend taking support at its nine period's average in the daily chart
Source: Bloomberg, ICICIdirect.com Research
ICICI Securities Ltd. | Retail Equity Research
Page 4
Exhibit 4: Ambuja Cement (GUJAMB)
Daily Candlestick Chart
Price breakout above the bullish flag pattern and taking support at the 8 days EMA
indicating further upsides in coming sessions
Ambuja Cement (GUJAMB) February Future
CMP
256.95
Comment : Price breakout above the bullish flag pattern
and taking support at the 8 days EMA and
MACD in rising trend forming higher high in
daily chart
Action :
Buy in the range of 255.00-256.00
Targets :
260.50/263/Higher
Stop-loss :
253.00
MACD in rising trend forming higher high in daily chart
Source: Bloomberg, ICICIdirect.com Research
ICICI Securities Ltd. | Retail Equity Research
Page 5
Exhibit 5: PNB (PUNBAN)
Daily Candlestick Chart
PNB (PUNBAN) February Future
CMP
200.85
Comment : Short term trendline breakdown in the daily
chart and RSI giving sell signal taking
resistance at its nine period's average in the
daily chart
Action :
Sell below 200.00
Targets :
196.0/194.0/Lower
Stop-loss :
202.30
Short term trendline breakdown in the daily chart
signalling continuation of bearish bias in the short term
RSI in sell mode taking resistance at its nine period’s average in the daily chart in daily charts
Source: Bloomberg, ICICIdirect.com Research
ICICI Securities Ltd. | Retail Equity Research
Page 6
Previous Day’s Performance
Scrip
Nifty
HPCL
REC
JSW Steel
Product
Future
Future
Future
Future
Strategy
Sell
Buy
Buy
Sell
Recommended Price
In range of 8930-8940
In range of 593.5-594.50
In range of 338.50-339.50
below 993.0
Targets
8900/8880/604.5/609.5/+
345/348/+
980/972/-
SL
8845.00
588.50
336.00
1001.00
Gain/Loss %*
2.70
1.30
Comment
No trade
No trade
Target 2 achieved
Target 1 achieved
* Return Opportunity
Nifty Points gained for the day: 0 points
Gains over last 196 days: 577 points
Stock profits: Avg 2.00% per trade
(Cum. Profits over last 196 days:271.10%)
Strike Rate for the day: 2/2
(Cum strike rate over 196 days: 260/433
NOTE: The follow-up and performance review table of the strategies indicates the profit opportunity that was available in the strategies. Individual profits may vary,
depending upon the entry and exit price and stop losses
ICICI Securities Ltd. | Retail Equity Research
Page 7
Support and Resistance Table (Cash Levels)
SCRIP
SENSEX
CLOSE
S1
S2
S3
R1
R2
R3
TREND
29681.77
29641
29550.4
29459.85
29822.15
29914.35
30006.5
+ve
NIFTY
8952.35
8939.55
8913.20
8886.85
8992.25
9020.00
9047.75
+ve
ACC
1582.95
1576.20
1562.50
1548.85
1603.55
1613.40
1623.25
+ve
583.40
581.10
571.45
561.80
600.35
607.70
615.05
+ve
+ve
ADANI ENTER.
ADANI POWER
ADITYA BIRLA
ALLAHABAD BANK
ANDHRA BANK
51.60
51.30
50.60
49.95
52.70
53.35
54.05
1824.80
1811.35
1803.70
1796.05
1824.75
1831.45
1838.10
-ve
122.40
119.55
118.70
117.85
123.00
124.70
126.40
-ve
-ve
90.15
88.80
88.20
87.60
90.55
91.40
92.25
1359.35
1336.10
1307.95
1279.80
1367.90
1383.80
1399.75
APOLLO TYRES
234.95
233.55
230.70
227.85
239.25
241.65
244.05
+ve
ARVIND
295.00
291.10
284.00
276.90
305.35
307.05
308.80
+ve
65.95
64.35
63.75
63.20
66.35
67.35
68.35
881.30
858.15
850.55
842.90
885.80
899.65
913.45
AUROBINDO PHARMA
1221.55
1214.90
1201.65
1188.45
1241.35
1247.35
1253.35
+ve
BAJAJ AUTO
+ve
APOLLO HOSPITALS
ASHOK LEYLAND
ASIAN PAINTS
-ve
-ve
-ve
2404.70
2402.00
2391.85
2381.75
2422.25
2431.35
2440.50
BOB
217.15
213.90
212.00
210.15
218.30
220.50
222.70
-ve
BOI
280.80
276.25
274.65
273.05
282.65
285.85
289.05
-ve
BATA INDIA
1460.95
1458.75
1449.90
1441.05
1476.50
1486.50
1496.55
+ve
BHARAT FORGE
1042.35
1037.55
1026.55
1015.55
1059.55
1068.25
1077.00
+ve
733.85
730.10
722.55
715.00
745.20
751.70
758.15
+ve
BPCL
BHARTI AIRTEL
375.80
365.75
359.70
353.70
374.45
378.80
383.20
-ve
BIOCON
409.85
408.85
407.20
406.15
412.10
413.75
414.80
Neutral
CAIRNS INDIA
234.70
231.25
229.75
228.25
234.75
236.45
238.20
-ve
CANARA BANK
470.75
465.00
461.35
457.65
470.80
473.70
476.60
-ve
CENTURY TEXT.
570.55
568.55
563.65
558.80
578.25
584.10
590.00
+ve
CESC
727.60
725.55
719.80
714.10
737.00
741.20
745.45
+ve
CHAMBAL FERT.
CIPLA
COAL INDIA
61.95
60.80
60.50
60.20
62.15
62.85
63.50
-ve
697.45
685.35
681.70
678.10
698.05
704.40
710.75
-ve
-ve
374.95
366.20
363.10
360.05
373.95
377.85
381.70
1888.90
1874.85
1868.70
1862.60
1892.60
1901.50
1910.35
-ve
CROMPTON GREAVES
187.90
186.30
185.05
183.85
188.30
189.30
190.30
-ve
DABUR INDIA
258.40
257.30
254.90
252.50
262.10
263.60
265.10
+ve
80.85
80.65
80.05
79.50
81.80
82.50
83.20
+ve
COLGATE PALM.
DISH TV
ICICI Securities Ltd. | Retail Equity Research
Page 8
SCRIP
DIVI'S LAB.
DLF
DR.REDDY'S LAB.
CLOSE
S1
S2
S3
R1
R2
R3
TREND
1768.30
1764.35
1752.60
1740.80
1787.90
1802.60
1817.35
+ve
166.65
166.10
164.20
162.30
169.85
172.35
174.80
+ve
3363.30
3340.60
3298.20
3255.75
3425.40
3443.65
3461.85
+ve
EXIDE IND.
193.80
191.50
189.15
186.80
194.40
195.80
197.25
-ve
FEDERAL BANK
144.25
142.90
142.20
141.55
144.45
145.25
146.05
-ve
Neutral
FUTURE RETAIL
113.20
112.30
111.70
110.65
113.50
114.10
115.10
GAIL
423.10
422.30
419.50
416.65
427.95
430.40
432.80
5625.25
5592.70
5560.20
5524.25
5657.65
5690.15
5726.15
719.05
711.80
707.90
703.95
720.65
725.10
729.50
17.30
17.20
17.00
16.80
17.60
17.75
17.90
1090.05
1076.75
1064.35
1051.95
1091.70
1099.20
1106.65
315.05
314.60
312.40
310.20
318.95
321.30
323.60
3931.90
3896.95
3872.35
3851.65
3946.15
3970.70
3991.45
263.10
259.30
255.15
251.00
263.05
264.95
266.85
HCL TECH
1648.95
1617.65
1603.75
1589.80
1644.55
1658.00
1671.45
-ve
HDFC BANK
1095.00
1090.25
1080.35
1070.45
1110.05
1120.30
1130.50
+ve
GLAXO SMITH.C.H.
GLENMARK PHARMA.
GMR INFRA.
GODREJ CONSUMER
GODREJ IND.
GRASIM
HAVELL'S INDIA
+ve
Neutral
-ve
+ve
-ve
+ve
Neutral
-ve
HDFC
1315.55
1292.65
1277.20
1261.75
1316.90
1329.05
1341.15
-ve
HERO MOTO
2876.50
2876.95
2866.50
2856.10
2897.85
2911.55
2925.30
+ve
HEXAWARE TECH.
220.35
217.40
215.45
213.55
220.50
222.10
223.65
-ve
HINDALCO
142.40
141.80
140.65
139.45
144.10
145.00
145.85
+ve
+ve
HIND. UNILEVER
941.60
940.15
934.75
929.35
950.95
954.40
957.85
HPCL
636.60
631.35
621.40
611.45
651.25
659.25
667.20
+ve
HINDUSTAN ZINC
174.70
173.80
172.20
170.55
177.05
177.90
178.70
+ve
HDIL
96.50
95.10
91.80
88.55
101.65
102.75
103.85
+ve
380.30
375.95
372.95
369.95
380.10
382.15
384.20
-ve
72.75
71.85
71.40
70.95
73.05
73.65
74.25
-ve
IDEA CELLULAR
159.45
157.00
154.30
151.65
160.10
161.65
163.20
-ve
NSE INFRA DEV FINANC
170.60
169.00
167.65
166.25
171.10
172.15
173.20
37.75
37.70
37.50
37.30
38.10
38.30
38.50
+ve
INDUSIND BANK
876.05
874.35
870.35
866.35
882.35
887.80
893.25
+ve
INDIA CEMENTS
112.00
111.65
110.15
108.65
114.65
116.05
117.40
+ve
INDRAPRASTHA GAS
470.20
466.00
462.85
459.70
471.25
473.90
476.50
-ve
IOC
348.35
346.70
343.70
340.65
352.70
355.15
357.55
+ve
IOB
59.55
59.45
58.90
58.35
60.50
60.95
61.40
+ve
ICICI BANK
IDBI
NSE IND.FIN.CORP.OF
ICICI Securities Ltd. | Retail Equity Research
-ve
Page 9
SCRIP
IB REAL ESTATE
CLOSE
S1
S2
S3
R1
R2
R3
TREND
78.50
78.00
76.60
75.25
80.75
81.40
82.10
2145.50
2137.70
2132.10
2126.00
2148.80
2154.40
2160.50
IRB INFRA.
270.30
269.55
266.50
263.40
275.65
280.55
285.40
+ve
ITC
+ve
INFOSYS
+ve
Neutral
370.20
368.80
365.80
362.80
374.80
376.25
377.75
JAIPRAKASH ASS.
26.10
25.65
25.25
24.90
26.15
26.45
26.70
-ve
J.P.POWER VENT.
11.45
11.25
11.15
11.10
11.45
11.55
11.65
-ve
Neutral
JAIN IRRIGATION
65.65
65.45
65.15
64.70
66.05
66.40
66.80
JINDAL ST&POW
157.40
156.65
154.70
152.80
160.50
161.70
162.95
+ve
JSW ENERGY
119.85
119.30
118.20
117.15
121.50
122.55
123.60
+ve
NSE JSW STEEL
997.15
982.75
976.00
969.25
994.95
1001.05
1007.15
-ve
JUBILANT FOOD
1417.40
1389.15
1377.65
1366.15
1415.50
1428.65
1441.80
-ve
-ve
KARNATAKA BANK
142.30
140.20
138.65
137.10
143.00
144.40
145.80
KOTAK MAH.BANK
1331.40
1319.15
1308.30
1297.45
1334.20
1341.70
1349.25
-ve
L&T
1723.90
1719.60
1708.25
1696.85
1742.30
1756.55
1770.80
+ve
LIC HOUSING
490.35
487.50
483.05
478.55
490.90
492.60
494.30
NSE LUPIN
1554.55
1550.35
1539.85
1529.40
1571.35
1580.65
1589.95
+ve
M&M
1296.80
1279.50
1271.75
1264.00
1298.25
1307.65
1317.05
-ve
MARUTI SUZUKI
3688.80
3662.20
3644.55
3626.90
3696.20
3713.20
3730.20
203.50
202.55
201.20
199.55
205.25
206.60
208.30
Neutral
Neutral
MCLEOD RUSSEL
M&M FIN.SERV.
MRF
NSE NHPC
NMDC
-ve
-ve
245.25
244.30
242.45
240.95
248.05
249.90
251.40
39901.50
39884.15
39758.90
39633.65
40134.65
40336.05
40537.40
19.70
19.50
19.30
19.05
19.70
19.80
19.90
-ve
140.15
138.80
138.05
137.30
140.25
141.00
141.75
-ve
+ve
NSE NTPC
141.85
141.05
140.20
139.30
141.85
142.25
142.65
-ve
ONGC
351.90
347.75
345.80
343.80
351.75
353.75
355.75
-ve
OBC
281.15
260.45
258.55
256.65
284.45
296.45
308.50
-ve
PETRONET LNG
187.70
186.00
185.05
184.10
188.10
189.15
190.15
-ve
POWER FINANCE
296.00
295.90
293.55
291.15
300.65
303.85
307.00
+ve
POWER GRID
148.80
147.60
146.95
146.25
148.80
149.40
149.95
-ve
99.30
98.85
97.80
96.80
100.95
101.90
102.85
+ve
POWER TRADING
PNB
199.10
195.85
193.80
191.75
200.35
202.60
204.85
-ve
RANBAXY
709.20
706.30
699.05
691.85
720.75
731.00
741.25
+ve
RCOM
REL. CAPITAL
ICICI Securities Ltd. | Retail Equity Research
78.70
77.85
76.95
76.05
78.95
79.50
80.05
-ve
466.15
462.00
458.85
455.70
467.50
470.25
472.95
-ve
Page 10
SCRIP
CLOSE
S1
S2
S3
R1
R2
R3
TREND
RELIANCE INFRA.
479.50
477.65
475.60
472.20
481.80
483.85
487.25
Neutral
RELIANCE
929.40
926.50
919.60
912.70
940.30
946.25
952.20
+ve
63.45
63.35
63.05
62.75
63.95
64.40
64.90
+ve
340.25
338.25
335.15
329.85
344.50
347.65
352.90
78.70
78.60
78.05
77.55
79.70
80.15
80.60
201.45
197.25
195.05
192.85
201.00
202.90
204.75
SHRIRAM TRANS.
1159.90
1148.75
1140.20
1123.50
1165.85
1174.35
1191.05
SIEMENS
1055.95
1045.35
1035.40
1025.45
1056.75
1062.45
1068.15
-ve
327.00
323.55
321.35
319.15
327.80
329.90
332.05
-ve
RELIANCE POWER
REC
SAIL
SESA GOA
SBI
Neutral
+ve
-ve
Neutral
SUN PHARMA
919.80
917.20
906.70
896.20
938.20
948.45
958.75
+ve
SUN TV
414.85
412.55
406.80
401.05
424.05
428.00
431.90
+ve
SYNDICATE BANK
121.90
120.45
119.50
118.55
122.20
123.05
123.95
-ve
TATA CHEMICALS
450.25
448.95
445.20
441.45
456.45
458.85
461.20
+ve
TATA MOTOR DVR
364.15
358.25
353.15
348.10
364.10
367.05
370.00
-ve
TATA MOTORS
598.60
595.95
590.90
585.90
606.00
610.40
614.75
+ve
TATA POWER
88.15
86.85
86.15
85.45
88.00
88.55
89.15
-ve
158.25
156.80
156.20
155.65
158.50
159.35
160.25
-ve
TCS
2544.65
2543.35
2529.40
2515.45
2571.25
2582.00
2592.70
+ve
TECH MAHINDRA
2904.40
2903.75
2890.00
2876.25
2931.25
2951.35
2971.45
+ve
TATA GLOBAL BEV.
TATA STEEL
390.40
385.25
382.90
380.50
389.60
391.80
393.95
-ve
TITAN IND.
441.80
439.45
434.90
430.30
448.65
457.95
467.20
+ve
UCO BANK
76.75
75.80
75.40
74.95
77.05
77.65
78.30
3162.75
3156.50
3141.05
3125.55
3187.45
3204.60
3221.70
UBI
215.95
211.75
208.50
205.25
217.40
220.25
223.10
-ve
UNITED BREW.
988.10
971.45
958.10
944.75
988.90
997.65
1006.40
-ve
UNITED PHOSPH.
365.20
363.05
358.75
354.45
371.65
374.45
377.20
+ve
17.85
17.65
17.30
16.90
18.40
18.55
18.65
+ve
ULTRATECH CEMENT
UNITECH
-ve
+ve
VOLTAS
276.00
273.75
272.05
268.60
277.05
278.70
282.20
WIPRO
602.70
596.85
592.75
588.70
604.20
607.85
611.55
-ve
NSE YES BANK
874.25
868.20
863.05
857.85
876.15
880.10
884.10
-ve
ZEE
386.05
382.40
380.80
379.20
386.10
387.95
389.85
-ve
ICICI Securities Ltd. | Retail Equity Research
Neutral
Page 11
NOTES:
•
•
•
•
•
•
•
Please execute the recommendation within the levels provided in the report
Once the recommendation is executed, it is advisable to keep strict stop loss as provided in the report
Avoid entering into the recommendation in the first 5 minutes of trade
If the recommendation opens near the target levels due to gap up/gap down opening, then the
recommendation is considered not initiated
The recommendations are valid only for the day and should be squared off by the end of the day
Only stocks in derivatives segment have been considered for daily trading
Medium to long-term prospects of a stock does not have any bearing on the daily view
Trading Portfolio allocation
•
•
•
•
It is recommended to spread out the trading corpus in a proportionate manner between the various technical
research products.
Please avoid allocating the entire trading corpus to a single stock or a single product segment
Within each product segment it is advisable to allocate equal amount to each recommendation.
For example: The ‘Daily Calls’ product carries 3 to 4 intraday recommendations. It is advisable to allocate
equal amount to each recommendation
ICICI Securities Ltd. | Retail Equity Research
Page 12
Recommended Trading Portfolio allocation
Products
Allocations
Product wise
Max allocation
allocation
in 1 stock
Return Objective
Number of Calls
Frontline Stocks
Mid-cap stocks
Duration
Daily Calls
8%
2-3%
3-4 Stocks
0.50-1%
2-3%
Intraday
Short term Delivery
6%
3-5%
7-10 p.m
4-5%
7-10%
Opportunity based
Weekly Calls
8%
3-5%
1-2 Stocks
5-7%
7-10%
1 Week
Weekly Technical
8%
3-5%
1-2 Stocks
5-7%
7-10%
1 Week
Monthly Call
15%
5%
2-3 Stocks
7-10%
10-15%
1 Month
Monthly Technical
15%
2-4%
5-8 Stocks
7-10%
10-15%
1 Month
Techno Funda
15%
5-10%
1-2 Stocks
10% and above
15% and above
6 Months
Technical Breakout
15%
5-10%
1-2 Stocks
10% and above
15% and above
3-6 Months
Cash in Hand
10%
-
-
-
-
-
100%
ICICI Securities Ltd. | Retail Equity Research
Page 13
Candlesticks Glossary:
Candlestick patterns describe the market sentiment for the specified period. Some of the formations suggest reversal of
sentiment (trend) and, therefore, are important for a chart reader. By themselves, the patterns do not carry any price target but
only an indication of change in market behaviour. More importance needs to be given to the placement of the pattern within
larger trend
Bullish Engulfing Line: A potential bottom reversal pattern. This pattern typically appears at the culmination of a decline or
downtrend. The market falls, and a black candle forms (ideally a small black candle). Next, a white real body wraps around the
prior session’s black body. Low of the pattern becomes short term support for prices
Piercing Line: Potential bottom reversal pattern. A black body forms in the downtrend. The market continues moving south on
the next session’s open but that session culminates in a white real body that closes (e.g. pierces) than half way or more into the
prior black body. Lowest low between two candles is referred to as technical support for prices
Hammer: A candlestick line which, during a downtrend, has a very long lower shadow and small real body (black or white) at
the top end of the session’s range. There should be no, or a very small, upper shadow. Pattern suggests buying support during
declines and needs confirmation in terms of sustainability of prices above head of the Hammer in following session
Bearish Engulfing Line: Potential top reversal signal. This two candlestick pattern emerges during a rally. A black candle real
body wraps around a white real body (classically a small white candle) Highest high between two candles becomes resistance
level for prices for future reference
Dark Cloud cover: A dark cloud cover forms a top reversal pattern. The first session should be a strong, white real body. The
second session’s price opens over the prior session’s high (or above the prior session’s close). By the end of the second session,
it closes near the low of the session and should fall well into the prior session’s white body. Pattern suggests that market has a
poor chance of rising immediately
Shooting Star: A single candlestick line during a rally in which there is a small real body (white or black) at the bottom end of
the session's range and a very long upper shadow. The candle line should also have little or no lower shadow. Pattern suggest
the trouble for prices overhead.
ICICI Securities Ltd. | Retail Equity Research
Page 14
Pankaj Pandey
Head – Research
[email protected]
ICICIdirect.com Research Desk,
ICICI Securities Limited,
1st Floor, Akruti Trade Centre,
Road No 7, MIDC
Andheri (East)
Mumbai – 400 093
[email protected]
ICICI Securities Ltd. | Retail Equity Research
Page 15
Disclaimer
ANALYST CERTIFICATION
We /I, Dharmesh Shah, Dipesh Daga, Nitin Kunte, Pabitro Mukherjee Research Analysts, authors and the names subscribed to this report, hereby certify that all of the views expressed in this research report
accurately reflect our views about the subject issuer(s) or securities. We also certify that no part of our compensation was, is, or will be directly or indirectly related to the specific recommendation(s) or view(s) in this
report.
Terms & conditions and other disclosures:
ICICI Securities Limited (ICICI Securities) is a full-service, integrated investment banking and is, inter alia, engaged in the business of stock brokering and distribution of financial products. ICICI Securities is a whollyowned subsidiary of ICICI Bank which is India’s largest private sector bank and has its various subsidiaries engaged in businesses of housing finance, asset management, life insurance, general insurance, venture
capital fund management, etc. (“associates”), the details in respect of which are available on www.icicibank.com.
ICICI Securities is one of the leading merchant bankers/ underwriters of securities and participate in virtually all securities trading markets in India. We and our associates might have investment banking and other
business relationship with a significant percentage of companies covered by our Investment Research Department. ICICI Securities generally prohibits its analysts, persons reporting to analysts and their relatives
from maintaining a financial interest in the securities or derivatives of any companies that the analysts cover.
The information and opinions in this report have been prepared by ICICI Securities and are subject to change without any notice. The report and information contained herein is strictly confidential and meant solely
for the selected recipient and may not be altered in any way, transmitted to, copied or distributed, in part or in whole, to any other person or to the media or reproduced in any form, without prior written consent of
ICICI Securities. While we would endeavour to update the information herein on a reasonable basis, ICICI Securities is under no obligation to update or keep the information current. Also, there may be regulatory,
compliance or other reasons that may prevent ICICI Securities from doing so. Non-rated securities indicate that rating on a particular security has been suspended temporarily and such suspension is in compliance
with applicable regulations and/or ICICI Securities policies, in circumstances where ICICI Securities might be acting in an advisory capacity to this company, or in certain other circumstances.
This report is based on information obtained from public sources and sources believed to be reliable, but no independent verification has been made nor is its accuracy or completeness guaranteed. This report and
information herein is solely for informational purpose and shall not be used or considered as an offer document or solicitation of offer to buy or sell or subscribe for securities or other financial instruments. Though
disseminated to all the customers simultaneously, not all customers may receive this report at the same time. ICICI Securities will not treat recipients as customers by virtue of their receiving this report. Nothing in
this report constitutes investment, legal, accounting and tax advice or a representation that any investment or strategy is suitable or appropriate to your specific circumstances. The securities discussed and opinions
expressed in this report may not be suitable for all investors, who must make their own investment decisions, based on their own investment objectives, financial positions and needs of specific recipient. This may
not be taken in substitution for the exercise of independent judgment by any recipient. The recipient should independently evaluate the investment risks. The value and return on investment may vary because of
changes in interest rates, foreign exchange rates or any other reason. ICICI Securities accepts no liabilities whatsoever for any loss or damage of any kind arising out of the use of this report. Past performance is not
necessarily a guide to future performance. Investors are advised to see Risk Disclosure Document to understand the risks associated before investing in the securities markets. Actual results may differ materially
from those set forth in projections. Forward-looking statements are not predictions and may be subject to change without notice.
ICICI Securities or its associates might have managed or co-managed public offering of securities for the subject company or might have been mandated by the subject company for any other assignment in the past
twelve months.
ICICI Securities or its associates might have received any compensation from the companies mentioned in the report during the period preceding twelve months from the date of this report for services in respect of
managing or co-managing public offerings, corporate finance, investment banking or merchant banking, brokerage services or other advisory service in a merger or specific transaction.
ICICI Securities or its associates might have received any compensation for products or services other than investment banking or merchant banking or brokerage services from the companies mentioned in the
report in the past twelve months.
ICICI Securities encourages independence in research report preparation and strives to minimize conflict in preparation of research report. ICICI Securities or its analysts did not receive any compensation or other
benefits from the companies mentioned in the report or third party in connection with preparation of the research report. Accordingly, neither ICICI Securities nor Research Analysts have any material conflict of
interest at the time of publication of this report.
It is confirmed that Dharmesh Shah, Dipesh Daga, Nitin Kunte, Pabitro Mukherjee Research Analysts of this report have not received any compensation from the companies mentioned in the report in the preceding
twelve months.
Compensation of our Research Analysts is not based on any specific merchant banking, investment banking or brokerage service transactions.
ICICI Securities or its subsidiaries collectively or Research Analysts do not own 1% or more of the equity securities of the Company mentioned in the report as of the last day of the month preceding the publication of
the research report.
Since associates of ICICI Securities are engaged in various financial service businesses, they might have financial interests or beneficial ownership in various companies including the subject company/companies
mentioned in this report.
ICICI Securities Ltd. | Retail Equity Research
Page 16

© Copyright 2026