
CR, NI, MN, CO, ZN, AND S STANDARDS FOR USE IN LASER
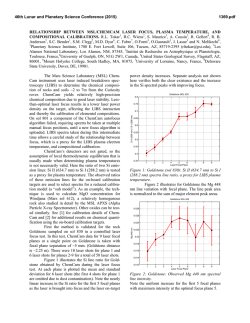
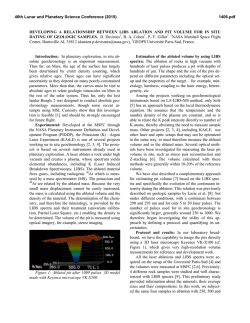
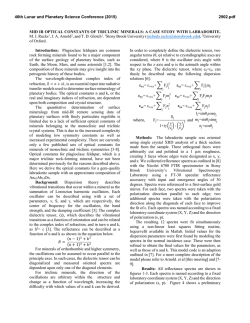
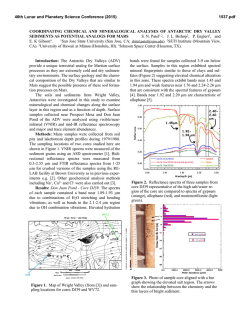
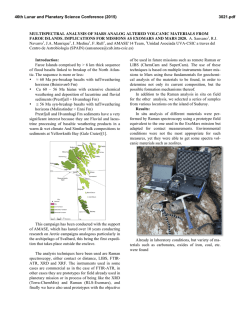
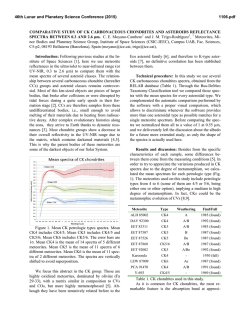
46th Lunar and Planetary Science Conference (2015)
2338.pdf
CR, NI, MN, CO, ZN, AND S STANDARDS FOR USE IN LASER-INDUCED BREAKDOWN
SPECTROSCOPY ON MARS. E. A. Breves1, L. B. Breitenfeld1, M. N. Ketley1, A. L. Roberts2, M. D. Dyar1, C. I.
Fassett1, E. C. Sklute1, K. H. Lepore1, G. J. Marchand1, J. M. Rhodes2, M. Vollinger2, S. A. Byrne1, M. C. Crowley1,
T. F. Boucher3, S. Mahadevan3, 1Dept. of Astronomy, Mount Holyoke College, South Hadley, MA 01075,
[email protected], 2Dept. of Geosciences, University of Massachusetts Amherst, Amherst MA 01003,
3
School of Computer Science, University of Massachusetts Amherst, Amherst MA 01003, USA.
Introduction: Laser-induced breakdown spectroscopy (LIBS) is being used by the ChemCam instrument on the Mars Science Laboratory rover Curiosity
to obtain UV, VIS, and VNIR atomic emission spectra
of surface rocks and soils [1,2]. LIBS quantitative
analysis is complicated by chemical matrix effects
related to abundances of neutral and ionized species in
the plasma, collisional interactions within plasma, laser-to-sample coupling efficiency, and self-absorption
[3]. Atmospheric composition and pressure also influence plasma intensity. Chemical matrix effects influence the ratio of intensity or area of an emission line to
the abundance of the element producing that line.
To overcome these effects, multivariate techniques such as partial least-squares regression (PLS)
have been utilized by the ChemCam team to predict
major element compositions (>1 wt.% oxide) of rocks
[4]. Because PLS utilizes all available explanatory
variables and eliminates multicollinearity, it generally
performs better than univariate methods for prediction
of major elements [1,2]. However, peaks arising from
emissions from trace elements are often dwarfed by
peaks of higher intensities from major elements and
may have low transition probabilities [5]. This can
result in multivariate predictions that use compatible
major elements to predict minor ones, e.g. use of K1+
lines to predict Rb1+. To better characterize and understamd matrix effects in geological samples, this project
focuses on creation of standards doped with varying
amounts of Cr, Ni, Mn, Co, Zn, and S. Integration of
these LIBS standard spectra into existing spectral libraries, when combined with multivariate analyses,
should produce improvements in accuracy of predicting these elements.
Background: Issues with geochemical camouflage
arise because minor and trace element cations can substitute into mineral sites occupied by major elements,
as long as their radii differ by less than ~15% and they
have the same charge. In such cases, multivariate techniques will tend to use stronger major element lines to
predict trace element concentrations, but concentrations thus predicted are only as good as the correlation
between the two elements that is seen in terrestrial
samples. This problem is magnified by the fact that
smaller emission lines from trace elements are often
dwarfed by intense lines from far more abundant major
elements. Some workers [6,7] have used univariate
analyses and special techniques that focus on spectral
regions where minor and trace element emissions occur to obtain accurate predictions of minor and trace
elements using LIBS.
Table 1. Bulk Rocks Used as Matrices for Doping
Name
Provenance
Lower Jurassic basalt from Newark SuperHolyoke
group, Massachusetts
Columbia River continental flood basalt colIdaho
lected in Moscow, Idaho by Mickey Gutner
Vinalhaven intrusive complex, Vinalhaven,
Maine
Maine
Sea Sand
Washed SiO2 sea sand from Fisher Scientific
50:50 by weight mixture of diopside and
Ultramafic
Globe olivine from [8]
Samples and Methods: This project used five matrics with very different bulk compositions (Table 1).
Exactly 10 g of NiO, Cr2O3, MnO2, CoO, ZnO, and
Fe2+SO4•7H2O were shatterboxed with 90 g of each
powdered matrix, resulting in 25 samples, each ~10
wt.% dopant. Those mixtures were then diluted with
additional aliquots of matrix to create mixtures of approximately 5, 1, 0.5, and 0.1 wt% and 500, 250, 100,
Figure 1. (top) LIBS spectral region around the 422.6 nm
Cr I peak showing increasing intensity with dopant amount.
(bottom) Example of a calibration curve for the 396.91 nm
peak in the Maine spectra shown above.
46th Lunar and Planetary Science Conference (2015)
50, and 10 ppm of dopant depending on the molecular
weight of the dopant. Each mixture was shatterboxed
for one minute to homogenize it and reduce the grain
size <45 µm. Pellets were pressed from powders into
1.5 cm diameter aluminum cups for LIBS analyses.
Aliquots of each mixture were also used for x-ray fluoresence analyses (XRF) in the laboratory at U Mass
[9], where samples were analyzed for major and trace
elements. Additional analyses will be undertaken using
other tehcniques as needed, such a Leco for S. LIBS
spectra were acquired from 30 shots on each of >5
locations on each pellet using a Mars-analog LIBS
instrument in the Mineral Spectroscopy Laboratory at
Mount Holyoke [10] under a 7-Torr CO2 atmosphere.
Data were processed using software with steps analogous to those used for ChemCam data [10], including
normalization to each of three wavelength regions corresponding to the three spectrometers.
Figure 2. Comparison of spectra for each sample with normalized intensity plotted on the same scale for all five matrices. The composition of the rock matrix affects the normalized peak intensity profoundly. This effect complicates
interpretation of trace and minor element lines.
Results: Figure 1 shows a portion of the UV spectrum where a Cr I peak falls at 422.6 nm. The peaks
increase in intensity with concentration, and the total
area of these peaks produces a useful calibration curve
for this granitic matrix. The ChemCam team has used
such univariate calibration curves to effectively model
major and trace element [6,7,11] concentrations for
Mars samples. The success of these calibrations depends on the availability of well-resolved, unoverlapped peaks diagnostic for the elements of inter-
2338.pdf
est that also have high transition probabilities. The
elements in this study have the following ionization
energies: 9.39 eV for Zn, 7.88 eV for Co, 7.64 eV for
Ni, 7.43 for Mn, 6.77 eV for Cr, and 10.36 eV for S.
The success of univariate calibrations is further dependent on having a close match between the matrix of
the standards and that of the unknown(s) or a broad
representation of different matrices in the training set.
In some cases, univariate calibrations cannot overcome
differences among matrics (e.g., Figure 2).
More specifically, Figure 2 documents the variations in spectral intensity that occur between matrices.
The figure shows normalized spectra but the unnormalized data also show interesting differences. The
sea sand produces the lowest intensity spectra in both
cases, perhaps due to poor coupling of the laser due to
composition. The un-normalized ultramafic spectra has
nearly double the raw intensity of the other four matrices, resulting in nearly the lowest normalized intensity,
again likely due to good coupling. Typically, normalized data are used for calibration because they produce
the lowest errors.
Implications: Just as calibrations for major element quantification for ChemCam have used numerous
stanards with varying bulk compositions, so too must
trace element analyses be dependent on representation
of a wide range of matrix types for calibrations. We are
continuing to build a broad calibration database for
analysis of minor and trace elements by LIBS, though
the task is extremely time-consuming and costly. We
plan to test proven calibration techniques such as use
of peak areas and masked wavelength ranges [3,6] on
our data set to improve prediction algorithms. Finally,
use of multivariate models that focus on well-selected
regions of the spectra where minor element emission
peaks are present will be used to optimize predictions
of minor and trace elements. The resultant calibration
will be useful in interpreting chemistry of Martian
rocks from extraterrestrial instruments such as ChemCam and Super Cam.
Acknowledgments: This work was supported by
NASA grants NNX09AL21G, NNX12AK84G, and
NNX14AG56G from the MFR Program.
References: [1] Wiens R. C. et al. (2012) Space
Sci. Revs., doi:10.1007/s11214-012-9902-4 [2] Maurice S. et al. (2012) Space Sci. Revs.,
doi:10.1007/s11214-012-9912-2. [3] Clegg S. M. et al.
(2009) Spectrochimica Acta Part B, 64, 79-88. [4]
Wiens R. C. (2013) Spectrochim. Acta B, 82, 1-27. [5]
Dyar M. D. et al. (2010) Spectrochim. Acta B, 66, 3956. [6] Ollila A. M. (2014) JGR, 119, 255-285. [7]
Fabre C. (2014) Spectrochim. Acta B, 99, 34-51. [8]
Byrne, S. (2015) this volume. [5] Rhodes J. M. (1988)
JGR, 93, 4453-4466. [10] Dyar M. D. et al. (2015) this
volume. [11] Lasue, J. et al. (2015) this meeting. [12]
Lepore K. H. (2015) this meeting.
© Copyright 2026