
MID IR OPTICAL CONSTANTS OF TRICLINIC MINERALS: A CASE
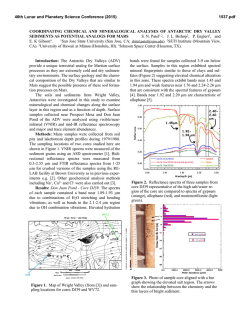
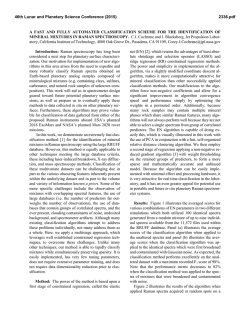
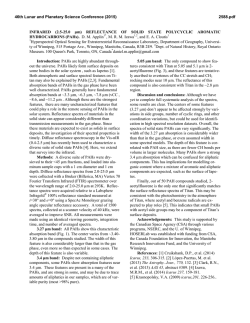
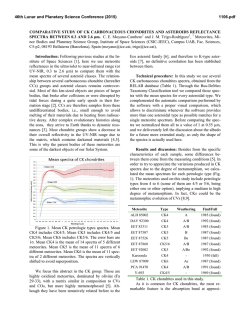
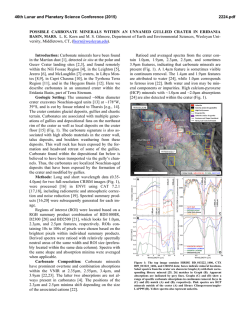
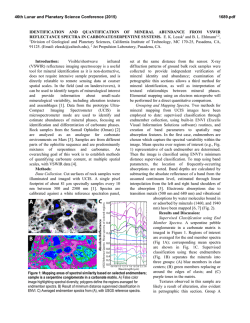
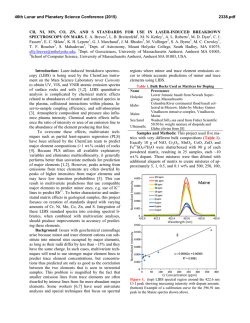
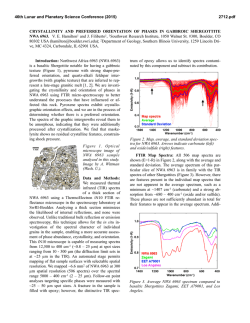
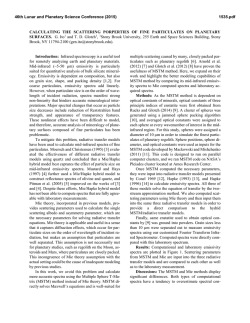
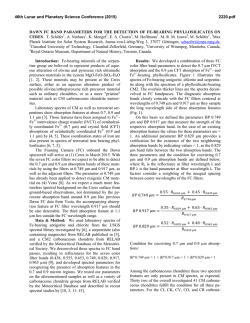
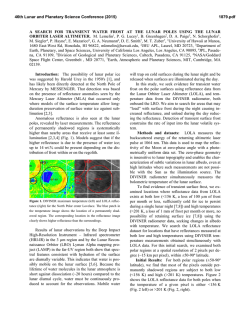
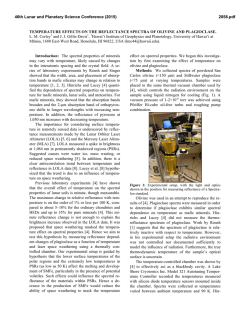
46th Lunar and Planetary Science Conference (2015)
2902.pdf
MID IR OPTICAL CONSTANTS OF TRICLINIC MINERALS: A CASE STUDY WITH LABRADORITE.
M. J. Rucks1, J. A. Arnold2, and T. D. Glotch1. 1Stony Brook University ([email protected]), 2University
of Oxford.
Introduction: Plagioclase feldspars are common
rock forming minerals found to be a major component
of the surface geology of planetary bodies, such as
Earth, the Moon, Mars, and some asteroids [1,2]. The
composition of these minerals may give insight into the
petrogenic history of these bodies.
The wavelength-dependent complex index of
refraction, 𝑛̃ = 𝑛 + 𝑖𝑘, is an essential input into radiative
transfer models used to determine surface mineralogy of
planetary bodies. The optical constants n and k, or the
real and imaginary indices of refraction, are dependent
upon both composition and crystal structure.
The quantitative determination of surface
mineralogy from mid-IR remote sensing data of
planetary surfaces with finely particulate regoliths is
limited due to a lack of sufficient optical constants of
minerals belonging to the monoclinic and triclinic
crystal systems. This is due to the increased complexity
of modeling low symmetry constants as well as
increased experimental complexity. There are currently
only a few published sets of optical constants for
minerals of monoclinic and triclinic symmetries [3-8].
Optical constants for plagioclase feldspar, which is a
major triclinic rock-forming mineral, have not been
determined previously for the reasons described above.
Here we derive the optical constants for a gem-quality
labradorite sample with an approximate composition of
An65Ab34Or1.
Background:
Dispersion
theory
describes
vibrational transitions that occur within a mineral as the
summation of Lorenzian harmonic oscillators. Each
oscillator can be described using with a set of
parameters, ν, S, and γ, which are respectively, the
center of frequency for the oscillation, the band
strength, and the damping coefficient [3]. The complex
dielectric tensor, 〈ε〉, which describes the vibrational
transitions as a function of orientation and can be related
to the complex index of refraction, and in turn n and k,
as ñ2= ε [3]. The reflectance can be described as a
function of n and k as shown in the equation below.
(𝑛 − 1)2 + 𝑘 2
𝑅=
(𝑛 + 1)2 + 𝑘 2
For minerals of orthorhombic and higher symmetry,
the oscillations can be assumed to occur parallel to the
principle axes. In such cases, the dielectric tensor can be
diagonalized and measured oriented spectra are
dependent upon only one of the diagonal elements.
For triclinic minerals, the direction of the
oscillations are arbitrary within the structure and
change as a function of wavelength, increasing the
difficulty with which values of n and k can be derived.
In order to completely define the dielectric tensor, two
angular terms (θ, φ) relative to crystallographic axes are
considered, where θ is the oscillator axis angle with
respect to the z axis and φ is the azimuth angle within
the xy plane. The dielectric tensor, where εij=εji, can
thusly be described using the following dispersion
relations [6]:
εxx = ε∞xx + ∑ Fj l2
j
εxy = ε∞xy + ∑ Fj lj mj
j
j
εyy =
ε∞xx + ∑ Fj m2
j
j
εyz = ε∞yz + ∑ Fj Fj mj n
εzz =
ε∞zz + ∑ Fj n2
j
j
εzx = ε∞zx + ∑ Fj nj l
where,
Fj =
j
j
Sj
ν
ν 2
1+iγ ( ) - ( )
νj
νj
lj =sinθj cosφj
and mj =sinθj sinφj
nj =cosθj
Methods: The labradorite sample was oriented
using single crystal XRD analysis of a thick section
made from the sample. Three orthogonal faces were
arbitrarily cut and polished to a 1 µm roughness,
creating 3 faces whose edges were designated as x, y,
and z. We collected reflectance spectra as outlined in [8]
with the Nicolet 6700 FTIR spectrometer in Stony
Brook
University’s
Vibrational
Spectroscopy
Laboratory using a FT-30 specular reflectance
accessory with input and emergence angles of 30
degrees. Spectra were referenced to a first-surface gold
mirror. For each face, two spectra were taken with the
polarization direction parallel to each edge; two
additional spectra were taken with the polarization
direction along the diagonals of each face to improve
the fit of ε. Each spectra was named according to a fixed
laboratory coordinate system (X, Y, Z) and the direction
of polarization (s, p).
The resulting 12 spectra were fit simultaneously
using a non-linear least squares fitting routine,
lsqcurvefit available in Matlab. Initial values for the
dispersion parameters were first found by modeling the
spectra in the normal incidence case. These were then
refined to obtain the final values for the parameters, as
well as those of n and k. This model code is an adaption
outlined in [7]. For a more complete description of the
model please refer to Arnold. et al [this meeting] and [79].
Results: All reflectance spectra are shown in
figures 1-3. Each spectra is named according to a fixed
laboratory coordinate system (X, Y, Z) and the direction
of polarization (s, p). Figure 4 shows a preliminary
46th Lunar and Planetary Science Conference (2015)
2902.pdf
estimate of the n and k values for two of the refractive
indices of labradorite.
References:[1] Moroz et al. (2000) Icarus, 147, 7993. [2] Shkuratov et al. (2005) Solar Syst. Res., 39, 4,
255-266. [3] Aronson et al. (1983) Appl. Op., 22, 24,
4093-4098[4] Aronson et al. (1986) Spectrochim. Acta,
42A, 2/3, 187-190. [5] Aronson et al. (1985) Ap. Opt.,
24, 8, 1200-1203. [6] Emsile A. G. and Aronson J. R.
(1983) J. Opt. Soc. Am., 73, 7, 916-919. [7] Arnold et
al. (2014) Am. Miner., 99, 1942-4955. [8] Hӧfer et al.
(2013) Vib. Spect. 67. [9] Hӧfer et al. (2014) Vib. Spect.
72, 111-118..
Figure 3 Shows reflectance spectra taken parallel to the edges, Rs
0 90 0 and Rp 0 90 0, and along the diagonals, Rs 0 90 45 and Rp
0 90 45 of the y-z face.
Figure 1 Shows reflectance spectra taken parallel to the edges, Rs
0 0 0 and Rp 0 0 0, and along the diagonals, Rs 45 0 0 and Rp 45
0 0 of the x-y face.
Figure 4 Shows the initial calculations for two pairs of optical
constants, n1 and n2, k1 and k2.
Figure 2 Shows reflectance spectra taken parallel to the edges, Rs
90 90 90 and Rp 90 90 90, and along the diagonals, Rs 90 90 45
and Rp 90 90 45 of the x-z face.
© Copyright 2026