
Identification and Quantification of Mineral Abundance from VSWIR
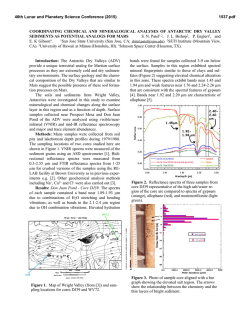
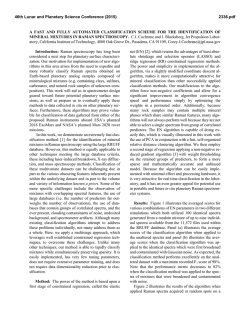
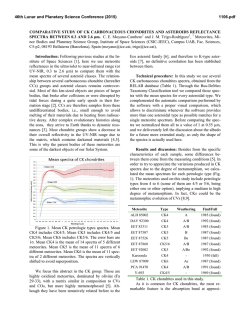
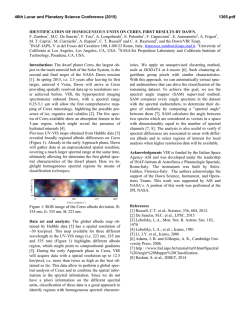
46th Lunar and Planetary Science Conference (2015)
1689.pdf
IDENTIFICATION AND QUANTIFICATION OF MINERAL ABUNDANCE FROM VSWIR
REFLECTANCE SPECTRA IN CARBONATE/SERPENTINE SYSTEMS. E. K. Leask1 and B. L. Ehlmann1,2,
1
Division of Geological and Planetary Sciences, California Institute of Technology, MC 170-25, Pasadena, CA,
91125. (Email: [email protected]), 2 Jet Propulsion Laboratory, Pasadena, CA.
Introduction:
Visible/shortwave
infrared
(VSWIR) reflectance imaging spectroscopy is a useful
tool for mineral identification as it is non-destructive,
does not require intensive sample preparation, and is
directly relatable to remote sensing data at coarser
spatial scales. In the field (and on landers/rovers), it
can be used to identify targets of mineralogical interest
and
provide
information
about
small-scale
mineralogical variability, including alteration textures
and assemblages [1]. Data from the prototype UltraCompact
Imaging
Spectrometer
(UCIS)
in
microspectrometer mode are used to identify and
estimate abundances of mineral phases, focusing on
identification and differentiation of carbonate phases.
Rock samples from the Samail Ophiolite (Oman) [2]
are analyzed as an analogue for carbonate
environments on Mars [3]. Samples are from different
parts of the ophiolite sequence and are predominantly
mixtures of serpentines and carbonates. An
overarching goal of this work is to establish methods
of quantifying carbonate content, at multiple spatial
scales, with VSWIR data [4].
Methods:
Data Collection. Cut surfaces of rock samples were
illuminated and imaged with UCIS. A single pixel
footprint of about 81 μm spectrally samples every 10
nm between 500 and 2500 nm [1]. Spectra are
calibrated against a white reference spectralon panel,
set at the same distance from the sensor. X-ray
diffraction patterns of ground bulk rock samples were
collected to provide independent verification of
mineral identity and abundance; examination of
petrographic thin sections allows a third method for
mineral identification, as well as interpretation of
textural relationships between mineral phases.
Elemental mapping using an electron microprobe will
be performed for a direct quantitative comparison.
Grouping and Mapping Spectra. Two methods for
mineral mapping from UCIS images have been
employed to date: supervised classification through
endmember collection, using built-in ENVI (Excelis
Visual Information Solutions software) routines, and
creation of band parameters to spatially map
absorption features. In the first case, endmembers are
chosen which capture the spectral variability within the
image. Mean spectra over regions of interest (e.g., Fig.
1) representative of each endmember are determined.
Then the image is classified using ENVI’s minimum
distance supervised classification. To map using band
parameters, the location of frequently-occurring
absorptions are noted. Band depths are calculated by
subtracting the absolute reflectance of a band from the
assumed continuum level, estimated through linear
interpolation from the left and right hand shoulders of
the absorption [5]. Electronic absorptions due to
transition metals (500 nm and 680 nm) and vibrational
absorptions by water molecules bound in
or adsorbed by minerals (1460, and 1940
nm) have been mapped [6, 7] (Fig. 2).
Results and Discussion:
Supervised Classification using End
Member Spectra. A serpentine pebble
conglomerate in a carbonate matrix is
imaged in Figure 1. Regions of interest
are averaged for the end member spectra
(Fig 1A); corresponding mean spectra
are shown in Fig. 1C. Supervised
classification using these endmembers
(Fig. 1B) separates the minerals into
three groups: (A) blue members in clast
centers; (B) green members replacing or
around the edges of clasts; and (C)
Figure 1: Mapping areas of spectral similarity based on selected endmembers;
purple tones in the matrix.
sample is a serpentine conglomerate in a carbonate matrix. A) False color
Textures observed in this sample are
image highlighting spectral diversity; polygons define the regions averaged for
likely a result of alteration, also evident
endmember spectra. B) Result of minimum distance supervised classification in
ENVI. C) Averaged endmember spectra from (A), with USGS reference spectra.
in petrographic thin section. Group A
46th Lunar and Planetary Science Conference (2015)
and some Group B members show absorptions around
910-950 nm, similar to pyroxene (Fig. 1C). Cyan and
blue both have low albedo, and minimal absorptions at
1400 and 1900 nm, indicating they are least altered.
The dark green endmember’s spectrum is very similar
to the USGS reference spectrum for antigorite, a
serpentine, and the light green has characteristics of
both pyroxene and antigorite, implying alteration or
mixing at <81 µm scale.
Absorptions at 2.16 and 2.34 μm in the dark
magenta region are likely caused by calcite’s Ca-CO32bonds [8]. The lighter pink region has very high albedo
expected of carbonate minerals, although its spectral
shape is more similar to lizardite than calcite or
magnesite, with a very deep, asymmetric absorption at
1.9 μm (Fig. 1C). In thin section, the matrix is very
fine-grained with some cloudiness; calcite may be
intermixed with extremely fine-grained serpentine.
Microprobe results should help to answer this question,
as analyses can be performed on a 5-10 μm scale.
Band Parameter Threshold Classification. Figure 2
demonstrates the band parameter method on a
magnesite vein sample. Fig. 2A shows a true color
image of the sample. Fig. 2B combines 3 band
parameters to highlight areas with different absorption
features. Colored regions in Fig. 2C come from
threshold values on similar parameter maps for
absorptions at 500, 680, and 1940 nm.
Mean spectra for each region are similar to
Figure 2: Mapping areas of spectral similarity based on band
parameter thresholds. A) True color image of magnesite sample.
B) False color image using band depth parameters. C) Colored
regions based on band depths (High, low, or moderate
absorption). D) Mean spectra from regions in (C), with USGS
reference spectra.
1689.pdf
magnesite overall, with a major absorption at 23002310 nm [8]. Absorptions at 1.4 and 1.9 μm are likely
due to H2O. The orange region absorbs strongly at
~700 nm and shorter wavelengths, while the light
green region only absorbs strongly at wavelengths
shorter than ~600 nm, indicating that these regions
contain different minerals. Green and orange areas are
concentrated along fractures, in cavities, and at the
surface. Blue regions are based on different strengths
of water-related absorptions at 1.4 μm and 1.9 μm. The
strength of these water-related absorptions may be
related to the water content of the sample, but may also
be a result of varying path length (e.g. larger fluid
inclusions in larger grains). Interior parts of the sample
map as cyan (strongest water absorptions), surrounded
by a rim of darker blue material with weaker waterrelated absorptions. Microprobe work should reveal
whether the difference is due to grain size, or if there is
a change in volatile content (estimated by missing
mass) between the blue tones.
Conclusions and Future Work:
UCIS hyperspectral images can map mineralogical
variation on the scale of ~80 μm, tracing small veins,
alteration textures, and differences in grain size.
Mineralogical units are presently defined on the basis
of spectral characteristics, corresponding to particular
endmembers. We will work to (1) improve mineral
identification of each unit using spectral data; (2)
calculate areal percent abundances, and (3) perform
microprobe mapping to provide a direct comparison
with IR image maps. Direct quantitative comparison
will allow spectral differences caused by grain size
changes to be separated from those caused by changing
mineralogy and/or coatings.
Images of this type taken on Mars would resolve
changes in fluid chemistry over time, as veins filled
with different minerals are identified. Detailed mineral
assemblages and textures would narrow down possible
temperature, pressure, and chemical conditions. If
these spectral signatures and mineralogical textures
can be tied to quantitative mineral abundances, modal
abundances can be used as tests for geochemical
models and volatile reservoirs can be catalogued.
Obtaining this kind of data about Martian systems
would significantly improve our understanding of past
environments and alteration processes on Mars, which
are intimately related to the presence of water on Mars.
References: [1] Van Gorp B. et al. (2014) J. Appl. Rem. Sens.
8, 084988 1-15. [2] Keleman P. B. & Matter J. (2008), PNAS, 105,
17295-17300. [3] Ehlmann B. L. & Mustard J.F, (2012) GRL, 39,
L11202 [4] Ehlmann B. L. et al. (2012) LPSC 43, abs 1471. [5]
Pelkey S. M. et al., (2007), JGR, 112, E08S14. [6] Bishop J. L. et al.
(2008) Clay Minerals, 43, 35-54. [7] Morris R. V. et al. (2000) JGR,
102, 1757-1817. [8] Gaffey S. J. (1987) JGR, 92, 1429–1440.
Acknowledgements: Thanks to the NASA Mars Fundamental
Research program (NNX12AB42G) for support.

© Copyright 2026