
Nickel Calibration for Use in Laser
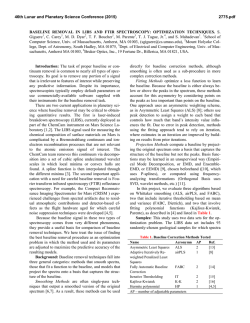
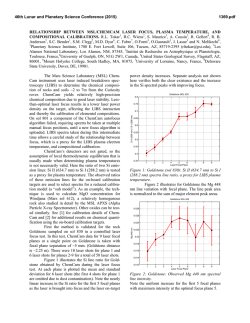
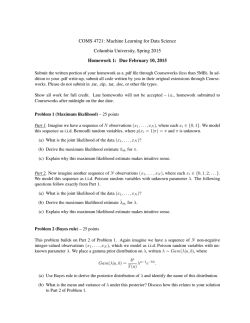
46th Lunar and Planetary Science Conference (2015)
2720.pdf
NICKEL CALIBRATION FOR USE IN LASER-INDUCED BREAKDOWN SPECTROSCOPY ON MARS.
K. H. Lepore1, T. F. Boucher2, E. A. Breves1, M. D. Dyar1, C. I. Fassett1, E. C. Sklute1, G. J. Marchand1, J. M.
Rhodes3, M. Vollinger3, S. A. Byrne1, L. B. Breitenfeld1, M. N. Ketley1, M. C. Crowley1, A. L. Roberts3, S. Mahadevan2, 1Dept. of Astronomy, Mount Holyoke College, South Hadley, MA 01075, [email protected],
2
School of Computer Science, University of Massachusetts Amherst, Amherst MA 01003, 3Dept. of Geosciences,
University of Massachusetts Amherst, Amherst MA 01003, USA.
Introduction: The influx of iron and stony-iron
meteorites and micrometeorites has enriched both Ni
and Fe in soils and sedimentary rocks on terrestrial
bodies. Although the Fe signal is obscured by its
common occurrence, high Ni abundance can be used to
measure meteoritic addition [1,2] and quantify the contribution from impacts. The ChemCam instrument on
the Mars Science Laboratory rover Curiosity has the
potential to quantify Ni abundances using laserinduced breakdown spectroscopy (LIBS) but a lack of
standards for Ni has until now hampered assessment of
the technique’s quantitative capabilities. This project
focuses on creation of laboratory calibration standards
and prediction models for determining Ni contents by
LIBS. When applied to Mars data, the results will improve our understanding of the distribution of Ni in
Martian soils and sedimentary rocks.
Samples and Methods: The LIBS technique is
known to be vulnerable to matrix effects, which permute the intensities and areas of emission peaks from
specific elements so they are not directly correlated
with elemental abundance. This problem complicates
development of calibrations because each emission
line manifests matrix effects in its own way. A calibration based on varying Ni concentrations in a single
rock matrix may be useful only in rocks with that same
matrix. Thus for broadest application to the variety of
bulk compositions that might be encountered on Mars,
a calibration for Ni must include rock matrices with
varying chemistries spanning the ranges of the other
nine major elements – essentially sampling a 10dimensional space. This project presents results from
doping five different rock types to create a broadlyapplicable calibration for predicting Ni on Mars.
Methods: Ten powders with varying Ni concentrations were prepared from each of the five matrices
listed in Table 1, as described in more detail in [3].
Aliquots of each mixture were used for x-ray fluorescence analyses (XRF) of major and trace elements using standard protocols [4]; careful calculations of mass
absorption coefficients are needed to produce good
data for the higher-concentration standards. Because
some of the rocks already contained some Ni (especially the ultramafic sample), the resultant samples had
measured concentrations of 43,000-49,000, 7700-9995,
3700-5400, 750-2200, 285-1780, 141-1566, 58-1454,
36-1416, and 8-1400 ppm Ni. Samples were pressed
Table 1. Univariate Model Results
Line
(nm)
Holyoke
Maine
Sea Sand
Idaho
Ultramafic
5 channels
305.18
300.48
300.34
308.17
305.89
n.a.
10 -10,000 ppm
RMSE
R2
(ppm)
0.927
0.978
0.959
0.906
0.971
0.363
613
341
459
755
442
2175
10 -1000 ppm
RMSE
R2
(ppm)
0.000
0.557
0.173
0.000
0.610
0.017
189
134
188
217
238
605
into pellets and LIBS spectra were acquired in the
Mineral Spectroscopy Laboratory at MHC [5] under a
7-Torr CO2 atmosphere using a wavelength range and
power densities chosen to match those used by ChemCam on Mars.
Calibration models were created using spectra of
the doped samples as well as three of the ChemCam
calibration targets [6] and 72 sedimentary samples
provided by Scott McLennan for which Ni had previously been measured. Each spectrum was preprocessed
to subtract a dark spectrum, resampled to standard
wavelength increments, and corrected for the instrument response given the acquisition geometry. The
Bremsstrahlung continuum was also removed.
Univariate Analyses: In the doped samples only,
channels in the range 300-310 nm have the highest
correlation coefficients when their intensities are plotted vs. Ni concentration. All appropriate peaks were fit
to Lorentzians and then Gaussians using a Matlab routine, but the results were unsatisfactory due to poor
resolution and baseline issues. We also tried summing
all channels in a peak and using the maximum intensity
Figure 1. Comparison of Ni concentration predicted by a
simple model using peak intensities of five Ni lines in five
different matrices (Table 1) vs. Ni measured by XRF.
46th Lunar and Planetary Science Conference (2015)
of each peak. All models reported here were tested
using both un-normalized spectra and data normalized
to spectrometer intensity in each of three wavelength
regions. However, the best predictive models used
normalized data, maximum peak intensity, and individual Ni I peaks at different energies for each matrix,
as seen in Figure 1. Calibration curves in each individual matrix (Table 1) have root mean square prediction errors (RMSE) values ranging from 341-755 ppm
when data from concentrations up to 10,000 ppm Ni
are used and 134-238 ppm when only samples from
10-1000 ppm are included. These results suggest that a
calibration curves developed on a single matrix will
produce reasonable predictions when matched to the
matrix of the unknown being predicted [7]. A calibration using all matrices and all five peaks combined
yielded RMSE values of 2175 and 605 ppm Ni, showing that even a slightly-generalized calibration will not
produce reliable quantitative results, as expected given
the literature on matrix effects in LIBS [8,9].
Multivariate Analyses: Previous work has suggested that multivariate analysis techniques can mitigate matrix effects and reduce prediction errors [1012]. We undertook partial least squares analysis of
various combinations of doped, sedimentary, and calibration target spectra as test and prediction sets, using
cross-validation. These results are preliminary pending
completion of analytical work on the compositions of
the standards, and on development and testing of additional models. We do not yet have final quantitative
results on the highest Ni samples, for which mass absorption coefficients are currently being calculated.
Models (Table 2) are evaluated using three different metrics: 1) RMSE describing the difference between the model prediction and the true Ni concentration, 2) relative RMSE, which is the RMSE divided by
the mean Ni concentration in the standards, and 3) R2
(coefficient of determination) of the best-fit line on a
graph of predicted vs. measured Ni concentration.
Viewed collectively on the basis of all three evaluation metrics, our results show that the model using
all doped samples for which Ni analyses are available
has a RMSE of 937 ppm Ni in the optimal and most
general case. Better results can be obtained if the matrix of an unknown can be matched to that of one of
the standards. For example, the RMSE for Ni in a matrix like that of the Idaho sample would have an error
of ~400 ppm based on a model (A; see footnote to Table 2) with normalization to each of three spectrometers but no baseline removal was used. Our current
data set of Ni in doped samples contains only 40 samples, but we will expand this to 210 samples over the
coming months. Increasing the size of the training set
should improve our generalizability and accuracy.
We are also beginning to test how the addition of
the other naturally-occurring sedimentary samples will
2720.pdf
improve our accuracy for the multivariate approaches.
Ni contents of McLennan’s samples are predominantly
<1000 ppm, so when they are included in the training
sets along with our doped sample, relative RMSE increases but total RMSE (i.e., the error bar on the measurement) decreases (improves). Multivariate analyses
of those samples using Model C only suggest that
RMSE’s <200 ppm will be possible in a generalized
model for samples in that range of concentration.
All
Holyoke
Maine
Sea
Sand
Idaho
Ultramafic
Table 2. Multivariate Model Results
Total
Relative
#
Model
R2
RMSE
RMSE
Comps
A
937
0.48
0.88
10
B
979
0.51
0.87
10
C
1209
0.62
0.80
10
A
910
0.57
0.87
3
B
754
0.47
0.91
3
C
961
0.60
0.86
8
A
827
0.52
0.90
6
B
1179
0.74
0.79
10
C
1563
0.97
0.63
8
A
554
0.36
0.95
10
B
711
0.46
0.92
8
C
1743
1.13
0.53
5
A
405
0.23
0.98
4
B
707
0.40
0.93
4
C
705
0.40
0.94
7
A
889
0.28
0.91
3
B
754
0.24
0.93
4
C
1545
0.49
0.71
3
All spectra were masked to include only the following wavelength
ranges: 298.827-302.788, 303.671-306.671, 308.745-311.745,
312.002-315,002, 331.784-334.784, 335.554-339.654, and 787.02792.78 nm.
# Comps: optimal number of components used in the PLS model
Model A: normalization to each of three spectrometers but no baseline removal
Model B: no normalization and no baseline removal
Model C: normalization to each of three spectrometers and baseline
removal
Conclusions: We are working toward acquisition
of a broad, multi-matrix doped calibration set for
measuring Ni on Mars. It is possible that we will have
two different working models, one for higher-Ni samples and one for concentrations <~1,000 ppm. Results
will inform the issue of meteoritic contamination of
Martian surface materials.
Acknowledgments: Supported by NASA MFRP grants
NNX09AL21G, NNX12AK84G, and NNX14AG56G.
References: [1] Yen A. S. et al. (2005) Nature, 436, 4954. [2] Yen A. S. et al. (2006) JGR, 111, E12S11. [3] Breves
E. et al. (2015) this volume. [4] Rhodes J. M. (1988) JGR,
93, 4453-4466. [5] Dyar M. D. (2015) this volume. [6]
Vaniman D. et al. (2012) Space Sci. Revs., DOI
10.1007/s11214-012-9886-0. [7] Byrne S. et al. (2015) this
volume. [7] Lasue, J. et al. (2015) this volume. [8] Clegg S.
M. et al. (2009) Spectrochim. Acta B, 64, 79-88. [9] Tucker J.
M. et al. (2010) Chem. Geol., 277, 137-148. [10] Dyar M. D.
et al. (2012) Spectrochim. Acta B, 70, 51-67. [11] Boucher T.
F. et al. (2015) Spectrochim. Acta B, submitted. [12] Boucher
T. (2015) J. Chemom., submitted.

© Copyright 2026