
ANALYST - ResearchGate
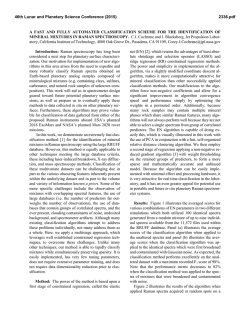
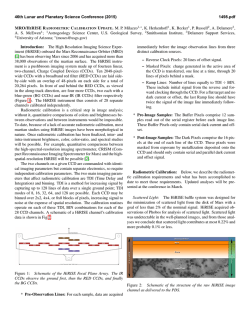
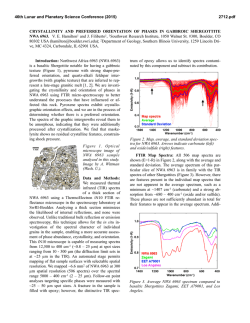
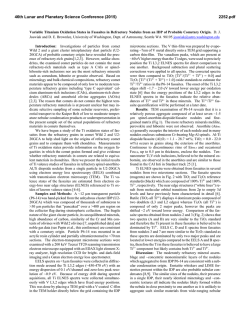
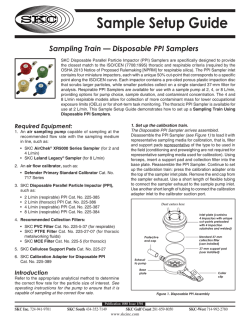
R. Fernández-Ruiz,*a J. P. Cabañero,a E. Hernándezb and M. Leónc
Servicio Interdepartamental de Investigación, Facultad de Ciencias, Universidad Autónoma
de Madrid, Cantoblanco, E-28049 Madrid, Spain. E-mail: [email protected]
b Departamento de Física, Fac. Exp. de Ciencias, Universidad del Zulia, Apdo. 526,
Maracaibo, Venezuela
c Departamento de Física Aplicada, Facultad de Ciencias, Universidad Autónoma de Madrid,
Cantoblanco, E-28049 Madrid, Spain
a
FULL PAPER
THE
ANALYST
Determination of the stoichiometry of CuxInySez by
total-reflection XRF
www.rsc.org/analyst
Received 21st May 2001, Accepted 20th July 2001
First published as an Advance Article on the web 25th September 2001
A rapid and accurate total-reflection XRF method was developed in order to determine the absolute stoichiometry
of ternary compounds of the type Cu+In+Se. The method was used to determine the composition of the
synthesised compounds CuxInySez(CIS). Three compounds were synthesised with different atomic proportions
x+y+z; 1+3+5, 2+4+7 and the no stoichiometric phase 1+2.5+4.75. The results obtained showed a systematic
deficiency of In and an increment of Se with respect to the stoichiometric formula.
Introduction
Experimental
CuInSe2 and related chalcopyrites have proved their suitability
for use in high efficiency photovoltaic devices.1 Several
authors2–4 have reported that deviation from ideal stoichiometry
in this material produces secondary phases that segregate at the
surface of the thin films. These phases have been identified as
CuIn2Se3.5 and CuIn3Se5 in In-rich thin films. It is now believed
that CuIn3Se5 plays a useful role5 in the operation and
optimisation of CuInSe2-based solar cell devices. Since CuInSe2 and CuIn3Se5 layers show good p- and n-type conduction, a
p-n junction can be formed at the interface between them. Thus,
CuIn3Se5 has attracted much interest as a key compound for
high conversion efficiency solar cells. However, the growth of
CuIn3Se5 single crystals with a controlled stoichiometry is
difficult due to the wide range of compositions in the Cu2Se–
In2Se3 pseudo-binary system. Hence, an accurate control of
composition is mandatory.
Total-reflection X-ray fluorescence (TXRF) is a widely
accepted technique. Prange6 and Tölg and R. Klockenkämper7
have reported the general characteristics of the technique, its
potential applications, as well as a comparison of TXRF in
relation to other contemporary analytical techniques. In previous work, Fernández-Ruiz et al.8 showed that the direct
analysis of solid samples by TXRF without chemical manipulation is a powerful technique. This technique can be applied to
study the mass relationships in Cu+In+Se matrices. In this paper
a rapid and accurate method involving the analysis of solid
samples by TXRF to determine the absolute stoichiometry of
ternary compounds of the type Cu+In+Se is described.
The stoichiometric composition of the compounds should be
considered in principle as CuxInySez. Our objective was to
evaluate the atomic substitutions x = 1 or 2, y and z, in order to
explain the physical and chemical properties of these materials.
For this study, we only need to know the mass relationship
among the constituent elements. TXRF allows one to quantify
these relationships readily, obtaining RSDs around 2% for In
and 4% for Cu.
Instrumentation
DOI: 10.1039/b104466b
The analysis by TXRF was performed using a Seifert EXTRAII spectrometer (Rich Seifer, Ahrensburg, Germany), equipped
with two X-ray fine focus lines, with anodes of Mo and W, and
a Si(Li) detector with an active area of 80 mm2 and a resolution
of 157 eV at 5.9 keV (Mn Ka). Quasi-elastic light scattering
spectroscopy (QELS) was used for the determination of the
particle size distribution in suspensions of the analysed samples.
The QELS system used was the AutoSizer IIc (Malvern
Instruments, Malvern, Worcestershire, UK), equipped with a 5
mW He–Ne laser, a photomultiplier and a processing electronic
system controlled by the Malvern AutoSizer computer package.
To carry out the analysis, a source of Mo X-rays was used.
The X-ray beam was filtered with a 50 mm Mo film. The
samples were analysed in the range 0–20 keV. The relationships
between the atomic efficiency factors were suitable for the
analysis. In order to obtain a count rate of about 5000 counts
s21 in all the measurements a 50 kV potential and a variable
intensity between 5 and 25 mA was used as excitation
conditions.
Detection limits
The detection limits (DL) associated with the evaluated
elements, Cu, In and Se, were calculated according to Prange6
using,
DL =
3M
A
B
t
(1)
where M is the evaluated element mass, A and B are the areas of
the peak and background associated with each element,
respectively, and t is the acquisition time, according to the
IUPAC definition.
Analyst, 2001, 126, 1797–1799
This journal is © The Royal Society of Chemistry 2001
1797
For the experimental determination of the detection limits,
ICP-AAS single element patterns of well-known concentration
(Merck, Darmstadt, Germany) were used. A 20 3 1029 g
amount of one element was deposited on a carrier sample and its
spectrum was acquired for 1000 s with a dead time of 30% . The
detection limits obtained were as follows, DLCu = 0.5 3
10212 g, DLIn = 8 3 10212 g and DLSe = 0.5 3 10212 g.
The value of the efficiency factor of Co (xCo) was set to 1.00.
The concentrations of the evaluated elements (Cx) were those
obtained previously. Table 1 shows the sensitivity factors and
the standard deviations (n = 5) obtained for each of the
elements.
Under these calibration conditions, Cu, Se and In were
determined in the problem samples.
Efficiency calibration curve
Synthesis of CuxInySez samples
Samples were ground to particle sizes under 10 mm, in order to
make it unnecessary8 for matrix correction in TXRF. On the
other hand, it is necessary to know the efficiency calibration
curve associated with the experimental system, to quantify a
problem sample. The efficiency calibration curve, i.e., relative
fluorescence intensity vs. atomic number, is one of the most
important and critical aspects to obtain a correct quantification
by TXRF. The efficiency calibration curve, once established,
stays invariable, provided that no geometric element of the
system is modified. To accomplish the sensitivity calibration of
the elements Cu, Se and In, (Z = 29, 34 and 49), ICP-AAS
single element patterns of well-known concentration (Merck)
were used, with the following certified concentrations, C(Cu) =
1006 ± 2 mg L21, C(Se) = 1010 ± 10 mg L21 and C(In) = 994
± 2 mg L21. As reference element Co was used, concentration
C(Co) = 997 ± 2 mg L21. One millilitre of each standard was
taken and diluted with 100 mL of 5% v/v aqueous nitric acid
(ultrapure water, Milli-Q, 18.2 MW), to stabilize the ions. The
obtained concentrations of each element were C(Cu) = 10.06 ±
0.03 mg L21, C(Se) = 10.1 ± 0.1 mg L21, C(In) = 9.94 ± 0.03
mg L21 and C(Co) = 9.97 ± 0.03 mg L21. Five aliquots of 2 3
1026 L of the solutions were deposited on five carrier samples.
The solvent was evaporated on a ceramic plate at 50 °C in a
Class A-100 laminar flow chamber. The five preparations were
analysed in the 0–20 keV energy region, with an acquisition
time of 1000 s and a dead time of 30%. Fig. 1 represents one of
the spectra obtained from the standards used.
The deconvolution and integration of the observed lines was
accomplished with the computer package AN-1000 (Oxford
Instruments, High Wycombe, Buckinghamshire, UK). The
following transitions were evaluated: K lines of Co, K lines of
Cu, K lines of Se and L lines of In. For the calculation of the
sensitivity factors, eqn. (2) was applied, where x is the atomic
efficiency factor, C is the concentration of each element and A
is the integrated area
The single crystals were grown by using Cu, In and Se of 5N
purity weighed in stoichiometric ratios. The mixture was sealed
in an evacuated quartz tube. The sealed tube was placed in a
vertical furnace and the temperature was initially raised to
300 °C at a rate of 10 °C h21. The ampoule was kept at this
temperature for 12 h and then heated to 1150 °C at a rate of
50 °C h21. The mixture was maintained at this temperature for
a period of 48 h. It was then cooled to room temperature at a rate
of 5 °C h21. The ingot showed voids and porosity. Under these
conditions three samples were prepared with molar ratios of
1+3+5, 2+4+7 and 1+2.5+2.75.
ÈC x ˘ A
x x = Í Co Co ˙ x
Î Cx ˚ ACo
(2)
Fig. 1 Spectra obtained for the multi-pattern of Cu, Se, In and Co used in
the sensitivity calibration.
1798
Analyst, 2001, 126, 1797–1799
Preparation of CuxInySez samples for TXRF analysis
First, 10 mg of sample were ground in an agate mortar to a
particle size of less than 30 mm. The sample was then ground
again for a further 20 min by using a vibration micro-pulveriser
(Fritsch, Oberstein, Germany), equipped with a ball and base
made of agate. Afterwards, 1 mL of high-purity water was
added. Next, the mixture was poured into a test-tube to which
high-purity water was added up to a volume of 2 mL. The
sample was homogenised for 10 min by ultrasonic desegregation in order to disperse possible agglomeration of
particles. Finally, the particle size distribution in the suspension
was checked by using QELS until it had the required
distribution, less than 10 mm8 (Fig. 2).
When the sample had this size distribution, it was again
homogenised.
Table 1 Efficiency factors and standard deviations (n = 5) obtained for
each one of the elements studied
Element
x
s
RSD (%)
Cu
In
Se
1.46
0.091
2.47
0.06
0.002
0.07
4
2
3
Fig. 2 QELS spectra obtained for the average particle size distribution in
the analysed samples.
Table 2
Stoichiometric results and standard deviations (n = 5) obtained for the three materials analysed
Sample
m(Cu)
m(In)
m(Se)
Cu (at.-%) In (at.-%)
Se (at.-%)
x Cu
y In
z Se
CuIn3Se5
Cu2In4Se7
CuIn2.5Se4.75
100.00
100.00
100.00
486.85
309.06
483.40
654.96
453.03
676.71
11.15
15.73
10.96
58.79
57.36
59.71
1.00 ± 0.04
2.00 ± 0.08
1.00 ± 0.04
2.69 ± 0.05
3.42 ± 0.07
2.68 ± 0.05
5.27 ± 0.2
7.29 ± 0.2
5.45 ± 0.2
30.05
26.91
29.33
Conclusion
The developed TXRF methodology allows one to quantify the
Cu, In and Se stoichiometry in CIS-related compounds with
high precision. A standard deviation in the stoichiometric
coefficients between 0.04 for Cu and 0.2 for Se was achieved.
The method requires very small amounts of sample; a few
milligrams are sufficient to obtain a repeatability between 2 and
4%. The method does not require any chemical manipulation.
The simplicity, rapidity (30 min per sample) and low cost of the
analysis make TXRF a suitable technique for monitoring the
stoichiometric coefficients in this type of compound.
Fig. 3
Comparative spectra of the three CIS materials evaluated.
Results
Analysis of CuxInySez stoichiometry
After preparation of the samples, 5 mL of the suspensions were
taken and placed on a flat carrier and the water was evaporated
under vacuum. The following XRF transitions were evaluated:
Cu K, In L and Se K. The Cu K line was used as reference with
a value of 100 relative mass units. The Cu K line was chosen as
reference due to its high definition in the spectrum and the
absence of interferences from other signals. Fig. 3 shows the
comparative spectra of the three CIS materials analysed.
Table 2 shows the results obtained in the analysis considering
the m-values (n = 5) for the Cu, In and Se mass ratios.
By normalising the stoichiometric coefficients with respect to
Cu, we can clearly see the systematic increments of Se in all the
analysed samples and the deficiency of In in the CuIn3Se5 and
Cu2In4Se7 samples with respect to the theoretical stoichiometry
of the synthesised Cu+In+Se compounds. The synthesised
compound CuIn2.5Se4.75 presents the same experimental chemical composition as the composition detected in the compound
CuIn3Se5.
Acknowledgements
The authors thank Ana María Pardo Palacios and Inmaculada
Rivas Ramírez for their encouragement in the preparation of the
samples and their patience in the digitalisation of the spectra.
This work was supported in part by grants from CONICIT of
Venezuela under Contract G-9700965 and F-97000670, and
from Comunidad Autónoma de Madrid (Project No.
07/0021/1998).
References
1
2
3
4
5
6
7
8
J. Hedstrom, H. Ohlsen, M. Bodegard, A. Kylner, L. Stolt, O.
Harikim, M. Ruckh and H. W. Schock, in Proceedings of the 23rd
IEEE Photovoltaic Specialist Conference, IEEE, New York, 1993,
p. 364.
J. R. Turtle, D. S. Albin and R. Noufi, Sol. Cells, 1991, 30, 21.
D. Schmid, M. Ruckh, F. Grunwald and H. W. Schock, J. Appl. Phys.,
1993, 73, 2902.
J. Kessler, D. Schmid, R. Schaffler, H. W. Schock and S. Menezes, in
Proceedings of the 23rd IEEE Photovoltaic Specialist Conference,
IEEE, New York, 1993, p. 549.
H. Z. Ziao, L. C. Yang and A. Rockett, J. Appl. Phys., 1994, 76,
1503.
A. Prange, Spectrochim. Acta, Part B, 1989, 44, 437.
G. Tölg and R. Klockenkämper, Spectrochim. Acta, Part B, 1993, 48,
111.
R. Fernández-Ruiz, M. García-Heras and J. D. Tornero, J. Archaeol.
Sci., 1997, 24, 1003.
Analyst, 2001, 126, 1797–1799
1799


© Copyright 2026