
2850 - USRA
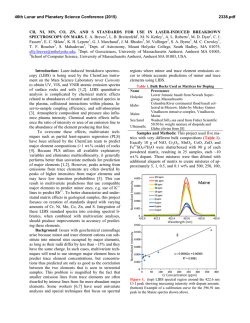
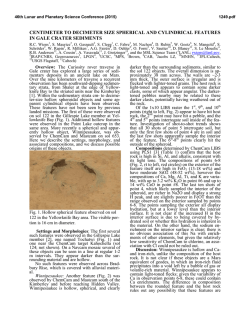
46th Lunar and Planetary Science Conference (2015)
2850.pdf
DETECTION OF PHOSPHOROUS BY CHEMCAM IN GALE CRATER. J. G. Blank1, 2, A. M. Ollila3, N. L.
Lanza4, O. Forni5, N. Mangold6, M. Nachon6, S. M. Clegg4, A. Yen7, S. Maurice5, R. C. Wiens4, 1NASA Ames Research Center, Moffett Field CA USA, 2Blue Marble Space Institute of Science, Seattle WA USA, 3Chevron Energy
Technology Company, Houston TX USA,4Los Alamos National Laboratory, Los Alamos, NM USA, 5Univ. Toulouse & CNRS, IRAP, Toulouse, France, 6Univ. Nantes & CNRS, Nantes, France, 7JPL Pasadena CA USA
Introduction: Phosphorous has an extensive chemistry, due to its tendency to form covalent organophosphorus compounds and its critical role in the biochemistry of life. On Earth, P ranks 11th in abundance in
crustal rocks, at ~1120 ppm average [1]. Terrestrial Pbearing minerals are usually orthophosphates, of which
the dominant phase is apatite (Ca5(PO4)3(F, Cl, OH)2).
In contrast, the most abundant phosphate in martian
meteorites is the anhydrous phase merrillite
(Ca9NaMg(PO4)7) [2]. Phosporous (P) has been detected on the surface of Mars using APXS instruments on
the MER and Curiosity rovers, providing evidence to
support both primary volcanic and secondary weathering processes (e.g., [3]; [4]. More recently, P has been
identified in LIBS spectra collected by ChemCam on
both soil and rock targets [5].
Observations from APXS instruments on three
missions have revealed a range of P contents in Mars
surface materials, from 0.61-0.89 wt% (as P2O5) in soil
and fine grained rock in Gale Crater ([6]; [7]) to 5.110.2 wt% (as P2O5), high-phosphorus “Wishstone
Class” alkaline volcanic rocks in Gusev Crater [4].
Recent laboratory work on the dissolution rates of
phosphate minerals under simulated martian condi
tions [8] led those authors to infer much greater water/rock ratios than predicted for analagous terrestrial
environments and a corresponding higher availability
of P for abiogenic reactions, making the determination
of this element’s abundance and distribution on Mars
even more intriguing.
Here, we consider potential P emission lines and
estimate a corresponding ChemCam detection limit for
P based on analysis of well-characterized terrestrial
standards.
Element Quantification with ChemCam: ChemCam provides elemental identification and quantification using laser-induced breakdown spectroscopy
(LIBS), an emission spectroscopy technique in which a
pulsed laser is focused on a target up to several meters
distant from the rover ([9];[10]). A portion of the target material is converted to a plasma, exciting each
species to a higher state; as the species relax, they emit
light at characteristic wavelengths. Instrument hardware (i.e., the laser and spectrometers) and operational
parameters (i.e., stand-off distance, energy density, and
observational window of the plasma) constrain the
obtainable accuracy and precision of a measurement.
Major element contents are quantified by LIBS using partial least-squares regression and principal component analysis (e.g., [11]). Trace element contents can
be quantified using univariate analysis [12], and this
requires a calibration curve that depends on appropriate standards.
Determining optimal P Emission lines: In order
to determine the best P emission lines in ChemCam
data, the emission lines in terrestrial laboratory standards were examined and compared to those of martian
targets. Primary elemental emission lines for P from
the NIST database (www.nist.gov) are listed in Table
1, in order of increasing wavelength. P emission lines
in the UV range of ChemCam (240-342 nm) have been
observed in a few Gale Crater targets (data analyzed
through sol 707), including sol 72 Epworth_5 (a soil)
and sol 368 Blackhead_7 (a fine-grained rock), as noted in the right column of the Table. In general, P is a
comparatively poor emitter at the ChemCam laser energy and thus its detection using LIBS is challenging
[13]. Based on our analysis of P peak intensities and
overlapping emissions, the P I line (255.4 nm), shown
in bold with the second-highest emission intensity,
lacks interference from other element lines and is likeTable 1. Anticipated P Emission Lines with ChemCam LIBS
Line
Wavelength
Peak
(nm)*
Interferences
Emission Lines seen in Two
Gale Crater Targets
PI
253.637 Multiple Fe lines Epworth_5 (shoulder on Fe)
PI
255.403
Epworth_5, Blackhead_7
PI
255.568
P, Fe
Epworth 5
* For sample emission in vaccuum (source: NIST)
ly to give the most accurate estimate of P content in
ChemCam data.
A preliminary sample suite of laboratory standards
with known compositions was used to explore the sensitivity of ChemCam to P content (Fig. 1). Materials
include two powdered phosphate rocks, SARM32 and
USZ14-94, with 39.96 and 26.38 wt% P2O5, respectively, spanning a large range in abundance. Lower P
samples analyzed were BHVO2 (USGS basalt), JDO1
(dolomite), GYPA (gypsum), and the Norite ChemCam calibration standard [14], containing 0.27, 0.034,
0.011, and 0.0078 wt% P2O5, respectively. No P emi
46th Lunar and Planetary Science Conference (2015)
2850.pdf
Fig.1. Compilation diagram of normalized LIBS spectra of six standards from the Chem-Cam materials library,
three terrestrial apatite minerals (whole rock, not powdered), and two ChemCam sample targets in Gale Crater.
Terrestrial samples were analyzed with the ChemCam engineering model in a Mars Chamber (~7 Torr CO2) at a
stand-off distance of 1.5 m and a laser power of ~14 mJ/pulse (cf., [12]; [15]. Martian samples Epworth_5 (soil)
and Blackhead_7 (fine-grained rock) were analyzed at distances 2.27 m and 3.36 m from Curiosity, respetively.
Three P I lines are visible, labeled at 253.64, 255.42, and 255.57 nm; 255.42 nm has little or no interference from
other element emission lines and is likely will provide the most accurate estimates of P contents.
sion lines were detected in these low-P samples. In
contrast, the three apatite samples showed clear P lines
(Fig. 1). All samples were prepared as pressed powdered pellets except for the three apatite standards. Fig.
1 also illustrates a variety of P emission bands and
interference from Fe emissions.
Quantifying P in ChemCam data: At this time, a
detailed calibration of P with ChemCam has not been
completed. However, assuming a linear relation between peak intensity and concentration, we predict that
samples Epworth_5 and Blackhead_7 contain ~17 and
~5 wt% P2O5, based on the peak intensities of their P I
emission lines at 255.4 nm ratioed to that of USZ1494. Upon consideration of the spectra for the group of
samples, we predict that the detection limit for P with
ChemCam is ~2-3 wt% P2O5. This value may be refined further through calibration using an expanded
laboratory training set.
References: [1] Greenwood & Earnshaw (2002)
Chemistry of the Elements, 2nd Ed.; [2] Jolliff et al.
(2006) Am. Mineral. 91:1583; [3] Yen et al. (2014)
Eos P34A-04; [4] Usui et al. (2008) J.Geophys. Res.
113: E12S44; [5] Forni et al. (2014) Intl. Conf. Mars
8:1062; [6] Schmidt et al. (2014) JGR Planets 119:1;
[7] Gellert et al. (2014) LPSC 1876; [8] Adcock et al.
(2013) Am. Mineral. 99:1121; [9] Maurice et al. (2012)
Space Sci. Rev. 170:95; [10] Wiens et al. (2012) Space
Sci Rev. 170:167; [11] Clegg et al. (2009) Spectrochim.
Acta B 64:79; [12] Ollila et al. (2014) J.Geophys. Res.
Planets 119:255; [13] Cremers & Radziemski (2013)
Handbook of Laser-Induced Breakdown Spectroscopy,
2nd Ed.; [14] Fabre et al. (2011) Spectrochim. Acta B
66:280; [15] Wiens et al. (2013) Spectrochim. Acta B
82:1.
© Copyright 2026