
A FAST AND FULLY AUTOMATED CLASSIFICATION SCHEME
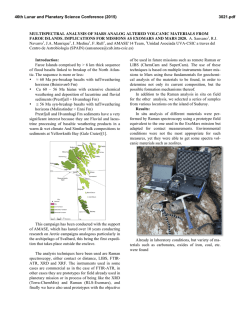
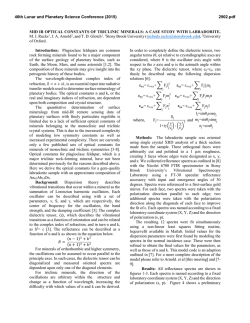
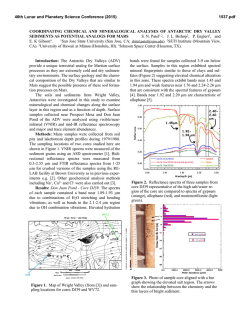
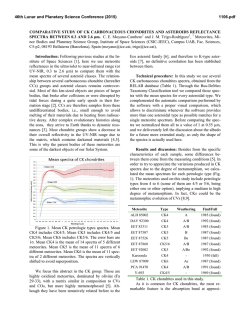
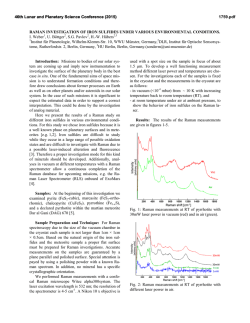
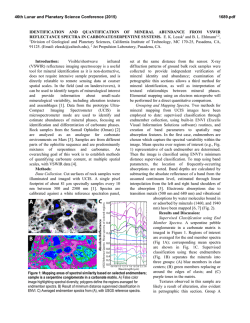
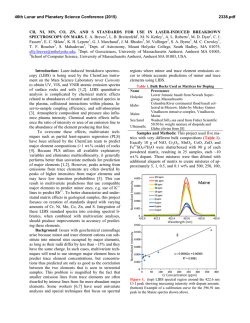
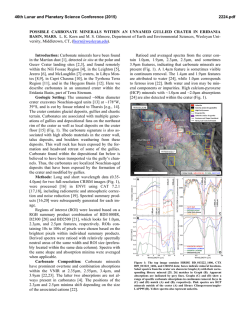
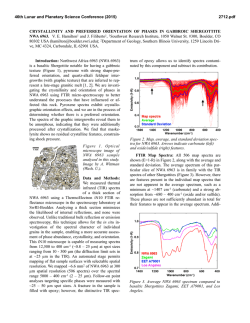
46th Lunar and Planetary Science Conference (2015)
2336.pdf
A FAST AND FULLY AUTOMATED CLASSIFICATION SCHEME FOR THE IDENTIFICATION OF
MINERAL MIXTURES IN RAMAN SPECTROSCOPY. C.J. Cochrane and J. Blacksberg, Jet Propulsion Laboratory, California Institute of Technology, 4800 Oak Grove Dr., Pasadena, CA 91109, [email protected]
Introduction: Raman spectroscopy has long been
considered a next step for planetary surface characterization. Our motivation for implementation of new algorithms in this area arises from the need to expedite and
more robustly classify Raman spectra obtained on
Earth-based planetary analog samples composed of
mineralogical mixtures (e.g. containing clays, sulfates,
carbonates, and natural rock samples of unknown composition). This work will aid us in spectrometer design
geared toward future potential planetary surface missions, as well as prepare us to eventually apply these
methods to data collected in situ on other planetary surfaces. Furthermore, these algorithms may prove valuable for classification of data gathered from either of the
proposed Raman instruments aboard ESA’s planned
2018 ExoMars and NASA’s planned Mars 2020 rover
missions.
In this work, we demonstrate an extremely fast classification method [1] for the identification of mineral
mixtures in Raman spectroscopy using the large RRUFF
database. However, this method is equally applicable to
other techniques meeting the large database criteria,
these including laser-induced breakdown, X-ray diffraction, and mass spectroscopy methods. Classification of
these multivariate datasets can be challenging due in
part to the various obscuring features inherently present
within the underlying dataset and in part to the volume
and variety of information known a priori. Some of the
more specific challenges include the observation of
mixtures with overlapping spectral features, the use of
large databases (i.e. the number of predictors far outweighs the number of observations), the use of databases that contain groups of correlated spectra, and the
ever present, clouding contaminants of noise, undesired
background, and spectrometer artifacts. Although many
existing classification algorithms attempt to address
these problems individually, not many address them as
a whole. Here, we apply a multistage approach, which
leverages well established constrained regression techniques, to overcome these challenges. Unlike many
other techniques, our method is able to rapidly classify
mixtures while simultaneously preserving sparsity. It is
easily implemented, has very few tuning parameters,
does not require extensive parameter training, and does
not require data dimensionality reduction prior to classification.
Method: The power of the method is based upon a
first stage of constrained regression, called the elastic
net (EN) [2], which retains the advantages of least absolute shrinkage and selection operator (LASSO) and
ridge regression (RR) constrained regression methods.
The power and simplicity in implementation of the algorithm, via a slightly modified coordinate descent algorithm, makes it more computationally attractive for
mineral classification than other successfully applied
classification methods. Our modifications to the algorithm force non-negative coefficients and allow for a
significant improvement in algorithm convergence
speed and performance simply by optimizing the
weights in a permuted order. Additionally, because
many rock samples may contain multiple mineral
phases which share similar Raman features, many algorithms will not always perform well because they are not
able to select a single spectrum from group of correlated
predictors. The EN algorithm is capable of doing exactly this, which is visually illustrated in this work with
the use of PCA in conjunction with a fast, self-organized
relative distance clustering algorithm. We then employ
a second stage of regression applying a non-negative reduced gradient algorithm [3] with weight thresholding
on the retained groups of predictors, to form a more
sparse and mathematically accurate and unbiased
model. Because the algorithm can be easily implemented with minimal effort and processing hardware, it
is very attractive for real time classification in the laboratory, and it has an even greater appeal for potential use
in portable and future in situ planetary Raman spectrometer systems.
Results: Figure 1 illustrates the averaged scores for
various combinations of EN parameters in two different
simulations which both utilized 100 identical spectra
generated from a random mixture of up to nine individual spectra available from the 11,572 files used within
the RRUFF database. Panel (a) illustrates the average
scores of the classification algorithm when applied to
the unaltered spectra and panel (b) illustrates the average scores when the classification algorithm was applied to the identical spectra which were first broadened
and contaminated with Gaussian noise. As expected, the
classification method performs excellently on the unaltered dataset with a maximum recorded F1 score of 98%.
Note that the performance metric decreases to 82%
when the classification method was applied to the spectra of mixtures that were broadened and contaminated
with noise.
Figure 2 illustrates the results of the algorithm when
applied Raman spectra acquired at random spots on a
46th Lunar and Planetary Science Conference (2015)
natural rock sample of unknown composition obtained
from a shear surface within a basaltic unit of the Miocene age Topanga Canyon formation in Griffith Park
California. As illustrated in the two spots selected, the
method was successfully able to identify the mixtures of
prehnite/quartz and albite/muscovite/beta carotene.
Figure 1: Comparison of classification scores (averaged) when
perfomed on 100 different mixtures of up to 9 different specta.
The scores in (a) were obtained on unaltered spectra while the
scores in (b) were obtained using the same, but broadened,
spectra contaminated with noise.
Figure 2: Results from classification of data sets collected on
the JPL time-resolved Raman spectrometer [4]. Panels (a-b)
illustrate the microscopic images acquired by our instrument
using focus stacking. Panels (c) and (d) illustrate the use of
PCA on the returned set of predictors after the first stage of
EN regression in spot 1 and 2, respectively. Panels (e) and (f)
illustrate comparisons of the acquired spectrum, the reconstructed spectrum, and the returned predictors for both spots 1
and 2, respectively, after the second stage of classification.
2336.pdf
In order to fully test the performance of the classifier
on real data, we applied the algorithm to spectra acquired from a powdered mixture of quartz, dolomite,
jarosite, anhydrite, calcite, and albite. Figure 3 illustrates the results obtained for one of the spots acquired.
As illustrated, even despite the correlated Raman features of the mineral spectra used in the powder mixture,
the algorithm was still able to accurately retain these
spectra from the database without a single false positive
for this particular spot. Additionally, the small measured
variance of the residual suggests very good fitting of
spectra from the available database files.
Figure 3: Results of classification scheme applied to a powder
mixture of minerals composed of quartz, calcite, dolomite, jarosite, anhydrite, and albite. The grouping effect of the EN is
illustrated in panel (a) through the use of PCA on the returned
set of predictors from the first stage of classification. Panel (b)
illustrates the predictors retained after the second stage of classification listed in order with respect to their associated weight
and panel (c) illustrates the acquired spectrum, the reconstructed spectrum (using the predictors illustrated in panel b),
and the residual between the two.
Acknowledgements: The authors would like to
acknowledge Erik Alerstam and Yuki Maruyama from
NASA’s Jet Propulsion Laboratory for their collaboration and feedback in this work. This research was supported by an appointment to the NASA Postdoctoral
Program at the Jet Propulsion Laboratory, administered
by Oak Ridge Associated Universities through a contract with NASA. The research described in this publication was carried out at the Jet Propulsion Laboratory,
California Institute of Technology, under a contract
with the National Aeronautics and Space Administration (NASA).
References: [1] Cochrane C.J. and Blacksberg J.
(2015) submitted to IEEE TGRS. [2] Zhou H., Hastie,
T., (2005) Stat. Soc. B, 67, 301. [3] Lawson C.L., Hanson R.J. (1974) Prentice-Hall. [4] Blacksberg et al.,
LPSC 2015.
© Copyright 2026