
pure mineral phases sampled by the chemcam instrument in gale
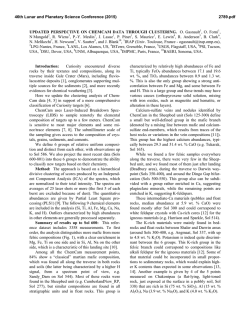
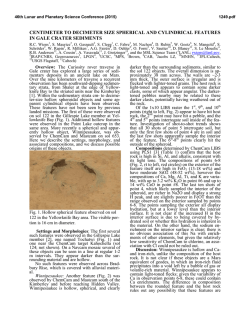
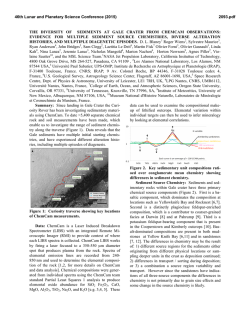
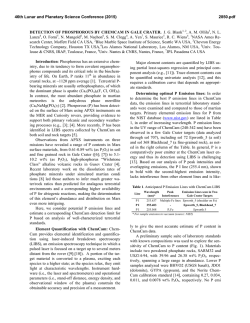
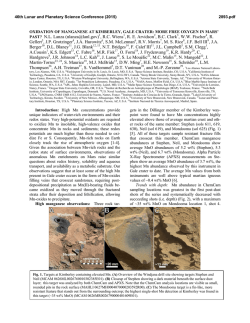
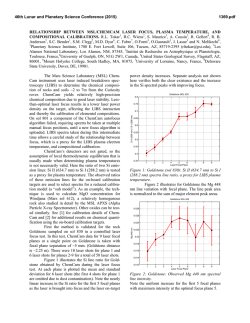
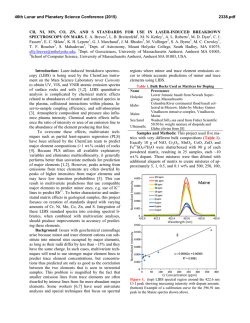
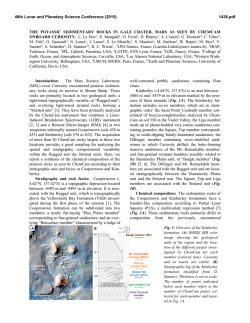
46th Lunar and Planetary Science Conference (2015)
1514.pdf
PURE MINERAL PHASES SAMPLED BY THE CHEMCAM INSTRUMENT IN GALE CRATER, MARS,
AS MEASURED USING CATION RATIOS FOR SOLS 13-801. M. D. Dyar1, P. Dobosh2, J. Bridges3, R.
Wiens4, and the MSL Science Team, 1Dept. of Astronomy, Mount Holyoke College, 50 College St., South Hadley,
MA 01075, [email protected], 2Dept. of Computer Science, Mount Holyoke College, 3Space Research Centre,
Dept. of Physics and Astronomy, University of Leicester, UK, 4Los Alamos National Laboratory, Los Alamos, NM,
Introduction: Some of the source rocks at Gale
Crater contain phenocrysts with sizes that are roughly
on the same scale as the ChemCam LIBS beam or
smaller [1]. Thus, the beam is generally too large to
sample individual grains, and too small to obtain a
representative bulk analysis [2], presenting obstacles to
mineralogical and geochemical interpretations. In this
project, we use cation ratios to extract direct information on mineral chemistry from ChemCam results.
Usie of ratios has the added benefit of mitigating error
bars [3] on the chemical analyses and producing potentially more accurate results on mineral compositions.
Figure 1. Schematic of laser beam sampling two different
phases in varying proportions; enlargement shows the size of
the beam relative to grain size in a typical basalt. If one of
the phases is a feldspar and the other phase does not contain
either Ca or Na, then the composition of the feldspar can be
deduced, as seen in Figure 2.
Why Use Cation Ratios? Typically 30-50 laser
shots are fired at each location on targets on Mars, and
multiple locations on each target are lased. Averaging
all the shots acquired at any given location obscures
useful information that may be revealed by considering
mineral stoichiometry and using cation ratios based on
individual shot data. Generally, the beam samples
more than two phases, yielding undecipherable individual phase compositions. However, by considering
individual shots, it is rarely (~1,500 spots out of
150,000 laser shots) possible to identify analyses of
single mineral grains with recognizable stoichiometry.
Moreover, grain sizes are sometimes small enough that
the beam sometimes samples pairs of minerals (Figure
Figure 2. Molar Ca/(Ca+Na) derived from ChemCam analyses showing a nearly pure anorthitic feldspar from the 9th
location sampled on target Badwater analyzed on sol 741.
1), each with a constant composition, in varying ratios.
So selected cation-cation plots will show straight mixing trend lines whose slopes and intercepts characterize
individual mineral compositions accurately.
For example, Figure 2 shows such a plot of molar
Ca/(Ca+Na) (plagioclase composition) for a target
called Badwater with propagated errors [4] based on
RMSEP values from [3]. The best fit line for these data
passes through the origin, implying that only one phase
in this rock contains Na and Ca – likely a feldspar. The
slope is the anorthite composition of the rock,
An0.96±0.16. The trend demonstrates that all Na and Ca
cations in this location are in a single phase – a conclusion that cannot be made from an averaged analysis.
Moreover, this sample is nearly pure anorthite.
Cation ratios are also useful in identifying individual analyses that samples single phases. When ChemCam chemistries are converted to mole, cation ratios
typical of basaltic minerals can be assessed.
Methods: ChemCam data from sols 13-801 were
converted to moles, and every individual shot was queried to determine if a single phase was analyzed using
stoichiometric criteria. The program searches for Fe
oxide, feldspar, pyroxene, and olivine:
• If Σ(Ca+Na+K+Al)<0.01 and Si/(Mg+Fe)=0.5 within the error bar, then the mineral is an olivine.
• If Σ(Na+K+Al)<0.01 and Si/(Mg+Fe+Ca)=1.0 within the error bar, then the mineral is a pyroxene.
• If Σ(Mg+Fe+Mn+Ti)<0.01 and Si/(Na+Ca+K)=2-3
within the error bar then the mineral is a feldspar.
• If Si<0.01 and Fe/(Fe+Mg)=1 within the error bar,
then the mineral is Fe oxide.
46th Lunar and Planetary Science Conference (2015)
The software can also plot any combination of
summed cations on either axis of an x-y graph, and also
outputs errors on x, y, slope, and intercept based on
Deming regression [5].
Results: There are two ways to approach examing
mineral composition based on ChemCam data: 1) look
for single minerals based on the stoichiometric criteria
given above, or look for phases that were sampled as
pairs (cf. Figure 2).
In the data from sols 13-801, there are no single
shot analyses possessing olivine stoichiometry where
Si/(Fe+Mg) is 0.5 within error bars; in fact, all shots
with that ratio contain other cations totaling >20
mole% of the cations present. The lack of recognizable
single olivine analyses in this data set (within its current accuracy) suggests that phenocrystic olivines, if
present, are likely smaller than the ChemCam beam.
1514.pdf
Richardson_2 (sol 130), Bonnet Plume_DW (sol 172),
Husky_Creek (sol 322), Red Wine (sol 339), Cosmo
(sol 341), and Mell (sol 530) all have more than 20
shots with pyroxene stoichiometry. Most of these lie in
the range of the pigeonite-augite field expected in
Mars pyroxenes from orbital and SNC meteorite data.
Figure 4. Plot of Ca/(Ca+Na+K) for all targets in which the
slope of that line has an R2 value >0.7.
Future work: This project shows that chemical
compositions of minerals can be determined using cation ratios and stoichiometry criteria based on known
crystal chemistry of common rock-forming phases.
Ongoing work to improve the accuracy of ChemCam
analyses will enhance our ability to discern mineral
compositions both solely and in pairs, making determinatio of mineral compositions from ChemCam analyses routine.
Figure 3. Ternary diagram of feldspar compositions based
on single shots with feldspar stoichiometries. Note that
these are composite compositions of mixtures of two different phaases: alkali feldspars, which would plot along the
left side of the ternary, and plagionclases, which would
plot in the bottom 10% of the diagram.
Nor are there any iron oxide-like analyses – again, not
a surprising result considering that oxides in terrestrial
occurrences rarely occur as large grain.
For feldspar, there are 494 individual Chemcam
shots with data that yield recognizable feldspar compositions when converted to moles. These include Taltheilei (sol 33), Miette (sol 289), Shackleton (sol 406),
Harrison (sol 516), Lamboo (sol 636), BonanzaKing2_CCAM (sol 727). Figure 3 shows compositions of these single-shot feldspar data on a ternaty
diagram. A 2nd perspective on feldspar composition
can be derived from using slopes (as seen in Figure 2)
and yields similar results (Figure 4).
For pyroxene, there are 896 spots where the value
of Si/(Fe+Mg+Mn+Ti+Ca) is between 1.00±0.29 and
the other cations total to <20 mole% of the cations
present (Figure 5). The targets Natkusiak (sol 43),
Figure 5. Pyroxene compositions derived from single
ChemCam shots. Results fall in the pigeonite region like
those found in SNC meteorites and in remote-sensed data.
Acknowledgments: This work was funded by
NASA grant NNX12AK4GS04.
References: [1] Maurice S. et al. (2012) Space Sci.
Rev., 170, 95-166. [2] McCanta M. C. (2013) Planet.
Space Sci., 81, 48-54. [3] Wiens R. C. (2013) Spectrochim. Acta B, 82, 1-27. [4] Dobosh P.A. and Dyar M.
D. (2013) LPS XLV, Abstract #1188. [5] Cantrell, C.
A. (2008) Chem. Phys., 8, 5477-5487.


© Copyright 2026