
Identification of Homogeneous Units on Ceres. First Results by Dawn
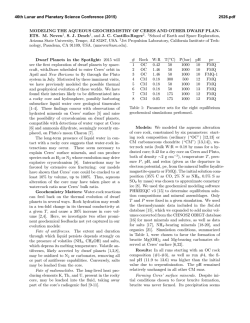
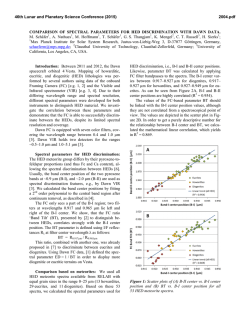
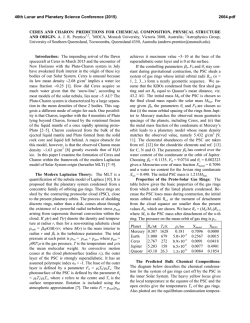
46th Lunar and Planetary Science Conference (2015)
1365.pdf
IDENTIFICATION OF HOMOGENEOUS UNITS ON CERES. FIRST RESULTS BY DAWN.
F. Zambon1, M.C. De Sanctis1, F. Tosi1, A. Longobardo1, E. Palomba1, F. Capaccioni1, E. Ammannito2, A. Frigeri1,
M. T. Capria1, M. Ciarniello1, A. Raponi1, C. T. Russell2 and C. A. Raymond3, and the Dawn/VIR Team.
1
INAF-IAPS, V ia del Fosso del Cavaliere 100, I-00133 Rome, Italy, [email protected]. 2University of
California at Los Angeles, Los Angeles, CA, USA. 3NASA/Jet Propulsion Laboratory and California Institute of
Technology, Pasadena, CA, USA.
Introduction: The dwarf planet Ceres, the largest object in the main asteroid belt of the Solar System, is the
second and final target of the NASA Dawn mission
[1]. In spring 2015, i.e. 2.5 years after leaving its first
target, asteroid 4 Vesta, Dawn will arrive at Ceres
providing spatially resolved data up to resolutions never achieved before. VIR, the hyperspectral imaging
spectrometer onboard Dawn, with a spectral range
0.25-5.1 µm will allow the first comprehensive mapping of Ceres mineralogy, highliting the possible presence of ice, organics and volatiles [2]. The few spectra of Ceres available show an absorption feature in the
3-µm region, which might reveal the presence of
hydrated minerals [4].
Previous UV-VIS maps obtained from Hubble data [5]
revealed broadly regional albedo differences on Ceres
(Figure 1). Already in the early Approach phase, Dawn
will gather data at an unprecedented spatial resultion,
covering a much larger spectral range at the same time,
ultimately allowing for determine the first global spectral characteristics of the dwarf planet. Here we highlight homogeneous spectral regions by means of
classification techniques.
istics. We apply an unsupervised clustering method,
such as ISODATA or k-means [6]. Such clustering algorithms group pixels with similar characteristics.
With this approach, we can automatically extract spectral endmembers that can drive the classification of the
remaining dataset. To achieve this goal, we use the
spectral angle mapper (SAM) supervised method.
SAM compares every single spectrum in the dataset
with the spectral endmembers, to determine their degree of similarity by computing a "spectral angle"
between them [7]. SAM calculates the angle between
two spectra which are considered as vectors in a space
with dimensionality equal to the number of spectral
channels [7, 8]. The analysis is also useful to verify if
spectral differences are associated to areas with different albedo and to select regions of interest for local
analysis when higher resolution data will be available.
Figure 1: RGB image of the Ceres albedo deviation. R:
535 nm, G: 335 nm, B: 223 nm.
References
[1] Russell, C.T. et al., Science, 336, 684, 2012.
[2] De Sanctis, M.C. et al., LPSC, 2015
[3] Lebofsky, L.A., Mon. Not. R. Astron. Soc. 182,
1978
[4] Lebofsky, L.A., et al.:, Icarus, 1981
[5] Li, J.Y. et al., Icarus, 2006
[6] Adams, J. B. and Gillespie, A. R., Cambridge University Press, 2006.
[7] http : //www.ltid.inpe.br/tutorial/tut9.htm#Spectral
%20Angle%20Mapper%20Classification.
[8] Rashmi, S. et al., IJISET, 2014
Data set and analysis: The global albedo map obtained by Hubble data [5] has a spatial resolution of
~30 km/pixel. This map available for three different
wavelength in the UV-VIS range (i.e. 223 nm, 335 nm
and 535 nm) (Figure 1) highlights different albedo
region, which might point to compositional gradients
[5]. During the early Approach phase to Ceres, VIR
will acquire data with a spatial resolution up to 12.5
km/pixel, i.e. more than twice as high as the best obtained so far. This data allow to perform a global spectral analysis of Ceres and to combine the spatial information to the spectral information. Since we do not
have a priori information on the different spectral
units, classification of these data is a good approach to
identify regions with homogeneous spectral character-
Acknowledgments VIR is funded by the Italian Space
Agency–ASI and was developed under the leadership
of INAF-Istituto di Astrofisica e Planetologia Spaziale,
Rome-Italy. The instrument was built by SelexGalileo, Florence-Italy. The authors acknowledge the
support of the Dawn Science, Instrument, and Operations Teams. This work was supported by ASI and
NASA’s. A portion of this work was performed at the
JPL NASA.
© Copyright 2026