
Comparison of Spectral Parameters for HED Discrimination with
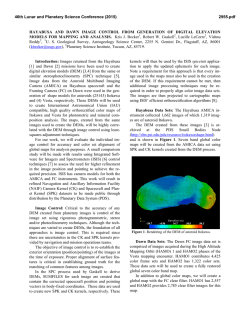
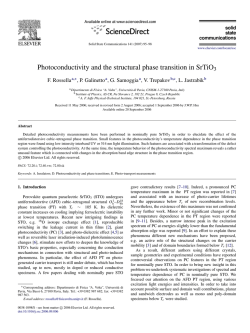
46th Lunar and Planetary Science Conference (2015)
2004.pdf
COMPARISON OF SPECTRAL PARAMETERS FOR HED DISCRIMINATION WITH DAWN DATA.
M. Schäfer1, A. Nathues1, M. Hoffmann1, T. Schäfer1, G. S. Thangjam1, K. Mengel2, C. T. Russell3, H. Sierks1;
1
Max Planck Institute for Solar System Research, Justus-von-Liebig-Weg 3, D-37077 Göttingen, Germany,
[email protected]; 2Clausthal University of Technology, Clausthal-Zellerfeld, Germany; 3University of
California, Los Angeles, CA, USA.
Introduction: Between 2011 and 2012, the Dawn
spacecraft orbited 4 Vesta. Mapping of howarditic,
eucritic, and diogenitic (HED) lithologies was performed by several authors using data of the onboard
Framing Camera (FC) [e.g. 1, 2] and the Visible and
Infrared spectrometer (VIR) [e.g. 3, 4]. Due to their
differing wavelength range and spectral resolution,
different spectral parameters were developed for both
instruments to distinguish HED material. We investigate the correlation between these parameters and
demonstrate that the FC is able to successfully discriminate between the HEDs, despite its limited spectral
resolution and coverage.
Dawn FC is equipped with seven color filters, covering the wavelength range between 0.4 and 1.0 µm
[5]. Dawn VIR holds two detectors for the ranges
~0.5–1.0 µm and 1.0–5.1 µm [3].
HED discrimination, i.e., B-I and B-II center positions.
Likewise, parameter BT was calculated by applying
FC filter bandpasses to the spectra. The B-I center varies between 0.917–0.927 µm for diogenites, 0.917–
0.927 µm for howardites, and 0.927–0.949 µm for eucrites. As can be seen from Figure 2A, B-I and B-II
center positions are highly correlated (R2 = 0.954).
The values of the FC-based parameter BT should
be linked with the B-I center position values, although
they are not correlated from a spectroscopical point of
view. The values are depicted in the scatter plot in Figure 2B. In order to get a purely descriptive number for
the relationship between B-I center and BT, we calculated the mathematical linear correlation, which yields
in R2 = 0.869.
Spectral parameters for HED discrimination:
The HED meteorite group differs by their pyroxene-tofeldspar proportions (and thus Fe and Ca content), allowing the spectral discrimination between HEDs [6].
Usually, the band center position of the two pyroxene
bands at ~0.9 µm (B-I), and ~2.0 µm (B-II) are used as
spectral discrimination features, e.g., by Dawn VIR
[3]. We calculated the band center positions by fitting
a 2nd order polynomial to the central band region after
continuum removal, as described in [4].
The FC only sees a part of the B-I region; two filters at wavelengths 0.917 and 0.965 µm lie left and
right of the B-I center. We show, that the FC ratio
‘Band Tilt’ (BT), presented by [2] to distinguish between HEDs, correlates strongly with the B-I center
position. The BT parameter is defined using I/F reflectances Rλ at filter center wavelength λ as follows:
BT = R0.917µm / R0.965µm
This ratio, combined with another one, was already
proposed in [7] to discriminate between eucrites and
diogenites. Using Dawn FC data, [1] defined the spectral parameter ED = 1 / BT in order to display more
diogenitic or eucritic terrains on Vesta.
Comparison based on meteorites: We used all
HED meteorite spectra available from RELAB with
equal grain sizes in the range 0–25 µm (13 howardites,
29 eucrites, and 11 diogenites). Based on these 53
spectra, we calculated the spectral parameters used for
Figure 1: Scatter plots of (A) B-II center vs. B-I center
position and (B) BT vs. B-I center position for all
53 HED meteorite spectra.
46th Lunar and Planetary Science Conference (2015)
2004.pdf
HED variations on Vesta: Dawn found a diversity of small-scale lithological variations on Vesta. Figure 2 displays as an example the vicinity of the craters
Graecinia (237.0° E, 37.5° S; ~13 km diameter) and
Lollia (242.3° E, 37.4° S; ~5 km diameter), showing
diogenitic ejecta on a mostly howarditic background.
In Figure 2A, the FC-based parameter BT is depicted (based on an image mosaic with 50 m/pixel resolution), while Figures 2B and 2C illustrate the two
band center parameters B-I and B-II, based on VIR
data. For this purpose, we processed the two VIR
scenes 371993041 and 372610272 (original resolution
~175 m/pixel).
Visually, the parameters are in good overall agreement, in spite of the threefold lower resolution and
some image artefacts in the VIR data. Even small craters with diogenitic deposits south of Graecinia appear
in all three parameter visualizations. Locally, however,
some smaller discrepancies exist, e.g., in the NE part
of the ejecta of Lollia. There, much more diogenites
are indicated by VIR B-II than by B-I, while BT and
B-I indicate some kind of gap in the diogenitic ejecta.
This mismatch could possibly also be caused by mineralogical differences.
Conclusion: The band center parameters of B-I
and B-II are highly correlated. We demonstrate that the
BT parameter, based on FC filter reflectances in the
region of B-I, mathematically correlates with the B-I
center parameter. Thus, the FC filters can be used to
discriminate between HED lithologies, benefiting the
high spatial resolution of the FC data.
However, further lithologies occurring on Vesta
(e.g., dark and orange material) should possibly be
treated differently. Also, potential minor olivine constituents in the local surface mixtures might modify the
spectral shape.
A detailed comparison between BT and both B-I
and B-II centers based on Dawn data, as well as global
FC-based HED maps of Vesta, and more examples, are
given in [8].
References: [1] Reddy et al. (2012) Science, 336,
700–704. [2] Thangjam et al. (2013) MAPS, 48-11,
2199–2210. [3] De Sanctis et al. (2013) MAPS, 48-11,
2166–2184. [4] Ammannito et al. (2013) MAPS, 48-11,
2185–2198. [5] Sierks et al. (2011) Space Science
Rev., 163, 263–327. [6] Gaffey (1976) JGR, 81-5,
905–920. [7] Le Corre et al. (2011) Icarus, 216, 376–
386. [8] Schäfer et al. (2015) MAPS, submitted.
Figure 2: Color composites of spectral parameters at
craters Graecinia and Lollia (approx. 60 x 50 km).
(A) FC BT parameter, (B) VIR B-I center position, and
(C) VIR B-II center position. Red colors exhibit diogenitic surface material, while blue colors display more
howarditic material.
Acknowledgements: This research utilizes spectra
acquired by several PIs with the NASA RELAB facility at Brown University. The Dawn FC project is financially supported by the Max Planck Society (MPS),
German Aerospace Center (DLR), and NASA/JPL.
© Copyright 2026