
analysis of compositional variations at non
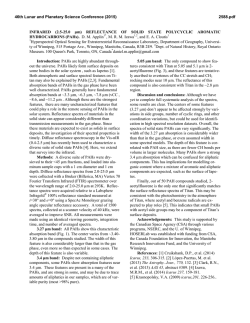
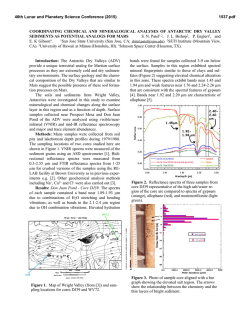
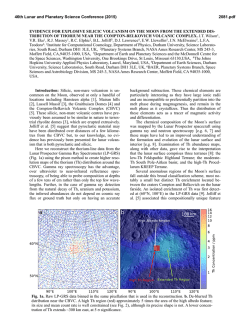
46th Lunar and Planetary Science Conference (2015)
1467.pdf
ANALYSIS OF COMPOSITIONAL VARIATIONS AT NON-MARE VOLCANIC REGIONS USING
LROC NAC PHOTOMETRY AND SPECTRA OF GLASSY AND SILICIC MINERAL MIXTURES. R. N.
Clegg1, B. L. Jolliff1, and E. Coman1, 1Department of Earth & Planetary Sciences and the McDonnell Center for the
Space Sciences, Washington University, 1 Brookings Dr., St. Louis, MO 63130 ([email protected])
Introduction: Regions of non-mare volcanism on
the Moon are rare and returned samples that may be
products of these regions are even rarer. These areas
correlate with thorium (Th) anomalies, as detected by
the Lunar Prospector Gamma-Ray Spectrometer (LPGRS), and have low FeO (<5 wt%) contents and high
reflectance. These characteristics implicate an alkalisuite rock type [1]. Lunar Reconnaissance Orbiter
(LRO) Narrow Angle Camera (NAC) images show
morphological features that indicate volcanic origin
and LRO Diviner spectral data show evidence for
silicic compositions at these sites [1-4]. We use the
Compton-Belkovich Volcanic Complex (CBVC), the
Lassell Massif (LM), the Gruithuisen Domes, and
Hansteen Alpha (HA) for this study.
We have used LRO NAC photometry and Hapke
photometric modeling coupled with soil composition
data to place compositional constraints on these
regions and assess variations in reflectance [5]. The
background areas at the CBVC are highlands-type
materials similar to those seen at the Apollo 16 landing
site. Here we present evidence from laboratory spectra
that addition of glassy silicic materials to a highlandstype simulant can account for the increased reflectance
of these volcanic regions.
Methods: We use NU-LHT-1M, a lunar soil
simulant that was created to be an analog to highlands
materials. It has a composition based on the average
chemical composition of the Apollo 16 regolith and
has 16% agglutinates [6]. Rhyolitic pumice from
Obsidian Dome in Owens Valley, CA, is mixed with
the simulant as an analog for felsic pyroclastics on the
Moon.
NAC Photometry: We chose regions of interest at
the CBVC, LM, and HA, and one ROI at the
Gruithuisen Gamma (GG) dome, and used NAC
images with a variety of illumination conditions to
obtain reflectance data. We then applied a Hapke
photometric function that was optimized from landing
site studies [7] to fit the reflectance (I/F) data (see [6]).
To compare between sites and with our spectral data,
we normalize I/F to a 30° phase angle, I/F(30°).
Spectral Measurements: We measured the pumice
using X-Ray diffraction and found that it is completely
glassy with no crystalline components, making it a
Table 1: Reflectance measurements of samples used for this
study.
Sample
I/F(30°)
NU-LHT
pumice
50 wt% pumice
20 wt% pumice
10 wt% pumice
5 wt% pumice
0.22
0.68
0.51
0.38
0.35
0.33
Percent increase
from NU-LHT
132%
71%
60%
49%
good analog material for our study. The pumice was
crushed and mixed in varying proportions by weight
(5, 10, 20, and 50 wt%) with NU-LHT. We took
spectral measurements of the mixtures using an Ocean
Optics Jaz spectrometer (spectral response range of
190-800 nm) with a pulsed xenon light source. All
measurements were taken at an incidence angle of 30°,
emission angle of 0°, and phase angle of 30°.
The LRO NACs have a spectral response from
400-750 nm, with the average falling around 650 nm.
We convolve our spectral data to I/F values that are
consistent with the NAC spectral responsivity. To
ensure these comparisons are accurate, we took spectra
of several Apollo samples (10084, 14163, 15601, and
71501) and compared their average I/F values to those
recorded from our studies of landing sites [7].
Results: Extracting I/F values for regions of
interest at each non-mare volcanic site and using
Hapke modeling to determine I/F at a common 30°
phase angle gives I/F(30°) values that range from
0.120-0.20 for the CBVC, 0.090-0.170 for HA, 0.0560.083 for LM, and average 0.070 for GG. These values
are most comparable to those of the feldspathic Apollo
16 landing site, which has an I/F(30°) of 0.093 [7].
Table 1 shows the I/F(30°) values measured for the
pumice, NU-LHT, and pumice+NU-LHT mixtures.
The percent increase in reflectance as varying amounts
of pumice were added is also reported. Figure 1a
shows a plot of wt% pumice mixtures versus I/F at 30°
phase angle. Figure 1b shows I/F as a function of
mafics (FeO+MgO+TiO2) estimated for the pumice
mixtures, using an average rhyolitic composition for
the pumice. The I/F values have been convolved to
match the peak spectral responsivity for the NACs.
46th Lunar and Planetary Science Conference (2015)
1467.pdf
Comparatively, adding 20 wt%
pumice to NU-LHT gives a 70%
increase in reflectance. Therefore
we infer that the addition of up to
20 wt% glassy silicic materials
could account for the increased
reflectance at the most reflective
regions of CBVC compared to
average Apollo 16 soils.
The least reflective areas that
we analyzed in the complex, the
α- and β-domes [10] are 17% and
28%
more
reflective,
respectively,
than
the
Fig. 1: Relationship between reflectance (I/F) at 30° phase angle with (a) increasing
background. Comparing to the
amounts of pumice (by weight) mixed with NU-LHT and (b) mafic content for the
samples listed in Table 1.
reflectance of our pumice
mixtures, the domes have less
Discussion: Remote sensing data provide strong
than 5% glassy silicic materials at their surfaces. As
evidence for the presence of felsic materials at the
these positive-relief features have degraded, any
Compton-Belkovich Volcanic Complex, the Lassell
mantling deposits would have been eroded by mass
Massif, Hansteen Alpha, and the Gruithuisen Domes.
wasting, revealing somewhat higher mafic contents
Photometric studies of NAC images and spectral
perhaps compositionally similar to KREEP basalts or
measurements provide insight into
possible
other intermediate composition materials .
mineralogical compositions at these areas.
Conclusions: Photometric analysis of NAC images
There is a linear correlation (R2=0.99) between
and spectral measurements of laboratory samples
increasing amounts of pumice mixed with NU-LHT
provide compositional information for regions of nonand increasing reflectance values (Fig. 1a). In addition,
mare volcanism on the Moon. The high reflectance at
mineralogy of the varying mixtures correlates
these regions is consistent with the presence of silicic
systematically with reflectance. We have previously
materials and low mafic contents. We have shown with
shown that there is a strong anti-correlation between
laboratory spectra that the increased reflectance at the
the mafic (FeO+MgO+TiO2) content of Apollo and
CBVC can be accounted for by the addition of ~20
Luna soils and I/F and have used this information to
wt% glassy silicic/rhyolitic materials. KREEP-like
extrapolate to higher I/F values for the silicic regions
materials such as those seen in the Apollo 14 soil
[8]. The same is true for our pumice mixtures – as
samples or lower glass contents may explain the lower
increasing wt% of pumice is added to the simulant,
reflectance positive-relief features within the complex.
total FeO+MgO+TiO2 content decreases and
The lower reflectance values for Hansteen Alpha, the
reflectance increases (Fig. 1b).
Lassell Massif, and the Gruithuisen Domes may
The CBVC, HA, LM, and GG exhibit a range of
indicate intermediate felsic compositions. The
reflectance values, both among the various regions and
variations in reflectance among and within the CBVC,
within each region. This is especially evident at the
HA, LM, and Gruithuisen Domes may be attributed to
CBVC, where features such as the volcanic cones and
mixing of felsic components, the presence of KREEPy
domes are less reflective than regions in the central
materials, and/or pyroclastic deposits.
Acknowledgements: We thank the LROC
portion of the complex [8]. The reflectance variations
Operations Team for image collection and processing,
among and within each region may be due to mixing of
and we thank NASA for support of the LRO mission.
felsic components, addition of pyroclastic materials,
References: [1] Jolliff B. L. et al. (2011) Nat. Geosci.,
and/or the presence of KREEPy (less silicic) materials.
4, 566-571. [2] Ashley, J. W. et al. (2013) 44th LPSC,
The most reflective surfaces are the mantling deposits,
Abstract #2504. [3] Glotch T. et al. (2010) Science, 329,
which have been hypothesized as possible pyroclastic
1510. [4] Greenhagen B. et al. (2010) Science, 329, 1507. [5]
deposits [1,9]. A small percentage of glassy materials
Clegg R. N. et al. (2014) 45th LPSC, Abstract #1256. [6]
Stoeser D., et al. (2010) NASA/TM-2010-216438. [7] Clegg
such as silicic pyroclastics in this area would account
R. N. et al. (2014) Icarus, 227, 176-194. [8] Clegg R. N. et
for the increased reflectance in these regions, as
al. (2014) LEAG 2014, Abstract #3032. [9] Wilson J. et al.
supported by our measurements.
(2015) This Conf. [10] Jolliff et al. (2012) 43rd LPSC,
The most reflective region in the CBVC is 68%
Abstract #2097.
more reflective than the background highlands.
© Copyright 2026