CERES: POSSIBLE RECORDS OF GIANT IMPACTS. B. A. Ivanov
46th Lunar and Planetary Science Conference (2015)
1077.pdf
CERES: POSSIBLE RECORDS OF GIANT IMPACTS. B. A. Ivanov, Institute for Dynamics of Geospheres,
RAS, 119334, Moscow, Russia, [email protected], [email protected].
Introduction: Recent robotic space mission to the
second largest asteroid Vesta (DAWN [1]) delivered a
lot of new observational data including images and
gravity anomaly measurements. These data create the
new database for planetological analysis including the
re-iteration of previously elaborated models. A set of
studies use these data to compare with numerical models to understand the specific of the impact cratering
processes on Vesta and to support the data interpretation (e.g. [2, 3, 4]). The DAWN arrival to the first
largest asteroid Ceres promises us the new data..
The presentation describes the specifics of the impact modeling for Ceres and displays preliminary results. The most unexpected result is the formation of
impact central mound at the rocky core surface for
Rheasilvia/Veneneia scale impacts on Ceres. The
rocky mounds could survive even after total relaxation
of the initial crater in ice. Gravity footprints of giant
impact could be found with the DAWN gravity mapping of Ceres.
Ceres as a target: The preliminary model of the
Ceres interiors are based on the astronomical data and
geochemical modeling [5, 6, 7]. Temperature at the
center may be estimated in the vicinity of ~400 K with
the gradual decay to the surface. The ice cover
(“crust”) of ~100 km is possible [5]. The unknown
additions to the ice may control the presence or absence of a thin liquid layer (“mantle”) near the surface
to the silicate core. The core may be also layered due
to presence of hydrated minerals in the outer rocky
shell [7] – details are highly depending on the fracture
state of the core and its permeability [7].
Before the better models are available we use the
simplest model close in spirit to published results [5, 6,
7]: the water ice crust above a silicate core. With this
simplest approximation we use available equations of
state (EOS) for H2O [8] and granite (as a proxy for a
rocky material with the density of 2700 kg m-3). Both
EOS’es are tested previously [9, 10].
The acoustic fluidization model with parameters
for the previous Rheasilvia modeling on Vesta [2] is
used. We assume that impacts of projectiles 30 to 40
km in diameter were as frequent on Ceres like on Vesta, and 2 to 4 (or so) large impacts could occur during
Ceres’es geologic history.
Preliminary results: We model vertical impacts
of rocky (same as the core material) projectiles with
diameters from ~28 km to ~80 km at the ice shell ~100
km thick. The impact velocity of 4.5 km s-1 is assumed
to be close to the average impact velocity for Ceres at
the current position in the main belt [11].
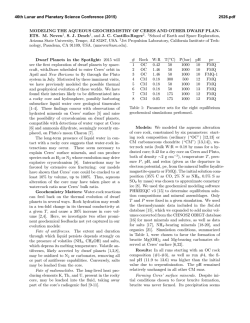
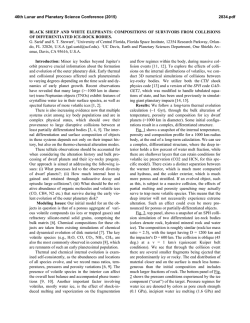
Selected frames illustrate the impact cratering for
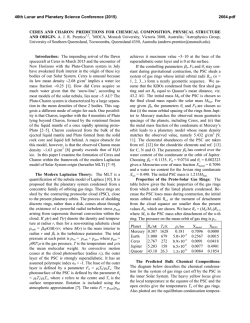
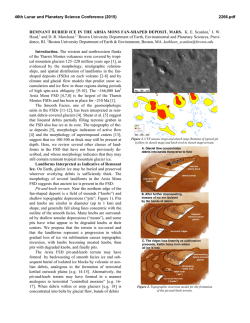
Dproj = 32 km (Fig. 1). The final modeled time moments for the largest (Dproj=80 km) and the smallest
(Dproj=20 km) is shown in Fig. 2. The central mound
formation is observed for all modeled variants with
Dproj > 30 km.
The shock wave is not a strong one here (~15 GPa
and below). However the reflection at the ice/rock
boundary results in the secondary compression of ice
in the reflected wave. The shock wave decay in the
silicate core starts from the same pressure level and
decays below 1 GPa at the depth of ~300 km below
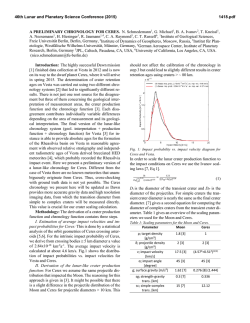
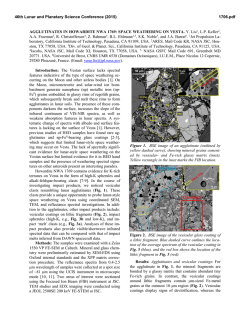
surface. Hence the direct shock heating of rocks is
minor. However the shock stresses are above the
strength level (cohesion plus dry friction) and some
frictional heating here is also available (Fig. 3).
Conclusions: The 2D numerical impact modeling
for Ceres (assuming 100 km ice shell) predicts the
central mound formation for vertical impacts of projectiles same as formed the largest craters on Vesta. We
propose that even after total relaxation of a crater in
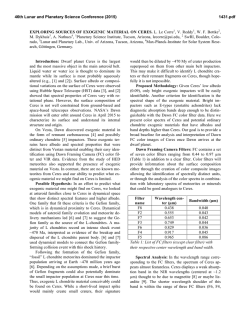
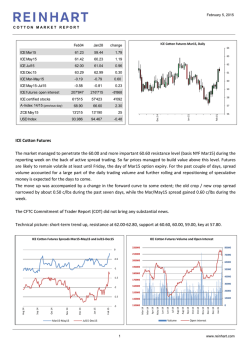
ice, central uplifts for large enough impacts may survive at the rocky core surface. These uplifts (up to 40
km high and ~300 km in diameter – Fig. 4) may be
found with the upcoming DAWN gravity mapping of
Ceres.
Acknowledgments: The work is supported by the
Program 22 “Fundamental Problems of Solar System
Research” (Project 8.3).
References: [1] Russell C. T. et al. (2012) Science,
336, 684–686. [2] Ivanov B. A. and H. J. Melosh
(2013) JGR-Planets, 118, 1545-1557. [3] Ermakov,
A.I., et al. (2014) Icarus, 240, 146-160. [4] Bowling,
T.J., et al. (2013) JGR-Planets, 118, 1821-1834. [5]
McCord, T.B., and C. Sotin (2005) JGR-Planets, 110,
E05009, 1-14, 2005. [6] Castillo-Rogez, J.C., and T.B.
McCord (2010), Icarus, 205, 443-459. [7] Zolotov,
M.Y. (2009) Icarus, 204, 183-193. [8] Ivanov, B.A.
(2005) LPSC 36th, abs. #1232. [9] Ivanov, B.A., and
E. Pierazzo (2011) MAPS, 46, 601-619. [10] Ivanov,
B.A., H.J. Melosh, and E. Pierazzo (2010) In: GSA
Special Papers 465, edited by R.L. Gibson, and W.U.
Reimold, pp. 29-49, Geological Society of America,
Boulder, Colorado, USA. [11] O’Brien D. and M. V.
Sykes (2011) Space Sci. Rev. 163, 41-61. [12] Bland,
M.T. (2013) Icarus, 226, 510-521.
46th Lunar and Planetary Science Conference (2015)
1077.pdf
Å Fig. 1. Model impact of an asteroid Dproj=32.5 km.
Selected frames (top - bottom) for t = 0 s, 100 s,
1000s, 2000 s, 4000 s, and 9000 s. Color shading reflect “damage” of target materials (and partial melting
for the ice crust). Linear scales in 1,000’s km.
Fig. 2. The largest (top, Dproj=80 km) and the smallest
(top, Dproj=20 km) modeled impacts 9,000 seconds
after impact of a rocky projectile.
Fig. 3. Ice crust and rock core boundaries (thick black
curves). Gray shading is for rock temperature at the
central mound summit, blue shading is for liquid percentage in the partially melted ice. Dashed curves
show equipotential surfaces.
Fig. 4. Azimuthal profiles of the surface and rock/ice
boundary for the impact shown in Fig. 1. For Dproj = 32
km the vertical mound rises up 40 km above average.
© Copyright 2026
