
Photoconductivity and the structural phase transition in SrTiO3
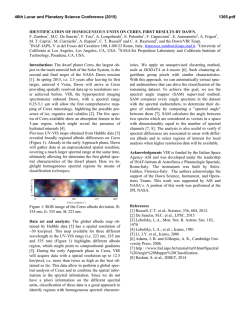
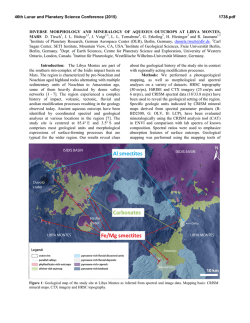
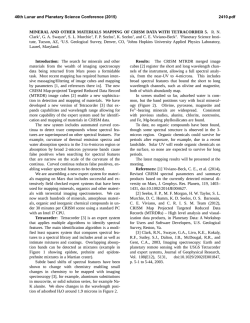
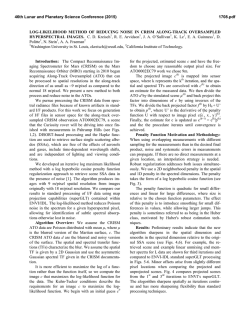
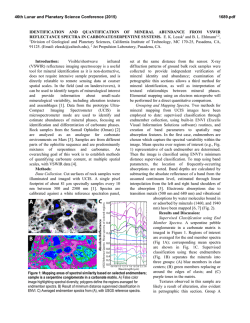
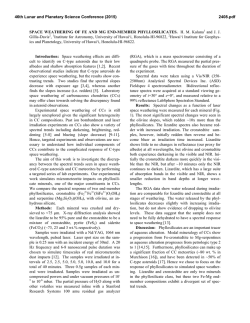
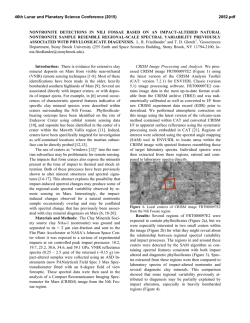
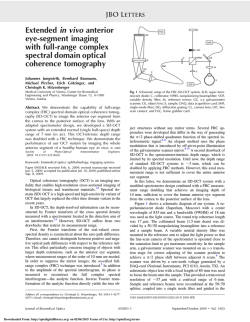
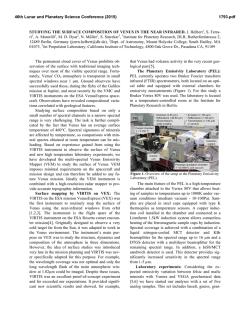
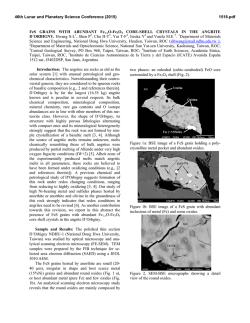
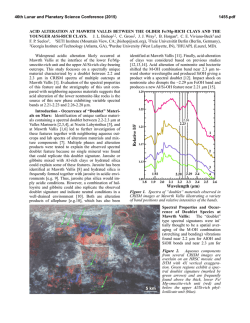
Solid State Communications 141 (2007) 95–98
www.elsevier.com/locate/ssc
Photoconductivity and the structural phase transition in SrTiO3
F. Rossella a,∗ , P. Galinetto a , G. Samoggia a , V. Trepakov b,c , L. Jastrabik b
a Dipartimento di F´ısica “A. Volta”, Universit`a di Pavia, CNISM-1-27100 Pavia, Italy
b Institute of Physics, AS CR, Na Slovance 2, 182 21, Prague 8, Czech Republic
c A. F. Ioffe Physical-Technical Institute, 194 021, St.-Petersburg, Russia
Received 11 May 2006; received in revised form 2 August 2006; accepted 1 September 2006 by J.W.P. Hsu
Available online 20 September 2006
Abstract
Detailed photoconductivity measurements have been performed in nominally pure SrTiO3 in order to elucidate the effect of the
antiferrodistorsive cubic–tetragonal phase transition. Small features in the photoconductivity’s temperature dependence in the phase transition
region were found using low intensity interband UV or 514 nm light illumination. Such features are associated with a transformation of the defect
system controlling the photoconductivity. At the same time, the temperature behavior of the photoconductivity spectral maximum reveals a rather
unusual feature which is connected with changes in the absorption band edge structure in the phase transition region.
c 2006 Elsevier Ltd. All rights reserved.
PACS: 72.20.i; 72.40.+w; 72.80.sk
Keywords: A. Insulators; D. Photoconductivity and phase transitions; E. Photo-transport measurements
1. Introduction
Perovskite quantum paraelectric SrTiO3 (STO) undergoes
18
antiferrodistortive (AFD) cubic–tetragonal structural Oh1 –D4h
phase transition (PT) with Tc ∼ 105 K. Its dielectric
constant increases on cooling implying ferroelectric instability
at lowest temperatures. Recent new intriguing findings in
STO, e.g. 18 O isotope exchange effect [1], reproducible
switching in the leakage current in thin films [2], giant
photoconductivity (PC) [3], and photo-dielectric effect [4,5] as
well as reversible laser irradiation-induced photoluminescence
changes [6], stimulate new efforts to deepen the knowledge of
STO’s basic properties, especially concerning the conduction
mechanisms in connection with structural and photo-induced
phenomena. In particular, the effect of AFD PT on photogenerated carrier transport is still under debate, which has been
studied, up to now, mostly in doped or reduced conductive
specimens. A few papers dealing with nominally pure STO
∗ Corresponding address: Dipartimento di Fisica “A. Volta”, Universit`a di
Pavia, Via Bassi 6, 27100 Pavia, Italy. Tel.: +39 0382 987 682; fax: +39 0382
987 563.
E-mail address: [email protected] (F. Rossella).
c 2006 Elsevier Ltd. All rights reserved.
0038-1098/$ - see front matter doi:10.1016/j.ssc.2006.09.006
gave contradictory results [7–10]. Indeed, a pronounced PC
temperature maximum in the PT region was reported in [7]
and associated with an increase of photo-carrier lifetimes
and the appearance below Tc of new recombination levels.
Nevertheless, the existence of this maximum was not confirmed
in any further work. Minor or not significant changes of the
PC temperature dependence in the PT region were reported
in [9–11]. Besides, a narrow intense peak in the excitation
spectrum of PC at energies slightly lower than the fundamental
absorption edge was reported [9]. In an effort to explain these
phenomena different new mechanisms have been proposed,
e.g. an active role of the structural changes on the carrier
mobility [3] and of domain boundaries formed below Tc [12].
As a result, different authors using different crystals,
sample geometries and experimental conditions have reported
controversial observations on PC features in the PT region
for nominally pure STO. In order to bring new insight in this
problem we undertook systematic investigations of spectral and
temperature dependence of PC in nominally pure STO. We
focused our attention on the AFD PT region, using various
excitation light energies and intensities. In order to take into
account possible surface and domain wall contributions, planar
and sandwich electrodes as well as mono and poly-domain
specimens below Tc were studied.
96
F. Rossella et al. / Solid State Communications 141 (2007) 95–98
Fig. 1. Photo-current density JPC vs. temperature (cooling rate 3 K/min) under
broad-band UV light peaked at 370 nm. Curves 1, 2 and 3, taken illuminating
with the same light intensity, refer respectively to bulk current measured by
sandwich electrode geometry in poly-domain (Ps ) and mono-domain (Ms )
samples, and to surface current measured by surface planar electrodes in monodomain (M p ) sample. We used the symbols and to show the behaviour of
curves 2 and 3 in the whole range.
2. Experimental details
Transparent colorless nominally pure single crystals were
grown by the Verneuil technique and annealed in oxygen
atmosphere at around 1950 ◦ C. The impurity content was less
than 15 ppm of Mg, Si, Al, Fe, Zn, Ni and Cr, as determined by
atomic absorption spectroscopy and X-ray fluorescent analysis.
The specimens were prepared in form of polished plates of
2.45 × 4.25 × 0.8 mm3 size. To study the possible influence of
domain boundaries, both poly-domain (P sample) and monodomain (M sample) below Tc specimens prepared according
to [13] were used. The P sample has two faces oriented along
[100] principal cubic axes and the others randomly oriented;
the faces of the M sample were oriented along [100], [110] and
[110] cubic directions. Silver paint electrodes were deposited
on two opposite faces (sandwich geometry) for bulk current
measurements while surface planar electrodes where used to
evaluate the surface current contribution. The samples were
mounted into a He closed-cycle refrigerator system allowing
measurements in the 15–300 K temperature region. PC was
measured applying a driving electric field of ∼100 kV/m
by a Keithley 6517 electrometer with ∼0.2 pA sensitivity. A
XBO 75 W lamp coupled to interference filters or a Jobin
Yvon monochromator (bandpass of ∼5 nm), as well as an Arlaser were used as photo-excitation sources. The PC excitation
spectra were normalized for equal photon number at each
energy.
3. Results and discussion
The dark conductivity at RT was of the order of
10−14 −1 cm−1 and 10−12 −1 cm−1 for M and P samples
respectively. This can be associated with the better quality of
the M specimen. However, in any case the concentration of
dark free carriers is negligible in comparison with that of photogenerated carriers.
Fig. 2. Temperature dependence of the photo-current IPC for the mono-domain
sample in sandwich configuration (M S ) measured at relative illumination
intensities of 1, 3 and 100 under UV light (a) and of 1, 10 and 100 under laser
light at 514.5 nm (b) irradiation.
Fig. 1 presents the temperature dependence of photo-current
density JPC induced by UV-light (370 nm) for poly-domain
and mono-domain below Tc specimens with planar (M P ) and
sandwich (M S , PS ) electrodes. PC increases on cooling, as
is well known for SrTiO3 and usually attributed to carrier
mobility behavior. The increase is smoother for P samples.
In M samples the PC sharply increases around 35 K and
our estimation for the activation energy of quenching centers
yields ∼100 meV which is less than that obtained in [9]. The
difference in the PC magnitude between M and P samples
vanishes at lowest T where PC reaches nearly the same value
in all examined cases.
PC curves for M S and M P samples are nearly the same,
evidencing the minor role of the surface contribution. The
ratio between photo-current values at RT and at lowest T
was ∼103 for the P sample and ∼104 for the M sample.
The corresponding photo-resistivity reaches ∼108  cm at the
lowest temperatures.
In Fig. 1 no features in the PC around 105 K are observed
which could be associated with the AFD PT. Fig. 2 shows
PC temperature dependence for the M S configuration, i.e. the
mono-domain sample with surface electrodes configuration,
measured at three different UV (Fig. 2(a)) and visible
(Fig. 2(b)) light intensities. It is remarkable that under UV
light, a faint but evident feature appears in the PT region at low
excitation intensities, i.e. at small photo-carrier concentration.
Under excitation at 514.5 nm a pronounced wide smooth
PC temperature maximum appears for each intensity. Such
behavior can be qualitatively explained as follows. In the
case of UV excitation, photo-carriers are generated in the
surface layer and the PC is controlled by recombination rate
of photo-electrons and holes due to their high density, so that
no strong features in the PT region are expected. However,
under 514.5 nm light excitation, photo-carrier generation takes
place in the bulk and is followed by complex trapping, charge
release, re-trapping and charge transfer processes before photoelectrons and holes recombine. In such a case impurity levels
and traps control carrier drift and recombination processes,
and changes in the defect system in the PT region lead to the
F. Rossella et al. / Solid State Communications 141 (2007) 95–98
Fig. 3. Stationary PC excitation spectrum () in the 2–5 eV spectral region at
70 K, treated in order to be compared with absorption coefficient (α) data (N)
at 82 K reported in [14].
Fig. 4. Stationary photo-current IPC excitation spectra in the 2.4–4.4 eV
spectral region, at different temperatures.
appearance of the PC feature, as considered in [7]. A similar
situation can be realized under weak UV excitation and low
photo-induced carrier concentration conditions.
Fig. 3 shows the stationary PC excitation spectrum in
the 2–5 eV spectral region measured at 70 K. Steady state
conditions were reached after a long time so we used an
interpolation procedure in order to obtain the stationary PC
value from the time evolution of the signal.
The spectrum has a conventional shape revealing three
different spectral regions. The PC excited in the region
2–3 eV, i.e. less than band-gap, is attributed to generation
of carriers photo-excited from defect levels. A sharp onset of
PC at ∼3.14 eV due to the band-gap was observed, but in
contrast with observations reported in [9] we didn’t reveal any
anomalous PC narrow maximum in the fundamental absorption
region. The sharp rising PC in the region 3.2–3.34 eV is
controlled by absorption coefficient spectral behavior.
At higher energies a wide PC spectral maximum (FWHM ∼
0.71 eV between 3.27 and 3.98 eV) emerges, followed by a PC
decrease ascribed to the increase of absorption coefficient and
surface recombination mechanisms [15].
Fig. 4 shows PC excitation spectra collected at different
temperatures. The general features remain the same at all
97
Fig. 5. Spectral position of the PC maxima at different temperatures (inset
shows Lytle data [16] for lattice constant, see text).
temperatures. In accordance with results discussed above, PC
increases nearly three orders of magnitude in cooling from RT
to the lowest temperature.
Fig. 5 presents the temperature dependence of the energy
value of the PC spectral maximum. It is seen that cooling from
RT to about 120 K the position of the PC spectral maximum
shifts to higher energies, passing from ∼3.60 eV to ∼3.66 eV at
120 K, with a thermal shift coefficient ∼3×10⁻⁴ eV/K. This is
practically the same as the value reported by Feng in connection
with the observed “anomalous maximum” [9], although the
positions of maxima were different (3.26 eV at RT and 3.35 eV
at 100 K). At around 120 K, the energy value of the PC peak
reaches a maximum.
Such behavior, in particular the decrease of the PC spectral
maximum position on cooling under 120 K, is a very surprising
result. Generally the PC reaches a maximum in the region of
the band-gap edge and its position often is used for band-gap
magnitude estimation. So, the trend shown in Fig. 5 above
120 K is a conventional one. To our mind, the maximum
around 120 K is connected with the AFD phase transition
while the PC decrease just below the AFD PT point can be
connected with two circumstances. First, we note that the
absorption edge in STO in cubic phase is caused by indirect
M → Γ interband BE-optical transitions with 55 meV LO
phonon absorption (3.6 eV), which probably forms the PC
spectral maximum too. Weak R → Γ indirect optical Atransitions in the region ∼3.3 eV do not play an important
role in the PC excitation spectral maximum formation [16,17].
18 cubic–tetragonal PT is controlled by
However, Oh1 → D4h
TO phonon mode softening at the R-point of Brillouin zone;
below PT, the R point merges with the Γ one, and the unit
cell duplicates. In such a case more effective Γ → Γ optical
transitions start to control the PC at the band edge region.
This can induce an appreciable shift of PC spectral maximum
to the lowest energies, as we observed in our experiment. In
addition, the specificity of the temperature dependence of the
lattice parameter for STO (see inset in Fig. 5) reported by
Lytle [18] can also contribute to the observed maximum. The
lattice behavior can promote not only the appearance of the
local maximum in the temperature dependence of the the PC
spectral maximum position, but also the shift of this position
98
F. Rossella et al. / Solid State Communications 141 (2007) 95–98
to lower energies below the PT point. At the same time, it
should be remarked that the PC spectral maximum in STO
appears to be rather wide and the temperature shift takes place
practically inside of this wide maximum. In such a case the
temperature behavior of the PC spectral maximum position
below the AFD PT point can originates from continuing oxygen
octahedra rotation (PT order parameter), lattice parameter
change, complex variations of hierarchy of the optical transition
controlling optical band edge and photo-carrier lifetime in the
surface layers.
optical transitions transform into direct Γ → Γ ones leading to
a significantly lower energy shift of the PC spectral maximum.
Contributions to such behavior came also from the unusual
temperature dependence of the lattice parameter below AFD
PT.
4. Conclusions
References
In this work we presented detailed experimental study of
PC in highly resistive nominally pure SrTiO3 single crystals
within the 15–300 K temperature range and the 2–5 eV spectral
range. The main attention was focused on the influence of the
AFD PT on photo-carrier transport properties. Poly-domain
and mono-domain below PT samples, as well surface and
sandwich type electrodes, were used in order to take into
account domain wall and surface contributions. The study of
the PC temperature dependence indicate that PC is practically
not influenced by surface and domain wall contributions, and
in particular the PT plays a minor role in the photo-transport
phenomena. At the same time, under weak UV interband
excitation and under excitation by visible light, weak and wide
temperature maxima emerge. Such behavior is associated with
the transformation of impurity levels controlling photo-charges
which takes place in the PT region. At the same time structural
transformations accompanying the AFD PT influence the PC
spectral maximum position, with a maximum energy of 3.66 eV
in the PT region. Such unusual behavior is connected with band
structure transformations accompanying the AFD PT in STO.
In the cubic phase the position of the PC spectral maximum
is controlled by indirect M → Γ optical transitions and the
less energetic R → Γ transitions play a minor role. The R
point merges with the Γ point of the BZ at the PT, and indirect
Acknowledgements
This work was supported by Grants RFBR 06-02-17320, AV
ˇ AV0Z 10100522 and Italian Grant FIRB RBNE01KZ94.
CR
[1] M. Itoh, R. Wang, Y. Inaguma, T. Yamaguchi, Y-J. Shan, T. Nakamura,
Phys. Rev. Lett. 82 (1999) 3540.
[2] A. Beck, J.G. Bednorz, Ch. Geber, C. Roseel, D. Widmer, Appl. Phys.
Lett. 77 (2000) 139.
[3] H. Katsu, H. Tanaka, T. Kawai, Japan J. Appl. Phys. 39 (2000) 2657.
[4] M. Takesada, T. Yagi, M. Itoh, S.-Y. Koshihara, J. Phys. Soc. Japan 72
(2003) 37.
[5] T. Hasegava, S. Moury, Y. Yamanaka, K. Tanaka, J. Phys. Soc. Japan 72
(2003) 41.
[6] S. Mochisuki, F. Fujishiro, S. Minami, J. Phys.: Condens. Matter 17
(2005) 923.
[7] J.T. Sihvonen, J. Appl. Phys. 38 (1967) 4431.
[8] A.L. Kholkin, E.V. Kuchis, V.A. Trepakov, Ferroelectrics 83 (1988) 135.
[9] T. Feng, Phys. Rev. B. 25 (1982) 627.
[10] T. Hasegava, S. Moury, Y. Yamanaka, K. Tanaka, J. Luminescence 87–89
(2000) 1217.
[11] A.L. Kholkin, Ph.D. Thesis, A.F Ioffe Physical–Technical Institute,
St.-Petersburg, 1988, p. 81.
[12] Y. Yasunaga, I. Nakada, J. Phys. Soc. Japan 22 (1967) 338.
[13] K.A. Mueller, W. Berlinger, M. Capizzi, H. Granicher, Solid State
Commun. 8 (1970) 549.
[14] M. Capizzi, A. Frova, Phys. Rev. Lett. 25 (1970) 1298.
[15] R. Bube, Photoconductivity of Solids, J. Wiley and Sons Inc, New York,
London, 1960, p. 390.
[16] S.I. Shablaev, A.M. Danishevskii, V.K Subashiev, Fizika Tverdogo Tela
26 (1984) 179.
[17] S.I. Shablaev, A.M. Danishevskii, V.K. Subashiev, ZhETP 86 (1984)
2158.
[18] F.W. Lytle, J. Appl. Phys. 35 (1964) 2212.

© Copyright 2026