
MINERAL AND OTHER MATERIALS MAPPING OF CRISM DATA
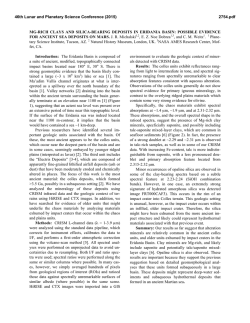
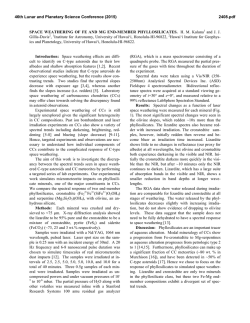
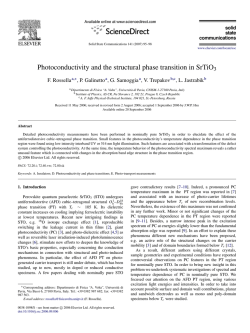
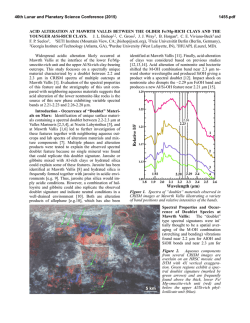
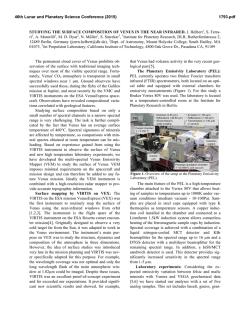
46th Lunar and Planetary Science Conference (2015)
2410.pdf
MINERAL AND OTHER MATERIALS MAPPING OF CRISM DATA WITH TETRACORDER 5. R. N.
Clark 1, G. A. Swayze2, S. L. Murchie3, F. P. Seelos3, K. Seelos3, and C. E. Viviano-Beck3. 1Planetary Science Institute, Tucson, AZ, 2U.S. Geological Survey, Denver, CO, 3Johns Hopkins University Applied Physics Laboratory,
Laurel, Maryland.
Introduction: The search for minerals and other
materials from the wealth of imaging spectroscopy
data being returned from Mars poses a formidable
task. Most recent mapping has required human intensive massaging/filtering of image cubes and mapping
by parameters [1, and references there in]. The new
CRISM Map-projected Targeted Reduced Data Record
(MTRDR) image cubes [2] enable a new sophistication in detection and mapping of materials. We have
developed a new version of Tetracorder [3] that expands capabilities and wavelength range allowing for
more capability of the expert system used for identification and mapping of materials in CRISM data.
The new system includes automated curved continua to detect trace compounds whose spectral features are superimposed on other spectral features. For
example, curvature of thermal emission spectra and
water absorption spectra in the 3 to 4-micron region or
absorption by broad 2-micron pyroxene bands cause
false positives when searching for spectral features
that are narrow on the scale of the curvature of the
continua. Curved continua reduces false positives, enabling weaker spectral features to be detected.
We are assembling a new expert system for materials mapping on Mars that includes successful and extensively field checked expert systems that have been
used for mapping minerals, organics and other materials with terrestrial imaging spectrometers. We can
now search hundreds of minerals, amorphous materials, organic and inorganic chemical compounds in under 30 minutes per CRISM scene using a standard PC
with an Intel I7 CPU.
Tetracorder: Tetracorder [3] is an expert system
that applies multiple algorithms to identify spectral
features. The main identification algorithm is a modified least squares system that compares spectral features to a spectral library and includes areal as well as
intimate mixtures and coatings. Overlapping absorption bands can be detected as mixtures (example in
Figure 1 showing epidote, prehnite and epidoteprehnite mixtures in a Martian crater).
Subtle band shifts of spectral features have been
shown to change with chemistry enabling small
changes in chemistry to be mapped with imaging
spectroscopy [3], for example, aluminum substitutions
in muscovite, or solid solution series, for example NaK alunite. We show changes in the wavelength position of adsorbed H2O around 1.9 microns in Figure 2.
Results: The CRISM MTRDR merged image
cubes [2] register the short and long wavelength chan nels of the instrument, allowing a full spectral analysis, from the near-UV to 4-microns. This includes
broad spectral features that bound the short to long
wavelength channels, such as olivine and magnetite,
both of which abundantly map.
In scenes studied so far, adsorbed water is common, but the band positions vary with local mineralogy (Figure 2). Olivine, pyroxene, magnetite and
Fe3+-bearing minerals are widespread. Consistent
with previous studies, alunite, chlorite, nontronite,
and Fe, Mg-bearing phyllosilicates are found.
To date, no organic compounds have been found,
though some spectral structure is observed in the 3micron region. Organic chemicals could survive for
periods after exposure, for example, due to a recent
landslide. Solar UV will erode organic chemicals on
the surface, so none are expected to survive for long
periods.
The latest mapping results will be presented at the
meeting.
References: [1] Viviano-Beck, C. E., et al. (2014),
Revised CRISM spectral parameters and summary
products based on the currently detected mineral diversity on Mars, J. Geophys. Res. Planets, 119, 1403–
1431, doi:10.1002/2014JE004627.
[2] Seelos, F. P., M. F. Morgan, H. W. Taylor, S. L.
Murchie, D. C. Humm, K. D. Seelos, O. S. Barnouin,
C. E. Viviano, and C. R. I. S. M. Team (2012),
CRISM Map Projected Targeted Reduced Data
Records (MTRDRs) – High level analysis and visualization data products, in Planetary Data: A Workshop
for Users and Software Developers, U.S. Geological
Survey, Reston, Va.
[3] Clark, R.N., Swayze, G.A., Livo, K.E., Kokaly,
R.F., Sutley, S.J., Dalton, J.B., McDougal, R.R., and
Gent, C.A., 2003, Imaging spectroscopy: Earth and
planetary remote sensing with the USGS Tetracorder
and expert systems, Journal of Geophysical Research,
Vol. 108(E12), 5131,
doi:10.1029/2002JE001847,
p. 5-1 to 5-44, 2003.
46th Lunar and Planetary Science Conference (2015)
Illustration 1: Figure 1. CRISM Tetracorder mineral map of epidite, prehnite, and epidoteprehnite mixtures.
Illustration 2: Figure 2. CRISM Tetracorder map of absorbed water at seven positions from
1.91to 1.94 microns. The 2.02 micron absorption position is due to water ice.
2410.pdf
© Copyright 2026