
Mg-Rich Clays and Silica-Bearing Deposits in Eridania Basin
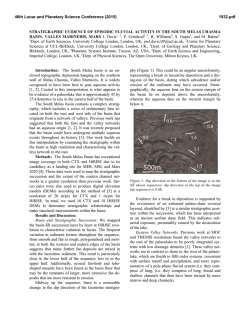
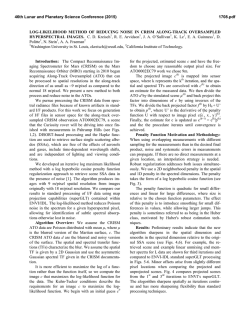
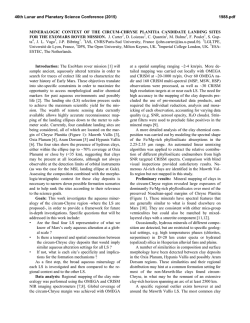
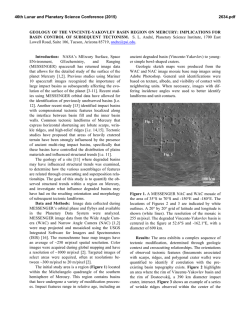
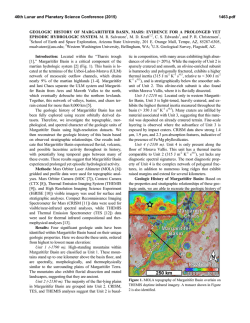
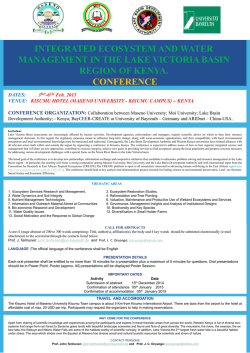
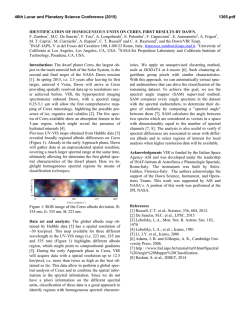
46th Lunar and Planetary Science Conference (2015)
2754.pdf
MG-RICH CLAYS AND SILICA-BEARING DEPOSITS IN ERIDANIA BASIN: POSSIBLE EVIDENCE
FOR ANCIENT SEA DEPOSITS ON MARS. J. R. Michalski1,2, E. Z. Noe Dobrea1,3, and C. M. Weitz1. 1 Planetary Science Institute, Tucson, AZ. 2 Natural History Museum, London, UK. 3NASA AMES Research Center, Moffet, CA.
Introduction: The Eridania Basin is composed of
a suite of ancient, modified, topographically connected
impact basins located near 180° E, 30° S. There is
strong geomorphic evidence that the basin likely contained a large (~3 x 10⁶ km2) lake or sea [1]. The
Ma’adim Vallis channel originates at what is interepreted as a spillway over the north boundary of the
basin [1]. Valley networks [2] draining into the basin
within the ancient terrain surrounding the basin generally terminate at an elevation near 1100 m [1] (Figure
1), suggesting that an acient sea level was present over
an extensive period of time near this topographic level.
If the surface of the Eridania sea was indeed located
near the 1100 m-contour, it implies that the basin
would have contained a sea ~1 km-deep.
Previous researchers have identified several important geologic units associated with the basin. Of
these, the most ancient appears to be the colles units,
which occur near the deepest parts of the basin and are
in some cases, seemingly embayed by younger ridged
plains (interpreted as lavas) [2]. The third unit includes
the “Electris Deposits” [3-4], which are composed of
apparently fine-grained lithified airfall deposits (ash or
dust) that have been moderately eroded and chemically
altered in places. The focus of this work is the most
ancient material: the colles deposits, which formed
>3.5 Ga, possibly in a subaqueous setting [2]. We have
analyzed the mineralogy of these deposits using
CRISM infrared data and the geologic context of terrains using HiRISE and CTX images. In addition, we
have searched for evidence of older units that might
underlie the chaos materials by analyzing materials
exhumed by impact craters that occur within the chaos
and plains units.
Methods: CRISM L-channel data (λ = 1-3.9 µm)
were analyzed using the standard data pipeline, which
corrects for instrument effects, calibrates the data to
I/F, and performs a first-order atmospheric correction
using the volcano-scan method [5]. All spectral analyses were performed on unprojected data to avoid uncertainties due to resampling. Both I/F and ratio spectra were used; spectral ratios were performed along the
same or similar columns where possible. In many cases, however, we simply averaged hundreds of pixels
from geological regions of interest (ROIs) and ratioed
those data against spectrally unremarkable surfaces of
similar albedo (where possible) in the same scene.
HiRISE and CTX images were imported into a GIS
environment to evaluate the geologic context of minerals detected with CRISM data.
Results: The colles units exhibit reflectances ranging from light to intermediate in tone, and spectral signatures ranging from spectrally unremarkable to clear
absorption features consistent with aqueous alteration.
Observations of the colles units generally do not show
spectral evidence for primary igneous mineralogy, in
contrast to the overlying ridged plains materials which
contain some very strong evidence for olivine.
Specifically, the chaos materials exhibit spectral
absorptions at ~1.4 µm, ~1.9 µm, and at 2.31-2.32 µm.
These absorptions, and the overall spectral shape in the
ratioed spectra, suggest the presence of Mg-rich clay
minerals, specficially saponite, and possibly including
talc-saponite mixed-layer clays, which are common in
seafloor sediments [6] (Figure 2). In fact, the presence
of a strong doublet at ~2.29 and ~2.31 µm is observed
in talc-rich samples, as well as in some of our CRISM
data. With increasing Fe-content, talc is more indistinguishable from saponite, with a less pronounced doublet and primary absorption feature located from
2.315-2.32 µm.
Minor occurrences of opaline silica are observed in
some of the clay-bearing spectra based on a subtle
spectral feature at 2.23-2.24 (SiOH combination
bands). However, in one case, an extremely strong
signature of hydrated amorphous silica was detected
image FRT000CAF3). This occurs in the rim of an
impact crater into Colles terrain. This geologic setting
is unusual, however, as the impact crater occurs within
an infilled, older impact crater. Therefore, the silica
might have been exhumed from the more ancient impact structure and likely could represent hydrothermal
materials associated with that previous event.
Summary: Our results so far suggest that alteration
minerals are relatively common in the ancient colles
units, and older units exhumed by impact craters in the
Eridania Basin. Clay minerals are Mg-rich, and likely
include saponite and potentially talc/saponite mixedlayer clays [6]. Opaline silica is also observed. These
results are important because they support the previous
suggestion based on detailed geomorphological analyses that these units formed subaqueously in a large
basin. These deposits might represent deep-water sediments and subaqueous hydrothermal deposits that
formed in an ancient Martian sea.
46th Lunar and Planetary Science Conference (2015)
2754.pdf
References: [1] Irwin, R.P. et al (2004). J. Geophys. Res., 109, E12009. [2] Baker, D. M. and J. W.
Head (2014), 44th LPSC, abstract #1252. [3] Grant, J.
A. et al. (2010). Icarus 205, 53-63.[4] Grant, J. A. and
P. H. Schultz (1990). Icarus 84, 166-195.. [5] Murchie,
S. L. et al. (2009). JGR Planets, 114, E00D06. [6]
Cuadros, J. et al. (2013). Chem. Geol. 360-361, 142158. [7] Hynek, B. M. et al. (2010), JGR Planets, 115,
E003548
Ma’adim Vallis
colles
volcanic
resurfacing
colles
Eridania Basin
colles
volcanic
resurfacing
Figure 1: The Eridania basin is bounded by the 1100 m-contour line, with colors indicating topography above this elevation.
Many valley networks [7] (white lines) terminate at this level [1], which might indicate that an ancient baselevel occurred at this
elevation. It is also the elevation of the Ma’adim Vallis spillway [1].
CRISM 4585
CRISM 8d2d
CRISM 12fd9
CRISM caf3
100 m
saponite
talc/saponite
talc/saponite
MgOH
amorphous
silica
12fd9
SiOH
1.0
1.5
2.0
wavelength ( m)
2.5
Figure 2: (left) CRISM ratioed spectra compared with selected laboratory data . (lower right) A false color CRISM image containing talc
(12fd9). (upper right) HiRISE blowup image of the talc-bearing deposits. The deposit contains ridges and fractures that might indicate mineralized zones (veins).

© Copyright 2026