
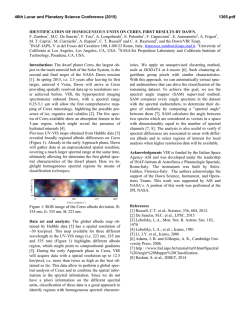
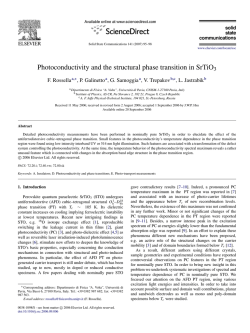
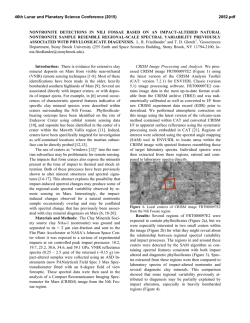
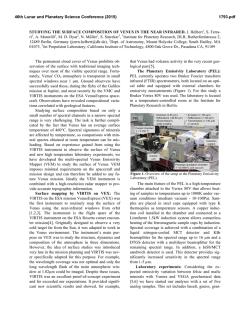
Position dependent spatial and spectral resolution
PDF hosted at the Radboud Repository of the Radboud University Nijmegen The following full text is a publisher's version. For additional information about this publication click this link. http://hdl.handle.net/2066/72071 Please be advised that this information was generated on 2015-02-06 and may be subject to change. JOURNAL OF APPLIED PHYSICS 103, 083914 (2008) Position dependent spatial and spectral resolution measurement of distributed readout superconducting imaging detectors R. A. Hijmering,1,a) P. Verhoeve,1 A. G. Kozorezov,2 D. D. E. Martin,1 J. K. Wigmore,2 I. Jerjen,1 R. Venn,3 and P. J. Groot4 1Advanced Studies and Technology Preparation Division, Directorate o f Science o f the European Space Agency, ESTEC, P.O. Box 299, 2200 A G Noordwijk, The Netherlands 2D epartment o f Physics, Lancaster University Lancaster LA1 4YB, United Kingdom 3Cambridge MicroFab Ltd., Broadway, Bourn, Cambridgshire CB3 7TA, United Kingdom 4D epartment o f Astrophysics, Radboud University Nijmegen, P.O. Box 9010, 6500 GL Nijmegen, The Netherlands (R eceived 15 N ovem ber 2007; accepted 19 February 2008; published online 29 A pril 2008) W e present direct m easurem ents o f spatial and spectral resolution o f cryogenic distributed readout im aging detectors (DRO ID s). T he spatial and spectral resolutions have been experim entally determ ined by scanning a 10 ¡vm spot o f m onochrom atic visible light across the detector. The influences o f the photon energy, bias voltage, and absorber length and w idth on the spatial and spectral resolutions have been exam ined. T he confinem ent o f quasiparticles in the readout sensors (superconducting tunnel junctions) as w ell as the d etecto r’s signal am plitude can b e optim ized by tuning the bias voltage, thereby im proving both the spatial and spectral resolutions. Changing the length of the absorber affects the spatial and spectral resolutions in opposite m anner, m aking it an im portant param eter to optim ize the D R O ID for the application at hand. T he results have been used to test expressions for photon energy, position, and spatial and spectral resolutions w hich have been derived by using an existing one-dim ensional m odel. T he m odel is found to accurately describe the experim ental data, but som e lim itations have been identified. In particular, the m o d el’s assum ption that the tw o sensors have identical response characteristics and noise, the approxim ation of the detailed quasiparticle dynam ics in the sensors by border conditions, and the use o f a one-dim ensional diffusion process is not alw ays adequate. © 2008 A m erican Institute o f Physics. [DOI: 10.1063/1.2907970] I. INTRODUCTION C ryogenic detectors are w idely used in photon counting spectrophotom eters because o f their spectroscopic capabili ties. A num ber o f system s are currently under developm ent that uses superconductivity as the basis o f photon detection. transition edge sensors1 (TESs) are tem perature biased on the superconducting-norm al transition and m easure the change in tem perature due to the absorption o f a photon through a change of resistance of the detector. K inetic inductance detectors2 (KIDs) rely on the change in inductance caused by the increase in num ber o f quasiparticles (qps) excited by the absorbed photon. W hen placed inside a resonant circuit, the change in inductance w ill create a change in resonance fre quency o f the circuit. A Superconducting Tunnel Junction (STJ) consists of two thin layers o f superconducting m aterial separated by an insulating layer. The excited qps tunnel through the insulating barrier to the opposite electrode and, in the presence o f a dc bias voltage, produce a m easurable current pulse. In each o f these detectors, the m easurable quantities are proportional to the energy o f the absorbed p h o ton, thus providing the intrinsic spectroscopic capability. The best resolutions obtained w ith cryogenic detectors to date are 0.105 eV at 2.48 eV at optical w avelengths3 using STJs, w hile in the x-ray part o f the spectrum a resolution o f 1.8 eV a)Electronic mail: [email protected]. 0021-8979/2008/103(8)/083914/10/$23.00 at 6 keV has recently been achieved by B andler et al. using TESs. W hile the developm ent o f individual devices, up to a few hundreds o f m icrons in size, is w ell advanced, difficul ties arise in the attem pt to create larger area detectors w hich possess equivalent, high spatial, and spectral resolution. T he sim plest approach is to fabricate close-packed arrays o f in dividual detectors, each w ith their own signal wire, bias cir cuit, and readout circuit. This route has been follow ed in the superconducting tunnel junction cam era (S-CAM ) project at E SA , in w hich STJ arrays are being developed as im aging photon detectors for use in optical astronom y. W ith S-CAM 2 and S-C A M 3 a 6 X 6 and a 10 X 12 array o f 33 X 33 fvm STJs have successfully been used as optical photon counting spectrom eters on the W illiam H ershel telescope (La Palm a, Spain) and the O ptical G round Station5 (Tenerife, Spain). T he current cam era can handle a count rate up to 8 kH z/pixel and w ith a m axim um resolving pow er o f 14 at 500 nm and m icrosecond tim ing accuracy. T he therm al load from the sig nal w ires on the cooling system and the size o f the readout electronics p u t a practical lim it on the num ber o f pixels w hich can be read out in this way. A m ultiplexed readout, in w hich several pixels share a single signal w ire and readout electronics, can considerably extend this lim it. In particular, detectors w hich use superconducting quantum interference device (SQ U ID )-based readout system s such as T E S ’s are w ell suited for this. STJs are usually readout w ith J-FETs at room tem perature, w hich inhibits m ultiplexed readout, but 103, 083914-1 © 2008 Am erican Institute of Physics Downloaded 24 Jun 2011 to 131.174.17.26. Redistribution subject to AIP license or copyright; see http://jap.aip.org/about/rights_and_permissions 083914-2 Hijmering et al. SQ U ID readout has also been dem onstrated.6 The readout of KID s can be conveniently m ultiplexed by using different resonance frequencies for each KID. To further increase the sensitive area distributed readout im aging detector (DROID) configurations are being d ev el oped. In these devices the photon is absorbed in a single absorbing layer w ith tw o or m ore sensors, in the form of TESs, K ID s, or STJs, at the edges. T he resulting excited qps, or phonons in the case o f TESs, diffuse rapidly throughout the film and are detected in the sensors. The position of absorption and the energy o f the incident photon can b e d e term ined from the m agnitudes of the sensor responses. D e pending on the configuration o f the sensor the signal carriers can be free to diffuse in and out o f the sensor, b e trapped inside the sensor, or som e interm ediate situation can occur. Trapping o f signal carriers inside the sensor w ill decrease the cross-talk (signal carriers contributing to the signal in both sensors) betw een the tw o sensors and increase the signal am p litude o f the D R O ID . This type o f trapping should not be o confused w ith local trapping w hich im m obilizes qps either due to the presence o f localized states inside the supercon ductor gap or by localized areas w ith suppressed gap, e.g., due to im purities, keeping the qps aw ay from the tunnel b ar rier. W hether or not such a detector is useful in practice depends on w hether the spatial and spectral resolutions o f the m easurem ents are at least com parable to that of a detector consisting o f individual pixels. A s w ill be described below in Sec. II, although there has been great interest in this area, there have been no previous m easurem ents carried out on the dependence of spatial and spectral resolutions o f a D R O ID on the position of the photon absorption. A lthough the results show n below are relevant to other types of detectors as well, they are obtained w ith D RO ID s that use STJs as sensors. STJs are sensitive to photon ener gies ranging from the F IR (E > 2A) up to the x-ray w ave length range. D ue to the low energy gap (typically below 1 m eV) the absorption o f a photon creates a large num ber of qps, typically ~ 2 0 0 0 for the absorption o f an optical photon. T he num ber of qps created is proportional to the incident energy and is given by N = E 0/ e, w ith N the num ber o f qps, E 0 the energy o f the incident photon, and e = 1.75A the av erage energy needed to break a C ooper pair. H ere A is the gap energy and the factor o f 1.75 arises from the efficiency o f converting the absorbed photon energy into qps.9 In its lifetim e a qp can tunnel m any tim es over the barrier p ro d u c ing an internal am plification.10 This increases the signal o ut put but adds an extra statistical fluctuation on the charge output. T he energy resolution o f a STJ is given by A E (E 0) SE (E 0) = 2 .3 5 5 [(F + G + J + H )e E 0 + (Kv+ K H)E 20]1/2, w ith F the Fano factor, G extra statistical fluctuation due to tunnel ling, and J a description o f the statistical fluctuations on the converted energy due to loss o f productive phonons into the substrate in thin films. T he cancelation factor H accounts for the statistical fluctuations in the ratio o f direct and cancela11 3 tion tunnel events. K v the vertical inhom ogeneity factor accounts for the dependence o f the deposited energy on the distance betw een the absorption site and the phonon escape interface betw een the superconducting m aterial and the sub strate, and the horizontal inhom ogeneity factor K H accounts J. Appl. Phys. 103, 083914 (2008) for spatial variations in the responsivity over the area o f the 12 device. In addition to these internal noise sources, there are also external sources w hich influence the resolution such as the electronic noise associated w ith the readout and possible IR background load. To reduce the current o f therm ally ex cited qps, the operating tem perature m ust be w ell below the critical tem perature o f the m aterial (T < 0.1Tc). F or the w idely used tantalum STJs, w ith a A = 700 ¿ e V , the operat ing tem perature lies around 300 mK. In this paper, w e w ill describe m easurem ents of both spectral and spatial resolutions as a function o f absorption position obtained by scanning a m onochrom atic optical beam w ith a diam eter o f 10 ¿ m across the absorber. W e used a D R O ID configuration consisting of an absorber strip o f tan talum w ith a STJ w ith suppressed gap on each end. The relation betw een the spectral and spatial resolutions was com pared to the result o f a one-dim ensional (1D) diffusion 13 m odel of the D R O ID response by K raus et al. and Jochum et al. 14 from w hich w e derived the expressions for the photon energy, absorption position, spectral resolution, and spatial resolution. T he m easurem ents w ere perform ed as a function o f various internal and external param eters to find the opti m al conditions for both spectral and spatial resolutions. II. MODELING OF DROID RESPONSE M any groups have studied the processes involved w ith position sensitive detector response and noise factors affect13 ing its resolving pow er. K raus et al. produced a widely used relation betw een the spectral and spatial resolutions for D R O ID s w ith perfect qp trapping in the STJs. Jochum et a l.14 have produced a generalization of this m odel in order to include im perfect qp trapping in the STJs. This paper gives the expressions for the charge output for the right (R ) and left (L) side STJs in the form E 0c q r (+),l (-) = 1 ± + x0 u a\ — 1 + sinh a — — I + ßo cosh ± x—0 2 L 2 L (1 + ß 2)sinh a + 2 ß cosh a (1) H ere QR L is a m easure for the total num ber of tunneled electrons collected by the right and left STJs w ith the “ + ” sign for the right STJ and the “ —” sign for the left STJ, c is the proportionality factor w hich relates the observed charge to the num ber o f qps reaching the STJ, L is the length o f the absorber, and x 0 is the coordinate o f the photon absorption position along the 1D D R O ID . T he characteristic param eter describing qp loss inside the absorber a = L / v D rloss,abs is given by the ratio betw een the length of the absorber and the square root o f the product betw een the diffusion constant D and the loss tim e in the absorber Tloss,abs. T he param eter ß , ß = Vrtr/ Tloss,abs, w hich is given by the square root o f the ratio betw een the characteristic trapping tim e r tr and the loss tim e in the absorber, has been introduced as a boundary condition to account for partial trapping o f qps by the STJ. It describes w hich fraction o f the qps is collected in the STJ and contrib utes to the m easured signal. This is an approxim ation for the actual in and out fluxes o f qps in the STJ because the dy nam ics o f qps in the STJ is m ore com plicated. qps m ay be Downloaded 24 Jun 2011 to 131.174.17.26. Redistribution subject to AIP license or copyright; see http://jap.aip.org/about/rights_and_permissions 083914-3 Hijmering et al. J. Appl. Phys. 103, 083914 (2008) inelastically scattered, the process leading to their trapping, they also m ay diffuse back into the absorber or they may tunnel, gain energy in the tunnel process and leave the STJ if after the tunnel process, they em erge w ith sufficiently high energy to diffuse into the absorber. Further processes inside the STJ affecting the charge output as qps loss, trapping by local traps, and m ultiple tunneling are accounted for by the proportionality factor c . S egall11 developed a m odel for D R O ID s w ith STJs p ro duced from a single superconducting m aterial w hich in cluded the processes inside the STJs. L ater they described the w ay to control outdiffusion in order to optim ize the d evice.15 D en H artog et a l.16 produced a tw o-dim ensional (2D) diffusion m odel w ithout trapping based on the 17 R othw arf-Taylor equations w ith w hich they m odeled the current pulse resulting from x-ray absorptions. E jrnaes et a l.1 developed, using a different approach, a sim ilar 2D d if fusion m odel. A drianov et a l.19 have recently developed a 2D diffusion m odel w hich takes into account qp loss at the edges of the absorber and qp trapping in the STJs. A lso recently Sam edov20 produced a 2D m odel w hich gives a relation for the spectral and spatial resolutions, assum ing perfect trap ping o f qp in the STJs. F urlan et al.21 used the m odel as derived by Jochum et a l.14 to analyze the charge output of their devices w hich they illum inate by using a pulsed light em itting diode to produce single and m ultiple photon events. To estim ate the spectral resolution they used the therm ody nam ic lim it on the resolution. B ased on the original result o f Jochum et a l.,14 w e have now derived all necessary expressions for com parison and interpretation o f our experim ents. W e used an approach simi13 lar to that of K raus et al. and found the expressions for the position o f the absorption site, photon energy and spectral and spatial resolutions. Specifically w e have derived the re lation betw een spatial and spectral resolutions w hich is u se ful in the case o f uniform illum ination w hen only the spectral resolution can b e directly determ ined. T he absorption p o si tion depends only on the ratio of the tw o signals. Thus, re arranging the term s in Eq. (1) and using hyperbolic relations give the follow ing expression for the position as function of the m easured charge outputs: x° = L , [ QRea/2(1 + ß ) + QLe-a/2( 1 - ß ) 1 2 a I . QRe~a!2( 1 - ß ) + QLea!2( 1 + ß ) J . (2) U Sum m ing the charge outputs in Eq. (1 ) and rearranging the term s, w e obtained the follow ing expression for the energy as function o f the m easured charge outputs: E 0 = e V(QR + QL)(1 - ß 2) + 2 Q rQ l[(1 + ß 2)cosh a + 2 ß sinh a ] c (3) 13 In order to derive spectral and spatial resolution w e used the assum ption that the uncertainty in the charge m easured by either STJ is the same, AQ L= A Q R= AQ. In general this assum ption can not always be justified b ut it can be justified e.g in the case w hen electrical noise or w hen the IR background is the dom inant noise contribution. Im plicit differentiation w ith the use of Eqs. (2) and (3) yields the follow ing expressions for spatial and spectral resolutions: e L 2x 0a Ax = A Q --------A /[(1 + ß 2)cosh a + 2 ß sinh a ] c o s h ---------- (1 - ß ), Eçjc a y L (4) A E = A Q e -y [(1 + ß 2)cosh a + 2 ß sinh a ]c o sh (5) + (1 - ß 2) . T he relation betw een the spatial and spectral resolutions becom es E0 AE L (6) A x^) ’ w here ^(x0) is given by 1[(1 + ß 2)cosh a + 2 ß sinh a ]c o sh — — + (1 - ß 2) ^(x0) = a \ i ------------------------------------------------ 2x“ a --------------- • [(1 + ß 2)cosh a + 2 ß sinh a ]c o sh ° - (1 - ß 2) W hen using this model, som e lim itations need to b e kept in diffusion process is still 2D. For D R O ID s w ith a smaller m ind. Firstly, the m odel describes a 1D diffusion process. aspect ratio this tw o dim ensionality becom es m ore evident. H ow ever, for absorptions near the STJ (up to a distance of Secondly, the m odel assum es the responsivity o f the two roughly the w idth of the absorber aw ay from the STJ), the STJs to b e equal. In practice, there are always slight differ- Downloaded 24 Jun 2011 to 131.174.17.26. Redistribution subject to AIP license or copyright; see http://jap.aip.org/about/rights_and_permissions 083914-4 Hijmering et al. J. Appl. Phys. 103, 083914 (2008) FIG. 1. Schematic representation of the DROID configuration. ences betw een the STJs due to the fabrication process lim i tations. This gain difference cannot be corrected for due to the coupling betw een the tw o STJs. Thirdly, its validity d e pends on the assum ption o f equal noise densities in both STJs. T he obvious advantage o f the m odel is that it is sim ple and treats a general case in w hich im perfect trapping is taken into account. This situation applies for D R O ID s w ith proxim ized STJs or KID S as detectors at the ends o f a linear absorber. W hen taking the lim it o f ß ^ 0, the case for perfect 13 trapping as given by K raus et al. is retrieved, applicable if, for exam ple, for a D R O ID w ith a tantalum absorber and pure alum inium STJs or if TESs are used as detectors. III. EXPERIMENTAL DETAILS W e have m easured the spatial and spectral resolutions as function o f photon energy, bias voltage, absorber length (L), and w idth (w ). T he experim ents w ere focused around three separate objectives. T he first w as to experim entally test the 13 theoretical predictions published earlier by K raus et al. and Jochum et al.14 and the resulting derivations in the present paper. Secondly, since the spectral resolution is largely fixed by internal physical processes, w e aim ed to explore the d e pendence of the spatial resolution on external variables such as photon energy and bias voltage. Finally, w e studied the effect o f varying the design o f the D RO ID , notably its length and width. Several devices of different geom etries w ere produced by C am bridge M icroFab Ltd. (Ref. 22) on a single chip so that variations betw een devices due to the production process are expected to be small. T he devices consist o f a 100 nm thick absorber strip o f tantalum w ith a proxim ized T a / Al STJ on either end. T he STJs have a layout of T a / A l/ A lO x/ A l/ Ta w ith thicknesses of 100/60/1/60/100 nm (Fig. 1) . T he alum inium layer suppresses the energy gap from 700 to 420 ¿ e V , providing m ild trapping to confine the qps in the S T J’s area. T he tantalum layer of the STJ base electrode is integral w ith the absorber. T he devices have lengths (Ld ro id ) ranging from 200 to 400 ¿ m , all lengths of the D R O ID s are including STJs (LDROID= L + 2w ), and ab sorber w idths of 20, 30, or 50 ¿ m . T he STJs are square in geom etry w ith the sides equal to the w idth o f the absorber. T he chip is illum inated w ith optical photons from the back side through the sapphire substrate. T he charge output from each STJ is recorded via a pulse height analyzer consisting of a charge sensitive pream plifier follow ed by a pulse shaping stage, a peak detector, and an analog to digital converter. W hen signals are detected in the two pulse height analyzers FIG. 2. Schematic representation of the setup. w ithin a tim e w indow o f 30 ¿ s , the signal is recorded as a single event w ith the tw o p ulse height am plitudes and the tim e difference betw een the tw o pulses. For responsivity m easurem ents, this m ethod is not ideal because the pulse profile changes w ith absorption position and the electronics have a fixed integrating tim e. To first order the effect will show up as an increased loss in the absorber, affecting the value for a . B ut this should have no significant effect on the resulting spatial and spectral resolution. T he experim ents w ere carried out using a pum ped 4H e cryostat w ith a 3H e sorption cooler having a base tem pera ture of 295 m K and a hold tim e of 6.5 h. A t this tem perature, there is still som e therm al current present, acting as an extra noise contribution. On average the subgap current reached a level o f 400 pA w hich is induced by both the therm al current and IR background. T he cryostat is fitted w ith an optical w indow to allow external illum ination w ith a set o f three cold filters placed behind the w indow to reduce the IR rad ia tion load on the detector. T he IR filtering is not 100% effi cient and there is still som e IR radiation w hich reaches the detector, degrading the resolutions. H ow ever, it justifies the assum ption AQ L= A Q R= AQ, allow ing for a sim plification to be m ade in the interpretation o f the data. T he available w av e length band is 3 5 0 -7 5 0 nm, lim ited by the IR filters. T he optical arrangem ent is show n in Fig. 2 .23 T he objec tive was to achieve a spot size o f 10 ¿ m . Previous values for spatial resolution o f a D R O ID w ith 30 nm A l trapping layers estim ated from the spectral resolution suggested a spatial res24 olution o f ~ 4 0 ¿ m . T he spot size o f 10 ¿ m should only have a sm all effect on the m easured spatial resolution (3% w ith a spatial resolution o f 40 ¿ m ). To produce this spot size on the detector, the high quality optical relay system of the SC A M 3 instrum ent has been used to im age a pinhole on the absorber. A high quality lens was attached to the cryostat to focus the beam on the detector. T he rest of the optics consists o f tw o 45° flat m irrors to fold the beam and an off-axis parabola w ith a 50 ¿ m pinhole in its focus. T he pinhole was illum inated using a diffuser w hich was connected via an op tical fiber to a double grating m onochrom ator and a X e lamp (X = 2 0 0 -1 0 0 0 nm ), or, alternatively, to a H eN e laser (X = 633 nm) for a higher intensity. T he pinhole was m ounted on a set o f translation stages in order to b e able to m ove the spot over the detector chip. T he throughput o f the com plete system was very low necessitating long integrating tim es due Downloaded 24 Jun 2011 to 131.174.17.26. Redistribution subject to AIP license or copyright; see http://jap.aip.org/about/rights_and_permissions 083914-5 Hijmering et al. J. Appl. Phys. 103, 083914 (2008) FIG. 3. Schematic representation of the top view of a DROID to indicate the scan directions. to the low count rate. W ith the reduction factor o f the optical chain o f 5.4, this setup should produce a 9.3 ¿ m spot on the detector. The actual size o f the light spot has been deter m ined from an intensity profile o f a scan over the w idth of the absorber, in the y direction in Fig. 3 . T he resulting intensity profile describes the integration o f the im age profile w ith position in one direction. A m odel o f the optical train has show n that the resulting spot profile has a sharp peak w ith very broad but low intensity wings. This profile has been approxim ated by a cocentric double 2D G aussian profile o f w hich the first describes the sharp peak and the second describes the broad w ings. T he resulting m odeled spot profile is integrated in the x direction from - œ to œ (along the length o f the absorber). T he integration in the y direction betw een the lim its y ' - w / 2 to y ' + w / 2 mim ics the m ovem ent of the spot across the absorber width. 1 I ( y ') = ry '+w/2 y - w/2 1 -y /2b d y . e -y2/2a + p - ^ e-y2/2b Vb Here, a is the diam eter o f the first G aussian representing the narrow spot and b the diam eter o f the second G aussian re p resenting the low intensity broad w ings. The intensity o f the second G aussian is given by p in percentages o f the intensity o f the first G aussian. The factor results from the in te gration in the x direction. The m easured intensity profile has been norm alized to the intensity at the center o f the absorber and the m odel has been fitted to the data, w ith the result show n in Fig. 4 . T he fitted spot profile resulted in a diam eter o f a = 10 ± 1 ¿ m full w idth at h alf m axim um (FW HM ) for the first, sharp G aussian and b = 300 ± 50 ¿ m F W H M for the second G aussian w hich has an intensity o f p = 0 .0 2 ± 0.001. In practice the 10 ¿ m FW H M is show n to be negligible FIG. 5. Scatter plot of three measurements of a single device. The pulse height distributions of the two STJs are plotted on the axis together with the fitted Gaussian profiles. The average charge outputs for the entire scan are shown by stars with the model to obtain the values for a and ß as a solid line. com pared to the spatial resolution of the m easurem ents. T he 300 ¿ m w ide G aussian w ill show up as a low intensity back ground illum ination. This spot profile has been used to illu m inate the absorber locally on approxim ately ten positions w ith different x -coordinates (see Fig. 3) along the absorber, referred to as a “scan” . T he position o f the spot is known from the translation stage settings and verified by detecting the ends o f the absorber through a drop in intensity. IV. RESULTS T he objectives o f the experim ents are to test the theoret ical predictions and to find the optim al configuration o f the external and internal param eters. T he first o f the experim ents w as carried out on a D R O ID o f length o f 400 ¿ m (including STJs) and w idth of 30 ¿ m w ith 30 X 30 ¿ m 2 STJs. Earlier results have show n this geom etry to b e a good trade off betw een sensitive area and signal to noise ratio at optical w avelengths.24 T he m easurem ents w ere carried out by using 410 nm (3.03 eV) photons, determ ined by optim al through p ut o f the optical system , w ith a bias voltage o f 120 ¿ V and at a tem perature o f 295 mK. 100 2.0 j 1.5 - 80 a K ••• /1 4 1.0 : 60 40 s K tn ■<A- - b> - 20 0 0.0 -3 0 0 -2 0 0 -1 0 0 0 100 200 300 P o s itio n [¿¿m] FIG. 4. Measured intensity profile resulting from a scan of the pinhole image over the 30 ¿m width of the absorber. The solid line is the result of a least-squares fit of the modeled intensity profile to the measured data. FIG. 6. The measured spectral resolution (triangles) and the measured spa tial resolution (squares). The modeled predictions are shown as solid lines. Downloaded 24 Jun 2011 to 131.174.17.26. Redistribution subject to AIP license or copyright; see http://jap.aip.org/about/rights_and_permissions 083914-6 Hijmering et al. J. Appl. Phys. 103, 083914 (2008) TABLE I. Fitting parameters for different photon energy. 3.0 1.5 -3 0 0 -20 0 -10 0 0 100 2 00 2.1 ± 0.1 ß c (ADU/eV) 1.3 ± 0.04 1.4 ± 0.04 .20. +1 'O ^ 0. 0. + +1 2..0 2. 3.03 2.48 1.97 a 0. 0. \o0. + + +1 2.0. E0 (eV) w ould b e ~ 1 i m and is indeed negligible. T he solid lines in Fig. 6 w ere plotted from Eq. (4) and (5) for best fit values of param eters a and ß . For AQ in Eqs. (4) and (5), w e used an average F W H M o f the pulse height distribution o f the in d i vidual channels over all positions. T he variations in the sepa rate m easurem ents are due to the sm all variations in AQ in the different m easurem ents. This variation is strongest near the STJs due to the low count rate caused by vignetting. To test the relation betw een the spatial and spectral reso lutions, the param eter £{x) has been evaluated. T he experi m ental values for £{x) w ere determ ined from the m easured spatial and spectral resolutions. T he expected values for £{x) from the m odel w ere calculated by using Eq. (6) and plotted in Fig. 7 . T he m odeled values for £{x) agree w ell w ith the m easurem ents, show ing that the relation betw een the spatial and spectral resolutions, as given by by Eq. (6), is valid in the case o f im perfect trapping. F or com parison, £(x) for the case o f perfect trapping has also been plotted in Fig. 7 (dashed line) to show the potential im provem ent in spatial resolution for the sam e spectral resolution. T he 30 X 400 ¡xm2 D R O ID has been scanned w ith d if ferent photon w avelengths; 410, 500, and 633 nm (3.03, 2.48, and 1.97 eV, respectively) w hich are chosen for opti m um throughput o f the optical chain. T he operating tem pera ture was 295 m K and the STJs w ere biased at 120 fiV . The resulting values o f a , ß , and the proportionality constant c are show n in Table I . T he factor c from Eq. (1) is the p ro portionality constant betw een the incident photon energy and the charge output indicating the linearity o f the device. T he m easured resolving pow ers (E0/ A E and L / Ax) for the different photon energies are show n in Fig. 8. Both re solving pow ers increase w ith photon energy due to the higher charge output com pared to the noise. T he resolving pow ers have been overplotted w ith the predictions from the m odel using the values from Table I . T he sam e D R O ID has been scanned w ith 410 nm p h o tons w hile biased at different voltages (70, 120, and 160 ¡jlV ) at the operating tem perature o f 295 mK. Table II shows the 3 00 P o s itio n [/-im] FIG. 7. Relation between the spatial and the spectral resolution with the prediction of the model as a solid line. The dashed line represents the case with perfect trapping (,6=0). F igure 5 show s an exam ple o f a scatter plot com posed of three m easurem ent points from a single scan. T he pulse height distributions are displayed on the sides o f the scatter plot. T he intensity along the absorber, as indicated by the am plitude o f the distribution, varies due to som e vignetting in the optical system . A G aussian profile has been fitted to the pulse height distributions to obtain the charge detected at the left and right STJ. The m ean values o f the charge ob tained for each m easurem ent position in the w hole scan are plotted in the Fig. 5 as stars. T he values o f a and ß are determ ined by obtaining the best fit of Eq. (1) to these charge outputs, also show n in Fig. 5 as a solid line through the m easurem ent points. B y using the obtained values for a = 2.0 ± 0.1, ß = 1.5 ± 0.1, and Eqs. (2) and (3), w e calculated the energy and position distributions from the m easured data. T he values for the m ean and F W H M are determ ined by the G aussian fit to the spatial and spectral distributions, and the resulting resolutions are show n in Fig. 6, together w ith the m odel results. T he spectral and spatial resolutions are best in the center of the absorber (0.77 ± 0.02 eV and 45 ± 2 i m ) , degrading tow ard the STJs (1.1 ± 0.04 eV and 65 ± 4 i m ) . T he spectral resolution is relatively poor and lim ited by electronic noise and the residual IR load on the detector, w hich causes an effect sim ilar to the electronic noise. U nlike the signal am plitude, the contributions o f these noise sources are indepen dent o f absorption position, resulting in a strongly position dependent spectral and spatial resolutions. W ith a spatial re s olution o f 45 fvm, the contribution o f the spot size o f 10 fim 10 + 4 lOnm _ )K500nm 0 632nm _ ^ X 8 - 6 - -p î i + 410nm )K500n.m O 632nm 3? FIG. 8. (a) Spectral resolving power and (b) spatial resolving power vs absorption position for different photon energies. The solid curves show the predictions of the model. o -J - ^ ^ 4 - r \ 2 0 - 3 0 0 - 2 0 0 -1 0 0 0 100 (a) P o s itio n [¿¿m] 200 300 -3 0 0 -2 0 0 -1 0 0 0 100 (b) P o s itio n [¿¿m] 200 3 00 Downloaded 24 Jun 2011 to 131.174.17.26. Redistribution subject to AIP license or copyright; see http://jap.aip.org/about/rights_and_permissions 083914-7 Hijmering et al. J. Appl. Phys. 103, 083914 (2008) TABLE II. Fitting parameters for different bias voltages. V (^V) 70 120 160 a ß 1.9 ± 0.05 2.0 ± 0.1 2.0 ± 0.05 0.2 ± 0.05 1.5± 0.1 2.5 ± 0.1 best fit values for a and ß from the different scans. The T a / A l STJs have a low er energy gap than the pure tantalum absorber, thus producing a m ild trapping effect confining qps in the STJs. D uring the tunnel process, the qps w ill gain energy by e V b per tunnel, w hich is counteracted by relax ation w ith em ission of a phonon. W ith increasing bias v o lt age, the probability to reach an energy level above the bulk Ta gap, w here the qps can diffuse into the absorber, in creases, reducing the trapping effect. This is reflected by the change in the value o f ß . W ith decreasing trapping, the p ro b ability for cross-talk increases, degrading the spatial reso lution. F igure 9 shows that the effect is m ost noticeable w ith a bias voltage o f 70 i V . A t this bias voltage, a qp needs four tunnels instead o f three to reach an energy level above 700 x e V . T he spectral resolution is less affected because al though the qps escape the STJ they still contribute to the signal in the opposite STJ. F igure 10 show s the relation £{x) for the different bias voltages, and thus different trapping efficiencies, together w ith the m odeled predictions. It is seen that the relation £{x) indeed increases w ith im proved trapping going tow ard the perfect trapping situation show n in Fig. 7 . T he spatial and spectral resolutions have been m easured for three devices (on the sam e chip) w ith different D RO ID lengths, 200, 300, and 400 fim (30 X 30 fim 2 STJs included) and a w idth of 30 i m . T he devices have been biased at 120 i V and illum inated w ith 410 nm photons at an operat ing tem perature of 295 mK. T he resulting values for a and ß are show n in Table III together w ith the values for the cor responding characteristic diffusion length (D rloss,abs) 1/2. T he resulting diffusion lengths for the 200 and 400 i m D R O ID s are in good agreem ent, w hile the 300 i m device shows a slightly larger diffusion length. Com paring the m ea sured resolving pow ers w ith the m odel results, as displayed in Fig. 11, show s that the m odel does not exactly describe the experim ent w ith the 300 i m D R O ID . T he 200 i m device shows a high value for ß . This device show s differences in the responses o f both STJs w hich m akes fitting the results P o sitio n [fan] FIG. 10. The ratio between the spatial and spectral resolving powers with position for the different bias voltages with the theoretical prediction of f(x) plotted as solid lines. using a single value for ß inadequate. Tests conducted at x-ray energies, w here w e com pared data sets obtained by using the integrating electronics and data sets obtained by using p ulse sam pling electronics, have show n that the value o f ß starts to drastically deviate above a value o f 2.5 when using the integrating electronics. T he true value for ß for this m easurem ent is expected to lie betw een 2.5 and 3.0 instead o f at 6.6. This high value m ay b e due to the sm allest aspect ratio o f this device (see also discussion below). T he spectral and spatial resolving pow ers for the differ ent absorber lengths are show n in Fig. 11. T he spectral re solving pow er degrades w ith increasing length w hile the spa tial resolving pow er im proves. This is clearly indicated by the change in the £(x) for the different devices, as show n in Fig. 12. T he larger losses in longer devices, due to the longer distance to reach the opposite STJ, have the effect o f red u c ing the cross-talk betw een the STJs. This increases the ratio o f the two signals, resulting in im proved spatial resolving pow er. A lthough the spatial resolving pow er is increasing w ith length, the spatial resolution (Ax) rem ains constant. The average spatial resolution is 45 ± 3 i m at the center of the absorbers for all three lengths. T he spectral resolving pow er decreases w ith length. This is due to the reduced tunnel p ro b ability, and hence low er charge output o f the longer devices, for w hich the STJs are a sm aller fraction o f entire D R O ID area. In addition, the electronic noise contribution w ill re m ain the sam e and the IR noise contribution w ill increase for larger devices. T he chip also contains D R O ID s o f different absorber FIG. 9. (a) Spectral resolving power and (b) spatial resolving power vs position at different bias voltages. The solid curves show the predictions of the model. Downloaded 24 Jun 2011 to 131.174.17.26. Redistribution subject to AIP license or copyright; see http://jap.aip.org/about/rights_and_permissions 083914-8 Hijmering et al. J. Appl. Phys. 103, 083914 (2008) TABLE III. Fitting parameters for different absorber lengths. l droid (i m) 200 300 400 a ß (0Tloss,abs)1/2 (i m) 0.8 ± 0.05 1.1 ± 0.05 2.0 ± 0.1 6.6 ± 2 1.5 ± 0.1 1.5 ± 0.1 175 ± 11 218 ± 10 170 ± 9 w idths and hence different STJ sizes. T he spectral and spatial resolutions have been m easured for three devices w ith ab sorber w idths of 20, 30, and 50 i m and a total device length L DROid = 4 0 0 i m . N ote that effectively the absorber length L slightly decreases for w ider D R O ID s w ith the sam e length. T he D R O ID s are biased at 120 i V , illum inated w ith 410 nm photons at a tem perature o f 295 m K . T he resulting values for a , ß , and the diffusion length are listed in Table IV . T he values for a result in an average diffusion length of 185 ± 25 i m , confirm ing the previously obtained value and the uniform ity o f the chip. The value o f a for the 50 i m device is low er than expected, resulting in a value for the diffusion length outside the error m argins o f the other d e vices. T he values for ß strongly decrease w ith absorber width. F or the larger STJ sizes, the qps spend m ore tim e in the STJ leading, to a higher probability o f inelastic scattering and trapping. On the other hand, the tunnel probability is increased for larger STJs, w hich enhances the raising o f qp energy and allow s easier escape. Clearly, the processes inside the STJs need to b e included into the m odel to exactly u n derstand how STJ size influences the trapping probability. F igure 13 shows the spectral and spatial resolving p o w ers as a function o f absorption position for the three different device w idths. T he 50 i m w ide device clearly shows a d is crepancy betw een the data points and the m odel. This could be caused by the sm aller aspect ratio, m aking the diffusion process m ore tw o-dim ensional. T he resulting spectral resolving pow er show s no obvious difference betw een the 20 and 30 i m w ide devices in Fig. 13. T he 50 i m device show s im proved resolution w hich is due to the increased charge output com pared to the electronic and IR noise. A lthough the signal to noise ratio increases, there is no noticeable im provem ent in the spatial resolution. T he im provem ent in signal to noise w ith w ider devices m ay be counteracted by the reduced losses due to the slightly shorter absorber length caused by the larger STJ size. A lter natively, if quasiparticle losses at the absorber edges are present in the system , these w ould be less relevant in w ider devices and lead to reduced spatial resolution. For a better FIG. 12. Relation between the spatial and spectral resolutions for the de vices with different absorber lengths. The solid curves show the predictions of the model. understanding of the influence o f the absorber w idth and the presence of edge losses, a m ore detailed investigation is needed. V. DISCUSSION T he experim ental results in the previous section clearly show the influence o f different param eters on the spatial and spectral resolutions and provide a rigorous test of the sim ple m odel. C om parison betw een the experim ent and sim ulation show s good agreem ent for both the spectral and spatial reso lutions as function o f absorption position in Fig. 6, and also for the factor £(x) in Fig. 7 . T he latter is an im portant result, validating the use o f the m odel to determ ine the spatial res olution from the m easured spectral resolution from a uniform illum ination. T he linearity o f the energy response o f the D R O ID struc ture has been tested by using three different photon energies. T he factor c in Table I show s the D R O ID response to be fairly linear w ith photon energy. T he m odel proved to be consistent in describing the D R O ID response to variations in photon energy, as show n in Fig. 8. B y varying other experi m ental param eters, such as bias voltage, absorber length, and w idth, w e w ere able to probe their effect on the detector perform ance and test the lim itations o f the model. T he geom etry proves to b e of great im portance for opti m ization o f the D R O ID perform ance. T he absorber length is the only param eter w ith w hich the relation betw een the spa tial and spectral resolutions, as show n by £(x) in Fig. 12, 10 + 400yU.m 8 t -p i + 400/¿m. 300/¿m • O 200jU.m ■ O 2 0 0 /im ■ ' “ Y - ^ X < 6 4 \ EE/ hJ - ; Ï / V * ' i ï* 3 ? V s -r ■ \ \ m x " : : FIG. 11. (a) Spectral resolving power and (b) spatial resolving power vs position for different absorber lengths. The predictions of the model are shown by the solid curves. 2 —3 0 0 —2 0 0 —100 0 100 (a) P o s itio n [¿¿m] 200 300 0 -3 0 0 - 2 0 0 - 1 0 0 0 100 P o s itio n [/¿m ] (b) 200 300 Downloaded 24 Jun 2011 to 131.174.17.26. Redistribution subject to AIP license or copyright; see http://jap.aip.org/about/rights_and_permissions 083914-9 Hijmering et al. J. Appl. Phys. 103, 083914 (2008) TABLE IV. Fitting parameters for different absorber widths. d (|xm) 20 30 50 a ß (D^"loss,abs)1 2 (i m) 2.1 ± 0.05 2.0 ± 0.1 1.4 ± 0.05 3.0 ± 0.5 1.5 ± 0.1 0.6 ± 0.05 171 ± 4 170 ± 9 214 ± 8 clearly changes. This shows that the length of the absorber is lim ited by the requirem ents on the spatial and energy reso lutions. T he different geom etries also provide the clearest evidence on the lim itation to the one dim ensionality o f the m odel, w hich is evident in Figs. 11- 13 for D R O ID s w ith the sm allest aspect ratios. T he 1D m odel cannot account for the dim ensionality effects in the results, and for D R O ID s w ith an aspect ratio below 10:1, a 2D m odel appears to be required. A lthough these lim itations are obvious, nonetheless it is w orth m entioning that the basic m odel is quite robust. The m odel gives good agreem ent w ith the experim ents; however, in som e cases the fitting param eters a and ß w ill need to go beyond the expected values, as seen w ith the different geo m etries. T he inability o f the m odel to deal w ith an asym m etric system is obvious but can easily be dealt w ith by introducing two separate ß -param eters. Confining the charge carriers inside the sensors is an im portant m echanism to optim ize the spatial and spectral resolutions. W ith the current D R O ID configuration, with m ild trapping in the STJ, the trapping o f qps can b e fine tuned w ith the bias voltage, as show n by Fig. 9 . In the m odel, this process is accounted for by the param eter ß w hich describes the boundary condition ju st at the infinitesi m ally thin edge. H ow ever, the STJs are extended sensors w ith their own dynam ical properties. T he internal processes involving the qps inside the STJ can only be approxim ately accounted for by a single param eter ß , as show n in Tables II and IV . Thus, further developm ent of a D R O ID m odel re quires m odeling o f the qp dynam ics inside the biased STJ including qp injection, tunneling, and exchange betw een ab sorber and STJ. In addition, STJs, and all other sensors, need to be treated as extended objects w ith appropriate conditions at all their boundaries. T he observed dependences on bias voltage and on STJ size are exam ples since they do not only depend on the im perfect trapping but also on the com bina tion o f other param eters of the STJ. F or physical reasons, this dependence can be understood but cannot be predicted by using the current sim ple m odel. N onetheless, the sim ple m odel is invaluable in setting up a basic fram ew ork for D R O ID optim ization. T he final lim itation o f the m odel is the assum ption A Q r = A Q l , independent of position. In our experim ents this lim itation has been obscured by the presence o f IR back ground and electronic noise. Their contributions dom inate the m easured resolutions and they are independent o f signal am plitude, ensuring that the assum ption above is validated (as long as the STJs are identical). H ow ever, they induce a strong position dependency of the spectral and spatial reso lutions (cf. Fig. 6), w hich is an unw anted property for a practical detector. T he full scale problem o f obtaining the b est resolutions w ill becom e evident if the contribution of these external noise sources is reduced in an optim ized ex perim ental configuration, and the intrinsic noise sources (w hich scale w ith signal am plitude) becom e dom inant. This, is expected to reduce the position dependency o f the resolu tions. Then, any further developm ent on an im proved m odel m ust rest on breaking dow n all contributing noise factors. F or D R O ID s w ith STJs as sensors such a breakdow n w ill be in a sim ilar form as w ith single STJs, as show n in the Intro duction. A ll noise factors w hich are im portant for single STJs w ill o f course play an im portant role w hen it becom es part of a D R O ID . H ow ever, additional noise sources will appear, som e o f w hich w ill be dependent on absorption p o sition. VI. CONCLUSION In summ ary, w e have developed an experim ental tech nique to m easure the spectral and spatial resolutions in dis tributed readout im aging devices directly for each photon absorption position. B y using this technique, w e have ex p lored the influence o f several param eters on the spatial and spectral resolutions. B y using the m odel o f Jochem et al., we have derived the expressions for photon energy, photon ab sorption position, and the resolutions w hich give a satisfac tory description o f the experim ental data. T he lim itations of the m odel w here tested experim entally and m ajor restrictions w ere identified, pointing out the necessity for further devel opm ent of the theoretical m odel along the described d irec tions. 10 ' ? x<f> 1 ‘ Xf < w + 30/¿m 20/¿m -g- gTx-r ^ 8’ . I * ‘ i 61-4 X S- T tIp + 30¿¿m ■ ^ 20¿¿m O50¿im ; 4 " 5 FIG. 13. (a) Spectral resolving power and (b) spatial resolving power vs position for different absorber widths. The solid curves show the predictions of the model. 2 ....... ..... ......... .1........ ............ ,,,,,,,, -3 00-200-100 0 100 200 300 (a) Position [/¿m] 0 -300 -200 -100 0 100 200 300 (b) Position [¿¿m] Downloaded 24 Jun 2011 to 131.174.17.26. Redistribution subject to AIP license or copyright; see http://jap.aip.org/about/rights_and_permissions 083914-10 Hijmering et al. 1K. D. Irwin, Appl. Phys. Lett. 66, 1998 (1995). 2P. Day, H. Leduc, B. Mazin, A. Vayonakis, and J. Zmuidzinas, Nature (London) 425, 817 (2003). 3D. D. E. Martin, P. Verhoeve, A. Peacock, A. G. Kozorezov, J. K. Wigmore, H. Rogalla, and R. Venn, Appl. Phys. Lett. 88, 123510 (2006). 4S. Bandler, R. Brekosky, A. Brown, J. Chervenak, E. Figueroa-Feliciano, F. Finkbeiner, N. Iyomoto, R. Kelly, C. Kilbourne, F. Porter, J. Sadleir, and S. Smith, Low Temp. Phys., 151, 400 (2008). 5D. D. E. Martin, P. Verhoeve, T. Oosterbroek, R. A. Hijmering, T. Pea cock, and R. Schulz, Proc. SPIE 2006, 6269. 6C. A. Mears, S. E. Labov, M. Frank, H. Netel, L. J. Hiller, M. A. Linde man, D. Chow, and A. T. Barfknecht, IEEE Trans. Appl. Supercond. 7, 3415 (1997). 7N. E. Booth, Appl. Phys. Lett. 50, 293 (1987). 8A. G. Kozorezov, R. A. Hijmering, G. Brammertz, J. K. Wigmore, A. Peacock, D. Martin, P. Verhoeve, A. A. Golubov, and H. Rogalla, Phys. Rev. B 77, 014501 (2008). 9M. Kurakado, Nucl. Instrum. Methods Phys. Res. 196, 275 (1982). 10K. E. Gray, Appl. Phys. Lett. 32, 39 (1978). 11K. Segal, Ph.D. thesis, Yale University, 2000. 12P. Verhoeve, N. Rando, J. Verveer, A. Peacock, A. van Dordrecht, P. Videler, M. Bavdaz, D. J. Goldie, T. Lederer, F. Scholze, G. Ulm, and R. J. Appl. Phys. 103, 083914 (2008) Venn, Phys. Rev. B 53, 809 (1996). 13H. Kraus, F. V. Feilitzsch, J. Jochum, R. L. Mössbauer, Th. Peterreins, and F. Pröbst, Phys. Lett. B 231, 2 (1989). 14J. Jochum, H. Kraus, M. Gutsche, B. Kemmather, F. V. Feillitzsch, and R. L. Mössbauer, Ann. Phys. 2(7), 611-634 (1993). 15V. Savu, L. Li, A. Mukherjee, C. M. Wilson, L. Frunzio, D. E. Prober, and R. J. Schoelkopf, Nucl. Instrum. Methods Phys. Res. B 520, 237 (2004). 16R. den Hartog, D. Martin, A. Kozorezov, P. Verhoeve, N. Rando, A. Pea cock, G. Brammetrz, M. Krumrey, D. J. Goldie, and R. Venn, Proc. SPIE 2000, 4012. 17A. Rothwarf and B. N. Taylor, Phys. Rev. Lett. 19, 27 (1967). 18M. Ejrnaes, C. Nappi, and R. Cristiano, IEEE Photonics Technol. Lett. 18, 953 (2005). 19V. Adrianov, L. Filippenko, V. P. Gorkov, and V. Koshelets, Low Temp. Phys. 151, 287 (2008). 20V. Samedov, Low Temp. Phys. 151, 333 (2008). 21M. Furlan, E. Kirk, and A. Zehnder, J. Appl. Phys. 101, 054501 (2007). 22G. Brammertz, Ph.D. thesis, University of Twente, 2003. 23R. A. Hijmering, P. Verhoeve, D. D. E. Martin, I. Jerjen, A. G. Kozorezov, and R. Venn, Low Temp. Phys. 151, 298 (2008). 24R. A. Hijmering, P. Verhoeve, D. D. E. Martin, A. Peacock, A. G. Kozorezov, and R. Venn, Nucl. Instrum. Methods Phys. Res. A 559 692 (2006). Downloaded 24 Jun 2011 to 131.174.17.26. Redistribution subject to AIP license or copyright; see http://jap.aip.org/about/rights_and_permissions


© Copyright 2026