
INFRARED (2.5-25.0 µm) REFLECTANCE OF SOLID STATE
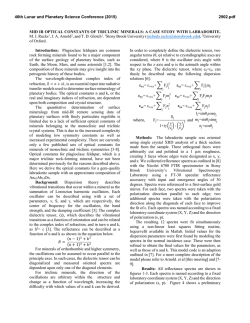
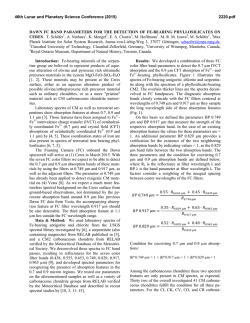
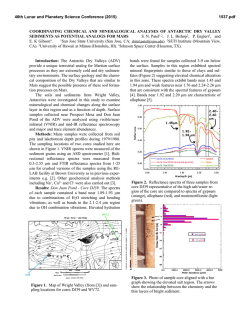
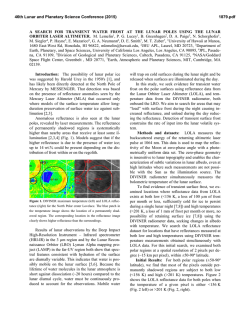
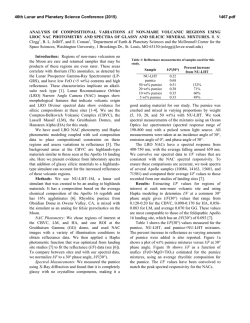
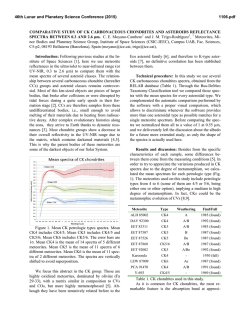
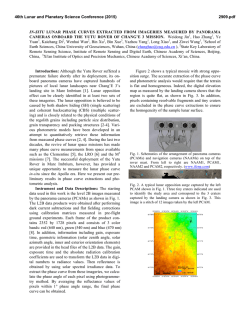
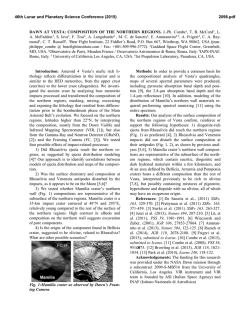
46th Lunar and Planetary Science Conference (2015)
2588.pdf
INFRARED (2.5-25.0 µm) REFLECTANCE OF SOLID STATE POLYCYCLIC AROMATIC
HYDROCARBONS (PAHs). D. M. Applin1*, M. R. M. Izawa1,2, and E. A. Cloutis1
1
Hyperspectral Optical Sensing for Extraterrestrial Reconnaissance Laboratory, Department of Geography, University of Winnipeg, 515 Portage Ave., Winnipeg, Manitoba, Canada, R3B 2E9. 2Dept. of Natural History, Royal Ontario
Museum. 100 Queen's Park, Toronto, ON, Canada*[email protected]
Introduction: PAHs are highly abundant throughout the universe. PAHs likely form surface deposits on
some bodies in the solar system , such as Iapetus [1].
Both atmospheric and surface spectral features on Titan may also be explained by PAHs [2,3]. Fundamental
absorption bands of PAHs in the gas phase have been
well characterized. PAHs generally have fundamental
absorption bands at ~3.3 µm, ~6.3 µm, ~7.8 µm (vCC ,
~8.6, and ~11.2 µm . Although these are the strongest
features, there are many uncharacterized features that
could play a role in the remote sensing of PAHs in the
solar system. Reflectance spectra of materials in the
solid state can appear considerably different than
transmission measurements in the gas phase. Since
these materials are expected to exist as solids in surface
deposits, the investigation of their spectral properties is
timely. Diffuse reflectance spectroscopy in the Vis-nIR
(0.4-2.5 µm) has recently been used to characterize a
diverse suite of solid state PAHs [4]. Here, we extend
that survey into the infrared.
Methods: A diverse suite of PAHs were drysieved to their <45 µm fractions, and loaded into aluminum sample cups with a 1 cm diameter and 1 cm
depth. Diffuse reflectance spectra from 2.0-25.0 µm
were collected with a Bruker (Billerica, MA) Vertex 70
Fourier Transform Infrared (FTIR) spectrometer over
the wavelength range of 2.0-25.0 µm at 293K. Reflectance spectra were acquired relative to a Labsphere
Infragold® 100% reflectance standard measured at
i=30° and e=0° using a SpecAc Monolayer grazing
angle specular reflectance accessory. A total of 1500
spectra, collected at a scanner velocity of 40 kHz, were
averaged to improve SNR. All measurements were
made using an identical viewing geometry, integration
time, and number of averaged spectra.
3.27 µm band: All PAHs show this characteristic
absorption band (Fig. 1). The center varies from ~3.403.80 µm in the compounds studied. The width of this
feature is also considerably larger than that in the gas
phase, even more so than expected in some cases. The
depth of this feature is also variable.
3.4 µm band: Despite not containing aliphatic
components, some PAHs show absorption features near
3.4 µm. These features are present in a many of the
PAHs, and are strong in some, and may be due to trace
amounts of aliphatics in our samples, which are of variable purity (most >98% pure).
5.05 µm band: The only compound to show features consistent with Titan at 5.05 and 5.1 µm is 2acetylfluorene (Fig. 3), and these features are tentatively ascribed to overtones of the CC stretch and CH3
rocking modes near 10 µm. The reflectance of this
compound is also consistent with Titan in the ~2.8 µm
region.
Discussion and conclusions: Although we have
yet to complete full systematic analysis of the spectra,
some results are clear. The centers of some features
(3.27 µm) don’t appear to be affected strongly by variations in side groups, number of cyclic rings, and other
coordination variations, but could be used for identification in high spectral resolution datasets. Overall, the
spectra of solid state PAHs can vary significantly. The
width of the 3.27 µm absorption is considerably wider
than that in the gas phase, or even assumed width in
some spectral models. The depth of this feature is correlated with PAH size, as there are fewer CH bonds per
volume in larger molecules. Many PAHs show a strong
3.4 µm absorption which can be confused for aliphatic
components. This has implications for modelling organic content where a mixture of aromatic and aliphatic
components are expected, such as the surface of Iapetus.
Finally, out of 50 PAH compounds studied, 2acetylfluorene is the only one that significantly matches
the surface reflectance spectra of Titan. This may be
consistent with the photochemistry in the atmosphere
of Titan, where acetyl and benzene radicals are expected to play roles [5]. This indicates that small PAHs
with acetyl side groups may be a component of Titan’s
surface deposits.
Acknowledgements: This study is supported by
the Canadian Space Agency (CSA) through various
programs, NSERC, and the U. of Winnipeg.
HOSERLab was established with funding from CSA,
the Canada Foundation for Innovation, the Manitoba
Research Innovations Fund, and the University of
Winnipeg.
References: [1] Cruikshank, D.P., et al. (2014)
Icarus, 233, 306-315. [2] López-Puertas, M. et al.
(2013) The Astrophy. Jour., 770, 132. [3] Clark, R.N.,
et al. (2013) AAS 45, abstract #309. [4] Izawa,
M.R.M., et al. (2014) Icarus 237, 159-181.
[5] Krasnopolsky, V.A. (2009) icarus,201, 226-256..
46th Lunar and Planetary Science Conference (2015)
2588.pdf
Figure 1. Reflectance spectra of some PAH compounds. Lines indicated position of characteristic PAH
absorption features in the gas phase.
Figure 3. Reflectance spectra of some PAHs. The
black line indicats the center of the absorption band
identified on Titan.
Figure 2. Reflectance spectra of some PAHs showing
the 3.27 µm absorption band.
© Copyright 2026