
Standoff Time-Resolved Fast Fluorescence of Organics and Amino
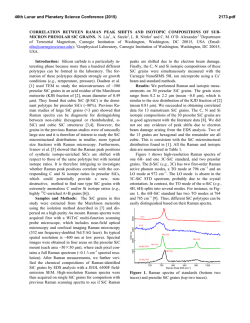
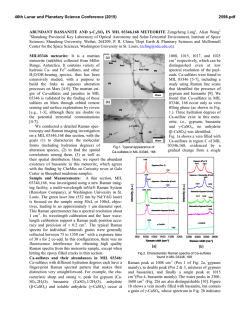
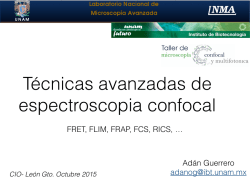
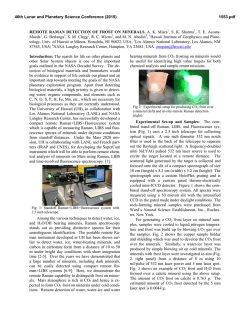
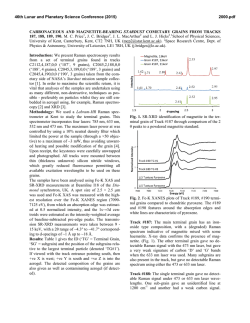
46th Lunar and Planetary Science Conference (2015)
2613.pdf
Standoff Time-Resolved Fast Fluorescence of Organics and Amino Acids. G. Berlanga, T. E. Acosta-Maeda, A.
K. Misra, S. K. Sharma, L. P. Flynn, Hawaii Institute of Geophysics and Planetology, Univ. of Hawaii at Mānoa,
Honolulu, HI 96822, USA. [email protected]
Introduction: Detection and characterization of
organics, proteins, and amino acids play a significant
role for NASA’s search for past and present life in
astrobiological targets. Amino acids and nucleobases
are of particular interest due to their involvement in
biological processes and as basic constituents of life as
we know it. Proteinogenic and non-proteinogenic amino acids and nucleo bases have been reported in Martian meteorites, carbonaceous chondrites, and in samples returned by NASA’s Stardust spacecraft from
comet 81 P/Wild 2 [1-4]. Characterization of key proteins and amino acid signatures such as tryptophan,
tyrosine, phenylalanine, glycine, β-alanine, γ-amino-nbutyric acid, L-alanine, L-Glutamic acid, and βaminoisobutyric acid supports future rover investigations on astrobiological targets. Fluorescence excitation of individual aromatic residues of folded proteins,
such as tryptophan, tyrosine, and phenylalanine, will
aid in identifying amino acid interactions that lead to
active protein native states [5].
In the Mars 2020 mission, the SuperCam instrument will be able to remotely analyze targets using
Raman spectroscopy, Laser-Induced Breakdown Spectroscopy (LIBS), and Time-Resolved Fluorescence
Spectroscopy (TRFS), without the need for sample
manipulation or treatment. Among the three techniques, the Raman spectroscopy provides unambiguous identification of organics, inorganics and biological components [6]. Both LIBS and fluorescence spectroscopies have much higher sensitivity for detecting
very low concentration of biological component. Raman and fluorescence spectroscopies provide nondestructive detection of bio-molecules in comparison
to LIBS. Laser-induced fluorescence (LIF) spectroscopy is based on measuring the optical emission of molecules that have been excited to higher energy levels by
absorption of electromagnetic radiation from a monochromatic pulsed laser source. Fluorescence signals are
several orders of magnitude higher than Raman signals, which make the LIF technique suitable for detecting a minute amount of bio-molecules in a large search
area. Planetary minerals containing transition metal
and rare-earth ions produce fluorescence spectra when
excited with UV and visible lasers. This fluorescence
can in some cases overlap with the fluorescence spectra of biogenic and organic compounds. However, the
fluorescence decay time or lifetime of biogenic and
organic compounds is much shorter (<100 ns) as compared to the fluorescence decay time of µs to ms of the
transition metal ions and rare-earth ions in minerals
and rocks. This feature is exploited in the time resolved fluorescence spectroscopy to detect a biological
target. Here, we present data on various amino acids,
proteins, and hydrocarbons using remote time-resolved
fluorescence spectroscopy.
Instrumentation: For this study a combined remote Raman+LIBS+TRFS system utilizing a 532 nm
Nd:YAG pulsed laser and an 8 inch collection telescope was used. Remote TRFS spectra were measured
in the 350-850 nm spectral range from a distance of 9
m using 10 mJ/pulse of laser power for excitation. For
planetary exploration, a compact, portable remote Raman+LIBS+TRFS system using 2.5 inch telescope has
also been developed under the Mars Instrument Development Program [4, 7]. The prototype is capable of
measuring mineral targets up to 50 meters away using
Raman and fluorescence spectroscopies and has a
LIBS range of 10 m. The laser spot diameter is adjustable between 0.3 mm and several cm. Good quality
spectra can be obtained at shorter distances of 10 m or
less within 1 s integration times. The system includes
time gating capabilities therefore is able to distinguish
between organic and inorganic fluorescence, as well as
identify atmospheric gases between the system and
target.
Samples and Methodology: We measured all of
the proteinogenic amino acids (21 L-amino acids and
glycine kit, Fluka), sarcosine, and several polyaromatic
hydrocarbons, such as anthracene. Samples were
placed and measured through sealed glass vials. The
lower Raman cross-section of glass allowed for sample
analysis without interference from the glass sample
holder [8]. Remote fluorescence measurements were
recorded from 9 m distance with 1 s detection time
(equal to 15 laser shots excitation) using a 10 mJ/pulse
laser power output, and 7 mm laser spot size on the
target. The time-resolved fluorescence spectra were
measured with sequential 10 ns gate widths.
Results and Discussion: Time resolved fast fluorescence measurements were made on 31 amino acids,
proteins, and hydrocarbons. Exponential decay was
witnessed in all fluorescent molecules with a duration
of less than 100 ns (fast fluorescence). The rate of this
decay is sensitive to environmental variables that
quench the fluorescence. Strong fluorescence signals
with very short lifetimes were observed in most amino
46th Lunar and Planetary Science Conference (2015)
acids. In addition, sharp peaks corresponding to spontaneous Raman signals were observed concurrently.
Figures 1 and 2 show time-resolved fluorescence spectra of L-Tryptophan and L-Phenylalanine respectively,
over sequential 10 ns time intervals with a 1 s integration time. The inelastic Raman scattering caused by the
vibrational modes of molecules has a life-time of ~1013
s resulting in Raman signals that are simultaneously
observed along with the bio-fluorescence signal in
nanosecond time frames.
Figure 1: L-Tryptophan exhibits a wide fluorescence
band at ~620 nm. Aromatic amino acid fluorescence
arises from free electrons inside the aromatic rings.
Acosta-Maeda et al., [4] show complementary Raman
spectra to the fluorescence spectra presented here.
Figure 2: L-Phenylalanine exhibits a wide fluorescence
band at ~615 nm and several Raman peaks with
strongest Raman line at 635.8 nm. It is an aromatic
amino acid and exhibits Raman lines representative of
CH rings arising from ring-breathing vibrations in the
mono-substituted aromatic compounds and from aromatic C-H stretch vibrations.
Figure 3 shows the relative intensity of fast fluorescence of various proteins and amino acids under the
2613.pdf
same experimental conditions. Acenapthene Benzene
exhibited the strongest fluorescence completely masking the Raman lines. Fluorene, L-Tryptophan, Fluoranthene, and L-Serine exhibited the next highest fluorescence signals, with Fluorene showing strong Raman
lines at 582.2 nm and 635.3 nm. Urea displayed the
lowest fluorescence signal.
Conclusions: Characterization of amino acids,
proteins, and other organic material provides the necessary biomarker signatures to successfully distinguish
between fluorescent inorganics and biogenic materials
on planetary surfaces. Daytime detection of amino
acids and nucleo basis from a distance of 9 m has been
demonstrated using time-resolved fluorescence spectroscopy that is well suited for planetary exploration
applications, requires no sample preparation or collection, and provides non-destructive rapid detection. Future work on the expansion of the combined Raman
fluorescence spectral range into UV and IR will provide the necessary signatures to fully identify the amino acids and proteins.
Acknowledgements:
This work has been supported by NASA EPSCoR
grant NNX13AM98A.
References: [1] Burton A. S. et al. (2013) LPSC
XLIV, Abstract #2613. JGR, 90, 1151–1154.
[2] Callahan M. P. et al. (2011) . PNAS 108,13995–
13998.. [3] Elsila J. E. et al. (2009) Meteoritics & Planet. Sci., 44, 1323-1330. [4] Acosta-Maeda T. E. et al
(2014) LPSC XLV, Abstract #2331. [5] Berg et al.
(2002). Biochemistry. “Protein Structure and Function.”, Ch. 3, W. H. Freeman, NY. [6] Villar & Edwards (2006) Anal. Biochem. 384, 100–113 [7] Misra
et al. LPSC XLV, Abstract #1498. [8] McCreery R. L.
“Photometric Stds. For Raman Spec.”, Handbook of
Vibrational Spectroscopy, John Wiley and Sons.
© Copyright 2026