
Elirmnation of D-band in Raman spectra of double-wall
Elirmnation of D-band in Raman spectra of double-wall
carbon nanotubes by oxidation
S. Osswald ', E. Flahaut b, H. Ye ', Y.Gogotsi p*
MulerrbIs Schme
and Engbewatg D e p a H m i and A.J. Drexd Nanorechndogy hsai~ade,Drexel Uniwfsity.
3141 Chestnut Streei (383 CAT),PSl&&wkPA 19104, USA
h t r e Inrmttiv@rsi'Iairede Recherche et cPlngbieri&&S Mat6riaarx. UAgR CNRS 5085. Uniwr~itiPaul Sabath,118 Route & Narbam,
31062 Todollse, fiance
Iu this biter, we preseat m in situ Raman spactroscopy study of oxidation-inducedchanges in h e srru~tureand wmposrtion of
double-wall carbon nanotubes PWCNTs). Above 48!l @C,the i n e t y of the D band &ram to lw than 0.01% of the G hand
intensity, when meststld using the 780 nm Iaser mutation. Tlse D band was absent from the Raman spectra recorded with the
514.5 nm excitaiian. ~
~
~
analysis
t
r andi hiBtr.~tr.rnolufi.an
c
transmission dectron mimoscopy are used to explain the
abs& result&.We conelude that o a t i o n pravicb o pWcation M o d for the D W W wbicb leads to a sample t w t a h b g
tub@ having &y dean awfaw without digwded carbon.
O 2004 &vier B.V. All righrs reserved.
Double-wdl carbon nanoluh @W-
is the most
bask mmber of the multi-walled carbon nabtube
(MWCNT) family [l] which catl be prod& h significant quantities p]. T h e tubes consist of two concentric
cylindrical graphene layers and their range. of diameters
is comparable to that of singlewalled carbon nanotubes
(SWCNTj, Several methods for producing DWCNT
have been reported, such as oatdytic chemical mpom
de-tiw
(CCVD) [l-31, arc discharp 141 or heating
molecules ~ p ~ uia lS Wam T
~ [l.
Unfmtunauely, c~mmer&lIy viable methods such as
CYD 07 arc discharge l& to products which cofitain
cadyst partides and 'amorphous*carbon. The products
alsa contain same SWCNT and MWCNT along with
DWCNT. Of mume, the diameter distribution and also
the content of Merent tubes in the raw pmduct vary
between tbe different synthesis methods. There exists
no singh p d c ~ t i o nprocess whch would remove all
impurities and separate DWCNT from other types of
tubes. While catalyst particle6 can be eliminated by acid
treatments [1,6,g, the amorphous c a r h and the
unwanted SWCNT can also be removed by oxidation
in flowing or static air [l ,641. Thmnograuimetric analysis (TGA), which shows changes of mass during oxidation p r o m , has been used to determine the oxidation
pud5~8tionconditions [l 01.
However, TGA alone does not provide information
on what is m o v e d from the sample by oxidation.
Raman sp~trawopyprovides S powerhi method for
characterization of the carbon structure [f l]. S i m k
to the Raman spectra of S W W , D W W exhibit
three d u r & s t i c
bands: the tangential (vibrations
along the tube axis) stretching G mode (15001600 m-'),the D mode (-1350 cm-? and the radial
breathing mode RRM (100-400cm-') 111-141. While
the frequency of the RBM is inversely proportional to
the tube diameter, the tangential stretching mode weakly
depends on the diameter of the nanotube 1151. D band in
amorphous or disordered carbon is assigned to a double-resonance Raman effect in sp2 carbon [l61.The contribution of defects in the tube walls and other forms of
carbon, such as rings, to the D band is still not completely understood. Raman spe~trascopycan provide
real-time monitoring of changes in the sample's structure and composition.
In this Letter, we present the results of an in intu
R m a n spectroscopy study of oxidation of DWCNT
which were produced by a CCVD method. The goal of
the work was to select the oxidation conditions leadiig
to the removal of amorphous carbon by rnonitosing
the intensity of the D band in Raman spectra.
heating procedure was used for every reptition and
each time the experiments were stapped after reaching
the maximum temperature.
The TGA was performed with a SETARAM TAG24
thermobdme. In the TGA experiments, the sample
was heated in static air from 25 to 600 OC at 5 @Clmin
continuously up to $00 OC. To simulate the heating conditions of the in situ Raman study, 4min isothermaT
steps were performed at 400,420,430 and 440 "C slnd
S-&
steps
U S at~ 460 and 500 "C.The total h t ing time in the stepwise experimerlts with 5 "Clmin h a t ing rate was comparable to the continuous heating rate
of 3 "Clmin.
3. Results and discussion
The DWCNT were produced by the CCVD method
using a Mgl - ,CO# solid solution catalyst containing
molybdenum oxide with the elemental composition
M~.99C~o.m75M~o.mB
(21. The wpr~duoedCNTScontained a very low amount of amorphous carbon, present
only as deposits on some of the tubes' outer waU.
HRTEM observation of the sample showed 77%
DWCNTs, 18% SWCNTs and 5% TWCNTs. The &ameter distribution of the DWCNT ranged from 0.53 to
2.53 nm for inner tubes and from 1.2 to 3.23 nrn for outer tubes, while the diameters of the SWCNT reached
1.1-2.7 nm 14. The sample was heated in a Linkam
THMS 6QO heating stage in static air from 20 to
MO "C at S "Clmin. The sample was held for 4 min at
every measurement point. The stage was calibrated by
using the melting points of A$N03 (209 "C), Sn
(232"C),KN03 (334 'C), and Ca(OH)2 (580 "C). In
every case, the difference between the measured and
expected melting point did not exceed 2 "C.
The specm were acquired with a Raman micro spectrorneter (Renishaw 1Q00) using an Ar ion laser
(5 14.5 nm) and a diode kser (780 nm) in back-scattering
geometry. We used a 2Qx objective with a spot size of
-5 pm in diameter, which included a large number of
tubes, providing statistically reliable results. A low laser
power density was used on the sample (laser power
c2 mW) to avoid laser heating of the tubes. This low
power density was achieved by filtering andlor tiefocusing the laser beam at the sample surface. Spectra were
acquired with 50 O C steps in the range from 50 to
3% O C , followed by 25 O C steps from 350 to 400 OC
and concluded with 10 *C steps from 400 ta BOO O C .
After reaching the desired maximum temperature, the
sample was cooled dawn at 20 "Cl& until reaching
80 'C and then cooled at 10 "Ctmin to room temperature. The heatir@moling cycle was repeated I5 times
on different samples from two different DWCNT
batches to obtain statistically reliable data. The same
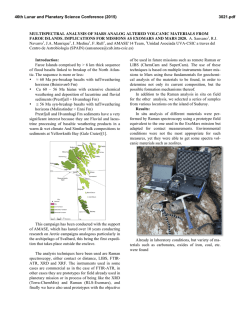
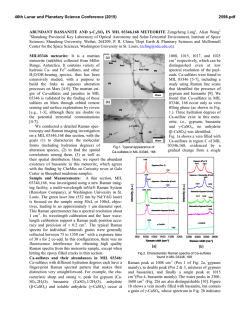
Fig. 1 shows the D and G band range of the Raman
spectra of DWCNT sample recorded during heating.
Prior to heating, the G band can be well fitted with
Lorentzian peaks at 1593 and 1568 cm-', and a broad
Gaussian peak at 1525 cm-' (Fig. 2a) for 514.5 nm;
Lorentzian peaks at 1592 and 1564 cm-', and broader
Gaussian peaks at 1548 and 15 19 cm-' for the 780 nm
laser wavelength. Note that only in the case of Fig. 2,
a baseline correction was used in the frequency range
10&700 m-' to correct the influence of the filter for
Fig 1. In situ Raman spectm%opy study of the changes in the D arid
G band of DWCNT during oxidation (514.5 nm h w &citation
wavelength).
Raman S h i i (cm")
Raman shift (cm")
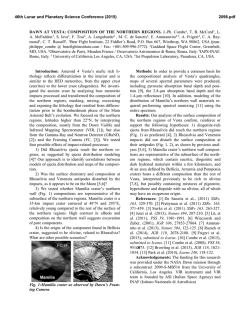
Fig. 2. Raman spectra dDWCNT using 780 and 514.5 nrn laser excitation obtained (a) before and (b) after oxidation. lntensities of the spectra have
been adjusted to improve presentation.
the Rayleigh peak to the spectra in the frequency range
from 0 to 200 cm-'. While the narrower Lorentzian
peaks are ascribed to the semiconducting nanotubes,
the broader peaks are attributed to the metallic tubes
[17,18] or overlapping of several peaks arising from
tubes with similar diameters.
In Fig. I, it can be shown that the D peak, which is usually attributed to disordered carbon, starts to decrease at
-430 "C until it completely disappears at around 510 "C.
This peak is present in the sample even if the amount of
disordered carbon is very low. D band in nanotubes
may also originate from defects in the tube walls and
was observed in some nanotube samples that did not contain amorphous carbon. For example, we observed it in
purified MWCNT samples. A linear downshift of all
peaks was observed with increasing temperature, but
the slope varies for different peaks. The value of the thermal shift was reported to be 0.03 C ~ - ' P Cfor SWCNT
[l 3,191. Our measurementsconducted on high purity natural graphite (G band at 1580 cm-')led to the value of
0.024 cm-'/"C. The present experiment for the DWCNT,
using 514.5 nm wavelength excitation, showed a downshift of 0.029 c r n - ' ~ "for
~ the 1568 cm-' peak and a value
of 0.026 c m - ' l " ~for the 1593 cm-'peak (Fig. 2b), which
are within the expected range.
Another important observation is that the intensity
changes of the D and G bands at high temperatures follow different trends. The initial decrease of the I d I G
ratio is mainly due to the increase of the G band inten-
sity. The intensity of the G band starts to increase at
.-v440 OC, soon after noticeable weight loss is recorded
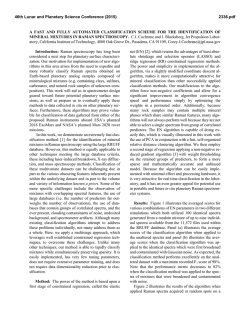
on the thermogravimetric wrve (Fig. 3), and reaches a
maximum around 500 OC and then it decreases again
(Fig. 3). As seen in Fig 3a, the decrease in D band intensity omurs at temperatures 2&30 OC higher that the
increase in G band intensity in most experiments. An
explanation for the d y intensity increase of G band
may be the possible removal of hydrocarbons (the tutK
synthesis was conducted in a hydrogen-containing
atmosphere) and disordered carbon, which were shiefdhg the Raman signd from the as-received tubes. It is
supported by a significant weight Ioss observed in this
temperature range (Fig. 3b). Some variations in the temperature difference between the G and D band changes
o b w e d in our experiments rnay be due to a different
number or packing density of nanotubes as well as different amounts of amorphous carbon present within
the and@ area. On the other hand, there might be
some temperature e f f k t s on the mbond vibrations
which may s a c t Weerentry during hearing with respect
to the curvature and the influence of temperature on
the bond softening [20].The fact that the G band's absolute intensity starts to increase at about the same temperature as the D band decreases seems to support the
former hypothesis. Further BVidence is provided by the
fact that a higher intensity (206300%) of G band was
observed after cooling to room-temperature in every
experiment. When m already oxidized sample was used
(a)
.
o f 0 bond
4
-
4
E=
v***
$2' - * C
D
4
-
-
-=
4
1 . . ' 1 . . . 1 ' . . 1 " . 1 . ' . *
0
1 o o 2 0 0 9 0 0 4 0 0 ~ 8 0 0
Fig. 3. (a) Cornpmhn of intensity changes in the D and G bands
duriag oXidation (meawed with 5 14.5 am lam wavelength) md (b)
TOA curves obtained by heating a DWCMT srunpIe in air.
for the in situ Raman study, no i n m e of G band was
observed. In this case, there was na disordered carbon
w the tube surface which could influence the Raman
signal of the tubes.
Fig. 2 shows the Raman spectra taken at room-temperature before and after heating. This graph also demonstrates that the splitting of the G band is more
pronounoed after heating and that the shift of the peaks
due to heating is not completely reversible. This may
again be due to removal of amorphous carbon and the
most defective tubes. It has been reported that the G
band at 1590 cm-' does not depend on the tube diameter [IS]. Thus, its position should not change after oxidation of smaller tubes as a result of a decrease of their
contribution to the total intensity of G band. The lower
frequency component of the G band (peaks at or below
-1570 cm-') d e p d s on the diameter of the tubes. The
oxidation of the smaller tubes leads to a change in the
lower frequency peaks while the peak at 1590cm-'
shows only littie shift (Fii. 2). RBM show no significant
changes, thus tube size distribution have not been changed. This shows that tubes were not selectively oxidized
or damaged is our proms, in spite of the fact that up to
a 90% weight loss was observed in some experiments
(Fig. 3b).
The most noticeable effectwas the near complete disappearance of the disorder induced D band after oxidation (Figs. 1-3). Using the 514.5 nm laser, the D band is
not observd at all above 510 "C. For the 780 nm bw,
which produces the largest D band intensity, the IdlG
ratio decreases from 0.43 before beating to <0.0 15 after
oxidation, The experiments also show that complete Dband removal is possible at lower t e m p e r a m ( 3 5 6
400
by using a longer isothermal exposure time or
a slower heating rate. These results show that in the case
of DWCNT, the D band ariginata ody from the amorphous carbw in the sample (even if present only in low
amwnt) and not from the defects in tube walls. W e
the concentration of defects probably increases during
the oxidation, the disordered carbon and associated D
band, disappears. In similar experiments with CVD
MWNT of about I0 nm in diameter, the phenomenon
could not be observed after heating to 600 "C, when
amorphous carbon had been removed. In the case of
MWNTs, the D band probabIy originates primarily
from defects in the tube walls. AU the amorphous Wbon is oxidized at temperatures below 600°C as well
as some nanotubes. However, the oxidation under our
conditions has never eliminated all omotubes. The composition of the sample at tbe end ofthe measurement ds
pends on the analped spot, but comparison of RBM
modes before and after oxidation (Fig. 2) shows that
only insigniscant changes in the distribution of tube
diameters could be observed. Thus, removal of amorphow carbon is possible with minimal loss of tubes
and change in diameter distributions in the sample. This
cannot be explained by insufficient air supply; control
experiments with open or closed valves show that there
was no air shortage in the in situ Raman experiments.
Also, all catalytic material was oxidized forming primarily cobalt oxide, which produd bands at 475-680 cm-'
in the Raman spectra of nanotubes after oxidation (Fig.
2b). The positions of Rarnan bands of Co304reported
in literature are 182, 460, 505, 600 and 670 cm-'c211
and their relative intensities are in agxement with our
observations (the strongest band is at -680 cm"').
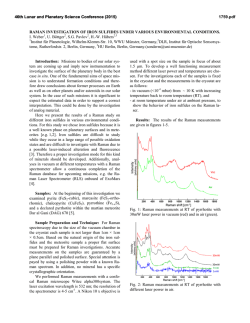
Fig. 4 shows TEM images of the DWCNT samples
before (a&), after oxidation (c,@ and after additional
acid treatment (e,O to remove catalyst particles from
the sample. Two images are shown for each sample at
low and high magdcation, respectively. Fig. 4b shows
that some amorphous carbon is present in the form of a
deposit in some places in the sample before oxidation; it
must be noted that Fi.4b is not representative of the
whole sample, which is mainly clean of amorphous carbon deposit. After oxidation (Figs. 4c and d), the disordered carbon is completely m o v e d and only catalyst
particles are left next to the nmotubm. The catalysts
were oxidized ta form Co304 as shown h Raman spectra (Fig. 2b), for which Raman peaks are strongly excited by the 514nm laser. These oxide particles are
larger than the initial nanometric metal catalytic partides due to caalescence and likely volume increase upon
oxidation. Also, the content of particles in the sample
(relative to the nanotubes) seems to increase after heating to 600 "C, This may be explained by oxidation of
some nanotubes in the sample as evidenced by significant weight loss observed in Fig. 3b.
While high-resolutionTEM does not provide statistically reliable data on the content of defects in the tube
walIs, it clearly shows that the o x i d i d tubes are not defect-free (Fig. M) and do not look more perfect compared to the nonoxidized DWCNT (Fig. 4b). These
wall defects, which are expected to include oxygen-terminsrted carbons, should provide highly reactive sites
an these tubes. This may be useful for cornpastes and
biomedical applications, when surface interactions with
the environment are important. However, these defects
did not cause a double.-resonance effect and did not produce a D band in Raman spectra (Fig. 2b). Acid treatment for removing the catalyst particles after the
oxidation (Figs. 4e and fl leads to a very pure and clean
sample. TEM studies of p*
samples showed neither
catalyst particles nor amorphous carbon, only DWCNT
ready for use. If any catalyst remained, its content was
well below the sensitivity limit of XRD and EDS tecbniques (less than one weight percent). The tubes formed
rings and their mean diameter was in agreement with the
experimental results and the model published by Marttl
et al. [22,23]. Rings have only been observed in oxidized
samples. The sonication provides the activation energy
far ring formatiatt. We had oxidized our DWCNTs at
high temperature in air and then sonicated them for a
short time, compared to many hours in MarteI's work,
to prepare TEM samples.
While the weight loss after heating to 600 'C was significant, further heating experiments in air have shown
that complete removal of disordered oarbon leading to
the disappearance of the D band can be achieved by
long-term isothermal treatment at temperatures Mow
400 OC and is accompanied by a much smaller weight
loss {to be published elsewhere).
h situ Raman spectruscopy analysis of the oxidation
of DWCNT showed a complete disappearance of the D
band in the Raman spactra recorded with 514 nm laser
excitation. This suggests that the D band of DWCNT
is not an intrinsic feature of these tubes; the D band
originates f r ~ m
amorphous carbon present in the sample
and not from defects h the tube walls. The described
oxidation proms provides a method for producing
nmotube samples with a very low DIG ratio (~0.015
for 780 nm excitation). The decrease or disappearance
of the D band has not been observed in MWCNT,
where defects in tube walls generate a much stronger
D band signal compared to DWCNT.
Acknowledgements
The authors are thankful to Kris Behler, Drexel University, for helpfuI comments on the Letter. This work
was supported in part by Arkema, France (MWNTs).
191 E. Borowiak-Men, T,Pichler, X. Liu, M. Knupfer, A. Gra, 0.
Sost, W.Pompe, R.J. Ulenczuk, J. Fi,Chem. Phys. Lett. 363
(2aoZ)567.
[l01 J.D. Saxby, S.P. Cbatfmld, A.J. Pdmisano, A.M. V d o , M.A.
Wilson, L.S.K*Pang, J. Pbys. Chem. 96 (1992) 17.
[Il] E. m
e
, k Bemad, H.=d,
B. Michel, H.Biebuyck,
Science 276 (1997) 779.
[I4 R.R. Bma. E. Flahaut, C. b u r n t . A. Peignty, S. AIoni, P.
Pwh,W.S. B-.
New 1. Phys. 5 (2003) 131.
[I31A.M.Rao,E. Richtw, S. Ihndow, B.Chase, P.C. Eldund,K.A.
Willhs, S. Faug, K.R. Subbaswamy, M. Menon, A. h,
R.E. Smltlley. G. DmseIhaw, M.S. Dremlhaus, Science 275
(1997) 187.
I11 E. Flahaut, A.P e i e y , C. Lamat, A. Rousset, J. Mater. Chem.
l0 (2000) 249.
p] E. Plahaut, R. Bma, A. Peigney, C. Laurent, Chem. Commun.
12 (2003) 1442.
PIL.J.G,ZL. R~o,z.P.z~ou,D.s.T~~~,Y.Q.
Y~P,Y.X.
D.F. Liu, HJ.Yuan, W.Y. Plou, G. Wang, W.Liu, S.S. Xie,
Chm. Phys, Lett. 359 (2002) 63.
141 J.L. Hutchison, N.A. K~iselev,HP.Krinichnaya.A.V. Krestinin,
R.O. Loutfy, A.P. Morawh, V.E. M d y a n , E.D.Obraztsova,
J. Sloan, S.V. Terekhov, D.N.Zakharov, Carbon 39 (2001) 761.
IS] S. Bmdow, T. Himoh, T. Y u m m , K. Hirahara, H.Shinoha,
S. I i j i i a , (3hem. Phys. Lett. 3M (2004)320.
161 S. Gajewski, H.E. Mmeek, U. Knoll, D. Neubert, I. Dorfel, R.
Mach, B. Strausq J.F. Friedrich, Diam. Relat. Mater. 12 (2003)
816.
W.Z. Li, J.G. Wen, M. Sennctt, Z.F.Ren. Chem. Phys. Lett. 368
(2003) 299.
p] S.Bandow, M.Takizawa, K.Hidam, M,Yudmaka, S. Iijima,
Chem.Phys. Lett. 337 (2001) 48.
m
[l41 H.Kuzmany, W. Plank M.HuIman, C. Kmmbzrger, A. Gruneis,
T.Pichler, H.Peterlik, M. Kataura, Y. Achiba, Eur. P h y ~J. B 22
(2001) 307.
[15] A. Jorio, A.G. Souza Filho, G. Dreadhaus, M.S. DraseIhaus,
A.K. Swan, M.S. Unlu, B.B. Goldberg, M.A. Pimenta, J.H.
Haher, CM.Lieber, R.Saito, Pbys. Rev. B 65 (2002) 155412.
[ I q C. Thomm, C. Reich, Phys. Rev. Lett. 85 (2000) 5214.
[ I 7 H.Kataura, Y.Kumuawa, Y.Maniwa, 1. Urnem, S. Suzuki,Y.
Ohtsuh, Y. Achiba, Synthetic Met. I03 (1949) 2555.
[Id S.D.M. Brown, A. Jorio, P. Corio, M.S. D d m , G.
h d h a u s , R. Saita, K. Kneipp, Phys. Rev. B 63 (2001)155414.
[19]S.H.Bokova, HD.Obraztsova, A.V. Osanchy, H.Ku~nany,U.
DeW-WegWcowska, S. Roth, m S. h r i , Y. Gogotsi V.L.
h e & m (Eds.), Nomoengimred Nanofibrous Materials, IUuW, 2 W ,p. 131.
[20] L.J. Ci, Z.P. Zhou. L. Song, X.Q. Yan. D.F. fiu, H.J. Yuan, Y.
Gao, J.X. W a g , L.F.Liu, W.Y. Zhou. G.Wan& S.$. Xie, Appl.
Phys. Lett. 82 (2003) 3098.
[21]H.Qhtsuka, T.Tabata, 0.Okada, L.M.F.Sabatino, G.Bcllussi,
CataL Lett. 44 (1997) 265.
[22] R. M w l , H.R. Shea, P. Avowis, J. Phys. Chem. B 103 (1999)
7551.
1231 R. Martel. H.R.Shm, P.Avnuris, Nature 398 (1999) 299.


© Copyright 2026