
1553
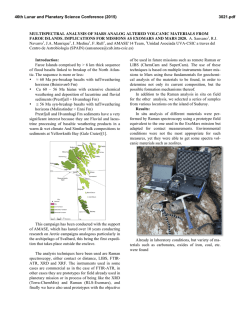
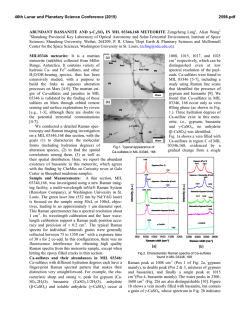
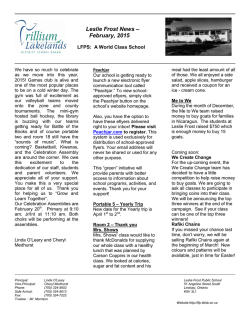
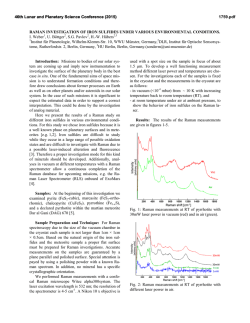
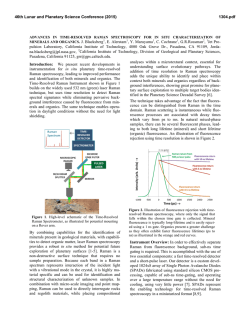
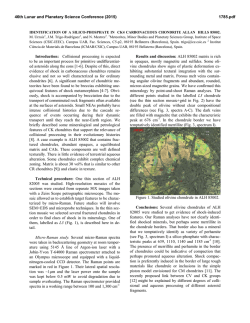
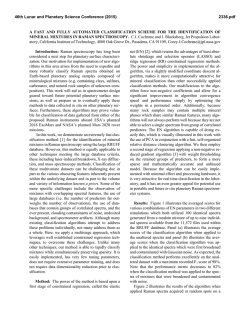
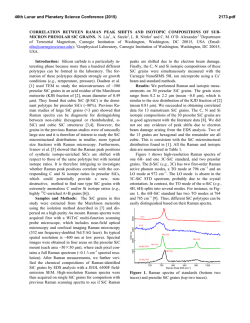
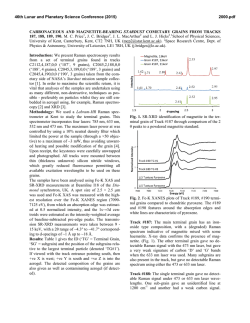
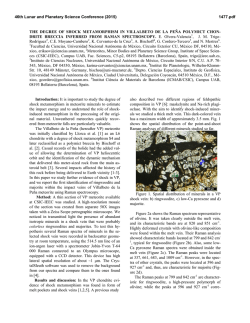
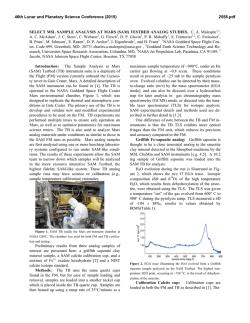
46th Lunar and Planetary Science Conference (2015)
1553.pdf
REMOTE RAMAN DETECTION OF FROST ON MINERALS. A. K. Misra1, S. K. Sharma1, T. E. AcostaMaeda1, G. Berlanga1, S. M. Clegg2, R. C. Wiens2, and M. N. Abedin3, 1Hawaii Institute of Geophysics and Planetology, Univ. of Hawaii at Mānoa, Honolulu, HI 96822, USA; 2Los Alamos National Laboratory, Los Alamos, NM
87545, USA; 3NASA Langley Research Center, Hampton, VA 23681, USA. [email protected]
Introduction: The search for life on other planets and
other Solar System objects is one of the important
goals outlined in the NASA Decadal Survey. The detection of biological materials and biomarkers would
be evidence in support of life outside our planet and an
important step towards meeting the goals of the NASA
planetary exploration program. Apart from detecting
biological materials, a high priority is given to detecting water, organic compounds, and elements such as
C, N, O, S, P, H, Fe, Mn, etc., which are necessary for
biological processes as they are currently understood.
The University of Hawaii (UH), in collaboration with
Los Alamos National Laboratory (LANL) and NASA
Langley Research Center, has successfully developed a
compact remote Raman+LIBS+Fluorescence system
which is capable of measuring Raman, LIBS and fluorescence spectra of minerals under daytime conditions
from standoff distances. Under the Mars 2020 mission, UH is collaborating with LANL and French partners (IRAP and CNES), for developing the SuperCam
instrument which will be able to perform remote chemical analysis of minerals on Mars using Raman, LIBS
and time-resolved fluorescence spectroscopy [1].
Fig. 1: Standoff Raman+LIBS+fluorescence system with
2.5 inch telescope.
Among the various techniques to detect water, ice,
and H2O/OH bearing minerals, Raman spectroscopy
stands out as providing distinctive spectra for their
unambiguous identification. The portable remote Raman instrument developed at UH has been shown earlier to detect water, ice, water-bearing minerals, and
carbon in carbonate form from a distance of 10 to 50
m under bright day conditions with short integration
time [2-5]. Over the years we have demonstrated that
a large number of minerals, including dark minerals,
can be easily detected using compact remote Raman+LIBS systems [6-9]. Here, we demonstrate the
remote Raman capability to distinguish frost on minerals. Mars atmosphere is rich in CO2 and hence is expected to form CO2 frost on minerals under cold conditions. Remote detection of water, water-ice and water
bearing minerals from CO2 frosting on minerals would
be useful for identifying high value targets for both
chemical analysis and sample return missions.
Fig 2: Experimetal setup for producing CO2 frost over
a mineral (left) and in-situ remote Raman detection
(right).
Experimental Set-up and Samples: The combined stand-off Raman, LIBS, and Fluorescence system (Fig. 1) uses a 2.5 inch telescope for collecting
optical signals. A one inch diameter 532 nm notch
filter is used in the back of the telescope to separate
out the Rayleigh scattered light. A frequency-doubled
mini Nd:YAG pulsed 532 nm laser source is used to
excite the target located at a remote distance. The
scattered light generated by the target is collected and
focused onto the slit of a compact spectrograph of size
10 cm (length) x 8.2 cm (width) x 5.2 cm (height). The
spectrograph uses a custom HoloPlex grating and is
equipped with a custom gated thermo-electrically
cooled mini-ICCD detector. Figure 1 shows the combined stand-off spectroscopy system. All spectra were
measured using a 50 micron slit with the intensified
CCD in the gated mode under daylight conditions. The
rock-forming mineral samples were purchased from
Ward’s Natural Science Establishment, Inc., Rochester, New York.
For generating a CO2 frost layer on mineral samples, samples were cooled to liquid nitrogen temperature and frost was build up by blowing CO2 gas over
the samples. Fig. 2 shows the copper sample holder
and shielding which was used to develop the CO2 frost
over the minerals. Similarly, a water-ice layer was
produced by simply blowing air on cold minerals. The
minerals with frost layer were investigated in-situ (Fig.
2, right panel) from a distance of 8 m using 10
mJ/pulse of 532 nm laser power and 5 mm laser spot.
Fig. 3 shows an example of CO2 frost and H2O frost
formed over a calcite mineral using the above setup.
The amount of CO2 frost on calcite is 0.763 g. The
estimated amount of CO2 frost detected by the 5 mm
laser spot is 0.0044 g.
46th Lunar and Planetary Science Conference (2015)Misra et al.
1553.pdf
gases interrogated by the laser (oxygen at 1556 cm-1
and nitrogen at 2331 cm-1). It is also demonstrated that
the remote Raman system is capable of detecting a
mineral behind the frost layer.
Sample at 8 m, 532 nm, 10 mJ/pulse, 10 s
1276
1384
CO2 frost on calcite
3
3114
ice
2331 N2
1556 O2
1748
1
711
2
1434
1085
Mixed frost on calcite
154
282
Intensity (Counts x 106)
4
Water frost on calcite
Calcite in air
0
500
1000 1500 2000 2500 3000 3500 4000
Raman Shift (cm -1)
Figure 4: Remote Raman detection of various frost on
calcite from 8 m distance.
In the dry ice spectrum these sharp bands appear at
1278 and 1385 cm-1 [10].The observed Raman peaks
of CO2 frost at 1276 and 1384 cm-1 indicate much
colder frost temperature than dry ice. Water gives very
strong Raman signal in the 3100 – 3600 cm-1 spectral
region. Water-ice can be distinguished from liquid
water by the presence of a sharper band near 3150 cm-1
[11]. This band shiftes to the observed value of 3114
cm-1 at ~ 173 K. The Raman spectrum of mixed frost
shows presence of both CO2 and H2O molecules
demonstrating capability of Raman spectroscopy to
distinguish mixed chemicals including the atmospheric
1276
1384
1556 O2
CO2 frost
on gypsum
x5
3113
6
415
2
Water frost
on gypsum
3407
3495
4
494
622
671
Results: Fig. 4 shows remote Raman spectra of calcite, CO2 frost on Calcite, H2O frost on calcite and
mixed CO2-H2O frost on calcite in the frequency region, 100 to 4500 cm-1, from a distance of 8 m with
integration time of 10 s. The spectral region covers
the entire Raman spectral range. Calcite Raman fingerprint bands are observed at 154, 282, 711, 1085,
1434 and 1748 cm-1. The strongest Raman band at
1085 cm-1 is the fingerprint of carbonate ions corresponding to the ν1(CO3) symmetric stretching mode of
carbonate functional group. In the spectrum of CO2-ice
the characteristic doublet due to Fermi resonance of
internal modes of vibration of CO2 molecule is clearly
visible. In the Raman spectrum of CO2 gas, the characteristic Fermi doublet appears at 1286 and 1388 cm-1.
8
1137 1008
H2O-frost on Calcite
Intensity (Counts x 106)
CO2-frost on Calcite
Calcite
Fig. 3: Calcite mineral in air (left), with CO2 frost
(middle) and water-frost (right).
2331 N2
Sample at 8 m, 532 nm, 10 mJ/pulse, 10 s
Gypsum
in air
0
500
1000 1500 2000 2500 3000 3500 4000
Raman Shift (cm-1)
Figure 5: Remote Raman detection of various frost on
gypsum from 8 m distance.
Figure 5 shows standoff Raman spectra of hydrous
sulfate mineral gypsum (CaSO4.2H2O) with CO2 and
H2O frost layers. The symmetrical stretching mode of
sulfate ions (ν1(SO4-2)) in gypsum is observed at 1008
cm-1. The chemically-bonded water molecules in gypsum are observed at 3407 cm-1 and 3495 cm-1. Similar
to the data shown in Fig. 4, both CO2 and H2O frost
could be easily detected over gypsum. The sharpening
of Raman bands corresponding to chemically-bonded
water molecules of gypsum indicates a colder sample
temperature.
Summary: The data presented show the ability of a
portable compact remote Raman system to detect frost
layer over minerals from a distance of 8 meters in a
well illuminated background. Such system would be
ideal for identifying minerals and searching for water
on a planetary surface during daylight.
Acknowledgments: This work has been supported
by NASA EPSCoR grant NNX13AM98A and Mars
2020 mission.
References: [1] Clegg,S.M., et al., (2015) LPSC,
this conf. [2] Sharma, S.K., et al., (2002) Appl.
Spectrosc., 56, 699-705. [3] Misra, A.K., et al., (2005)
Spectrochim. Acta, A 61, 2281. [4] Misra, A.K., et al.,
(2006) Appl. Spectrosc., 60, 223-228. [5] Sharma,
S.K., et al., (2011) Spectrochim. Acta, A 80, 75-81. [6]
Sharma, S.K. et al. (2010), LPSC, 41, abstract#1443.
[7] Wiens, R.C., et al., (2005) Spectrochim Acta A,
61, 2324-2334. [8] Sharma, S.K., et al. (2009),
Spectrochim. Acta, A 73, 468-476. [9] Misra, A.K., et
al., (2011) Proc. SPIE, 8032, 80320Q. [10] Sharma,
S.K. et al., (2004), LPSC, 35, abstract#1929. [11]
Misra, A.K. et al. (2006), LPSC, 37, abstract#2155.

© Copyright 2026