
Global Markets Overview
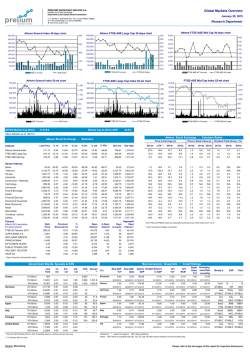
Global Markets Overview
January 30, 2015
Research Department
Athens General Index 30-days chart
450,000
900
400,000
Athens FTSE-ASE Mid Cap 30-days chart
Athens FTSE-ASE Large Cap 30-days chart
450,000
290
8,000
400,000
280
7,000
350,000
270
300,000
300,000
260
250,000
250,000
250
200,000
200,000
240
150,000
150,000
230
100,000
350,000
850
800
750
100,000
50,000
0
710
50,000
210
1,000
690
0
200
0
FTSE-MID 40 Turnover
400,000
1,050
300,000
950
700,000
450
600,000
400
500,000
350
40,000
1,300
35,000
1,200
30,000
400,000
300
300,000
250
15,000
900
10,000
800
700
200,000
200
100,000
750
100,000
150
5,000
0
650
0
100
0
FTSE-20 Turnover
ASE Index
43,641.7
1,000
20,000
850
ATHEX Market Cap (€mn):
1,100
25,000
200,000
ASE Turnover
FTSE-MID 40 Index
FTSE-ASE Mid Cap Index 52-wk chart
FTSE-ASE Large Cap Index 52-wk chart
1,150
670
FTSE-20 Index
1,350
500,000
750
730
Athens General Index 52-wk chart
1,250
770
4,000
2,000
FTSE-20 Turnover
600,000
790
5,000
220
ASE Index
700,000
810
6,000
3,000
700
ASE Turnover
830
Market Cap to 2013e GDP:
0*
600
FTSE-20 Index
FTSE-MID 40 Turnover
FTSE-MID 40 Index
24.0%
Athex Statistics as of: 29/1/15
Athens Stock Exchange - Valuation Ratios
Athens Stock Exchange - Statistics
Price to Earnings (x)
Price to Book Value (x)
Dividend Yield (Gross) (%)
Last Price
% 1d
% 1m
% 3m
% 6m
% ytd
% 52w
52w low
52w high
2013a*
LTM **
2014e
2015e
2013a*
2013a
2014e
Athens General Index
733.61
3.16
-10.11
-19.11
-38.60
-11.20
-36.53
708.61
1,379.42
20.0
N/A
11.1
7.1
1.2
0.6
0.6
1.0
3.6
4.0
FTSE-ASE Large Cap
218.88
4.15
-16.59
-26.13
-42.98
-17.36
-42.40
209.48
445.52
12.0
N/A
11.0
6.8
1.4
0.7
0.6
1.2
4.0
4.1
FTSE-ASE Mid Cap
741.34
1.03
0.89
-9.71
-33.47
-4.10
-34.26
696.63
1,317.40
0.6
N/A
N/A
13.0
0.8
0.6
0.8
0.8
0.7
0.8
Indexes
2014e 2015e
2015e
Sector Indexes
60.90
12.90
-35.86
-50.09
-61.60
-36.68
-65.53
53.22
213.44
1.2
N/A
10.2
4.0
1.1
0.4
0.3
0.0
N/A
N/A
Telecoms
2,091.95
-2.19
-16.48
-17.03
-28.57
-16.48
-27.48
2,058.92
3,633.39
16.5
704.7
10.4
9.1
2.5
1.5
1.4
0.0
N/A
N/A
Oil-Gas
1,723.42
1.51
-6.42
-0.68
-32.38
-5.04
-37.91
1,608.57
3,236.15
N/A
N/A
8.9
6.0
1.3
0.8
0.7
3.3
6.2
9.0
Industrials
2,014.79
1.68
5.35
-4.30
-38.00
3.11
-35.49
1,816.11
3,724.87
30.4
70.4
18.5
8.6
1.5
0.9
0.9
1.6
3.3
3.2
Construction - Materials
Banks
2,147.51
2.92
-0.79
-0.59
-32.17
-1.71
-17.94
2,028.51
3,482.98
N/A
N/A
15.3
9.3
0.8
0.6
0.6
0.1
0.9
2.5
Technology
682.82
3.56
-2.63
-6.41
-29.08
-5.96
-21.50
622.75
1,134.79
N/A
N/A
N/A
N/A
0.5
N/A
N/A
0.5
N/A
N/A
Commerce
4,683.20
-5.71
4.66
0.12
-26.05
2.87
-23.04
3,847.16
7,649.84
30.3
8.9
11.9
9.9
1.7
1.4
1.2
0.0
2.7
2.5
Food & Beverage
5,474.25
1.51
-6.53
-13.57
-17.78
-6.55
-27.26
5,066.70
7,643.82
62.5
24.2
16.9
15.6
2.5
1.6
1.5
1.6
2.6
2.8
122.93
2.66
-12.92
-21.25
-36.94
-14.83
-48.82
115.79
287.11
N/A
N/A
N/A
N/A
0.7
0.3
N/A
0.0
N/A
N/A
Health
Financial Services
1,033.08
8.97
5.93
-9.58
-44.32
3.15
-38.45
900.30
2,207.51
N/A
N/A
13.9
12.4
1.2
1.7
1.7
0.3
5.1
4.8
Personal & Household
4,683.20
-5.71
4.66
0.12
-26.05
2.87
-23.04
3,847.16
7,649.84
30.3
8.9
11.9
9.9
1.7
1.4
1.2
0.0
2.7
2.5
Basic Resources
2,160.92
0.29
13.88
-5.06
-25.60
12.07
-18.46
1,753.11
3,356.44
N/A
N/A
9.8
6.4
0.7
0.6
0.5
0.0
N/A
N/A
Retail
3,809.65
-5.54
2.12
-2.04
-15.05
0.20
22.17
3,090.34
4,836.94
4.6
12.2
11.7
10.4
1.3
1.3
1.2
0.0
2.3
2.9
Real Estate
2,253.90
-0.91
-0.90
-13.34
-22.99
-1.23
-5.02
2,181.63
3,111.71
N/A
N/A
N/A
N/A
N/A
N/A
N/A
N/A
N/A
N/A
Travelling - Leisure
1,317.25
5.17
-11.20
-16.18
-38.27
-14.08
-21.84
1,238.26
2,304.69
24.0
17.8
11.5
9.4
2.3
1.7
1.6
5.4
7.6
8.9
Utilities
1,902.39
6.84
-9.90
-11.60
-52.80
-9.35
-45.14
1,711.47
4,471.04
N/A
N/A
6.1
5.0
0.5
0.3
0.3
0.8
5.1
5.6
Settl.
Price
Premium/
Discount (%)
%
1d
Open
Interest
∆ Open
Interest
Days
to expire
Aggregate
Open
Interest *
218.00
-0.40
4.18
46,399
1,824
21
47,021
0.321
-1.23
22.99
34,362
-5,155
49
34,362
0.93
-0.64
9.50
27,837
-820
49
27,887
Futures
(March 2015 expiration
for stock futures)
FTSE-20 February 2015
ALPHA BANK A.E.
NATL BANK GREECE
0.526
0.19
6.26
34,685
3,950
49
34,690
MYTILINEOS HLDGS
5.37
2.29
2.29
3,526
-48
49
3,526
PUBLIC POWER COR
4.65
-2.72
4.73
4,369
125
49
4,369
HELLENIC TELECOM
7.66
0.79
-2.54
5,199
-150
49
5,259
OPAP SA
7.20
-0.55
4.35
1,312
43
49
1,312
Real GDP
YoY
Real GDP
QoQ
PIRAEUS BANK
* 2013 P/E and P/Book ratios are calculated using the price of the index at 31.12.13
** Last 12 months (Trailing 12 months)
* Open interest for all expiration dates
Government Bonds, Spreads & CDS
Last
Yield
Greece
Germany
France
Spain
Italy
Portugal
United States
1d,
net
6m,
net
Source: Bloomberg
CDS
*
Spread
**
2Yr Bond
N/A
-
-
-
3,170
-
5Yr Bond
13.604
0.18
9.54
2.26
1,585
1,362.0
10Yr Bond
10.171
-0.17
4.31
0.43
1,393
981.2
2Yr Bond
-0.1760
-0.01
-0.21
-0.08
-
-
5Yr Bond
-0.0160
0.00
-0.31
-0.03
18
-
10Yr Bond
0.3590
0.01
-0.76
-0.18
42
-
5Yr Bond
0.088
-0.01
-0.43
-0.09
48
10.4
10Yr Bond
0.597
0.03
-0.91
-0.23
88
23.8
5Yr Bond
0.838
-0.01
-0.20
-0.04
86
85.4
10Yr Bond
1.456
0.02
-1.02
-0.16
134
109.7
5Yr Bond
0.777
-0.02
-0.38
-0.18
109
79.3
10Yr Bond
1.603
0.01
-1.04
-0.29
162
124.4
5Yr Bond
1.627
0.01
-0.44
0.18
183
164.3
10Yr Bond
2.609
0.02
-0.97
-0.08
245
225.0
5Yr Bond
1.2597
-0.01
-0.51
-0.39
-
-
10Yr Bond
1.7355
-0.02
-0.82
-0.44
-
-
30Yr Bond
2.3013
-0.01
-1.01
-0.45
-
-
* Generic CDS Intraday Prices. Due to liquidity reasons, pricing sources may vary
** vs German Bund, in bps
Macroeconomic Snapshots / Credit Ratings
ytd,
net
(%)
Eurozone
0.80
30/9/2014
Greece
1.60
30/9/2014
Germany
1.20
30/9/2014
France
0.40
30/9/2014
Spain
1.60
30/9/2014
Italy
-0.50
30/9/2014
Portugal
1.10
30/9/2014
US
2.70
30/9/2014
0.20
Debt to Budget Balance
to GDP
GDP
90.90
-4.10
30/9/2014 31/12/2013
31/3/2014
174.90
-12.20
30/9/2014 31/12/2013
0.70
31/12/2013
0.10
CPI
YoY
CPI
MoM
-0.20
-0.10
1.50
11.50
31/12/2014 31/12/2014 30/11/2014
30/11/2014
-2.60
25.30
Caa1
*-
B
STABLE
WR
NEG
Aaa
AAAu
AAA
0.10
-0.30
31/1/2015
93.40
-4.10
31/12/2013
92.10
-6.80
30/9/2014 31/12/2013
0.49
31/12/2013
132.60
-2.80
30/9/2014 31/12/2013
-0.10
31/12/2013
128.00
-4.90
30/9/2014 31/12/2013
0.30
31/12/2013
71.80
-2.80
30/9/2014 31/12/2013
5.00
30/9/2014
0.10
-0.80
6.50
31/1/2015 30/11/2014
-1.00
31/1/2015
STABLE STABLE STABLE
0.70
9.90
Aa1
31/12/2014 31/12/2014 30/11/2014
30/9/2014
NEG
NEG STABLE
5.40
23.90
Baa2
BBB
31/12/2014 31/12/2014 31/12/2014
30/11/2014
-1.00
0.00
0.10
B
Fitch
31/10/2014
31/12/2013
1.00
S&P
0.50
76.90
-0.50
Moody's
31/12/2014 31/12/2014 31/10/2014
30/9/2014 31/12/2013
30/9/2014 31/12/2013
Retail UnemploySales ment Rate
(monthly)
YoY
-0.60
-2.32
13.40
Baa2
30/11/2014
STABLE
0.20
13.90
31/12/2014 31/12/2014 30/11/2014
30/11/2014
0.80
0.00
3.20
5.60
31/12/2014 31/12/2014 31/12/2014
-0.37
31/12/2014
AA
BBB+
POS STABLE STABLE
31/12/2014 31/12/2014 30/11/2014
-0.36
0.00
AAu
Ba1
BBBu
BBB+
NEG STABLE
BBu
BB+
STABLE STABLE
POS
Aaa
AA+u
AAA
STABLE STABLE STABLE
Definitions: *- : watch list negative, WR: rating withdrawn
Notes: GDP refers to quarterly data (Q1, Q2, Q3, Q4). All other macro indicators involve monthly data
Please refer to the last pages of this report for important disclosures
Global Markets Overview
January 30, 2015
Research Department
DAX Index 30-days chart
12,000,000
11,000
10,800
10,000,000
S&P 500 Index 30-days chart
Dow Jones Index 30-days chart
16,000,000
10,400
6,000,000
12,000,000
10,200
10,000,000
10,000
8,000,000
9,800
4,000,000
DAX Turnover
2,000,000
16,600
10,000,000
9,000
0
16,400
0
Dow Jones Turnover
10,500
10,000
7,000,000
6,000,000
9,500
5,000,000
9,000
4,000,000
8,500
3,000,000
8,000
2,000,000
1,000,000
7,500
0
7,000
FTSE MIB INDEX
IRISH OVERALL INDEX
1,980
1,960
1,940
S&P 500 Turnover
S&P 500 Index
S&P 500 Index 52-week chart
18,000
140,000,000
17,500
120,000,000
16,000,000
17,000
2,100
2,050
2,000
1,950
1,900
1,850
1,800
1,750
1,700
1,650
1,600
1,550
1,500
100,000,000
16,500
12,000,000
80,000,000
16,000
8,000,000
15,500
4,000,000
60,000,000
15,000
40,000,000
14,500
20,000,000
14,000
0
Dow Jones Turnover
0
S&P 500 Turnover
Dow Jones Index
S&P 500 Index
WORLD INDEXES - Valuation Ratios
WORLD INDEXES - Statistics
PSI All-Share Index GR
30,000,000
Dow Jones Index
20,000,000
DAX Index
IBEX 35 INDEX
2,000
2,060
Dow Jones Index 52-week chart
8,000,000
FTSE 100 INDEX
2,020
40,000,000
9,200
11,000
CAC 40 INDEX
2,040
50,000,000
20,000,000
DAX Index 52-week chart
DAX INDEX
60,000,000
16,800
9,000,000
Athex Composite Share Pr
17,400
4,000,000
10,000,000
Europe
70,000,000
17,000
DAX Index
DAX Turnover
80,000,000
17,600
6,000,000
9,400
0
2,080
17,800
17,200
9,600
2,000,000
2,100
90,000,000
14,000,000
10,600
8,000,000
100,000,000
18,000
Price to Earnings (x)
Price to Book (x)
Dividend Yield (%)
% 6m
% ytd
% 52w
52w Low
52w High
2013a*
LTM **
2014e
2015e
2013a*
2014e
2015e
2013a
2014e
2015e
3.16
29/1/2015 -38.60
-11.20
-36.53
708.61
1,379.42
20.0
N/A
11.1
7.1
1.2
0.6
0.6
1.0
3.6
4.0
10,737.87
0.25
29/1/2015
11.93
9.51
14.56
8,354.97
10,810.57
18.2
17.7
13.8
12.6
1.8
1.7
1.6
2.8
2.9
3.2
France
4,631.43
0.44
29/1/2015
7.40
8.39
10.80
3,789.11
4,679.26
25.6
18.2
14.9
13.3
1.5
1.4
1.4
3.1
3.4
3.6
UK
6,810.60
-0.22
29/1/2015
0.55
3.72
4.16
6,072.68
6,904.86
16.7
19.7
15.2
13.5
2.0
1.7
1.7
3.6
4.0
4.2
4.1
Country
Last Price
% 1d
Greece
733.61
Germany
Last Upd
Spain
10,507.60
0.48
29/1/2015
-3.93
2.22
5.45
9,370.50
11,249.40
16.5
21.8
15.0
12.8
1.4
1.4
1.3
4.4
3.7
Portugal
2,304.30
0.38
29/1/2015 -14.94
8.26
-17.21
2,053.74
3,170.54
N/A
N/A
13.2
8.9
1.3
1.0
0.9
3.1
3.7
4.5
Italy
20,593.72
0.56
29/1/2015
-1.41
8.32
6.09
17,555.77
22,590.18
180.9
N/A
14.6
12.0
1.0
1.0
1.0
2.9
3.7
4.3
Ireland
5,498.23
-0.18
29/1/2015
16.55
5.24
17.37
4,275.26
5,639.89
52.4
36.7
17.9
15.6
1.9
2.0
1.8
1.6
2.0
1.9
Sweden
1,570.39
0.50
29/1/2015
12.31
7.23
20.54
1,246.56
1,570.84
17.0
16.9
16.0
14.9
2.3
2.3
2.2
3.9
3.9
4.2
Luxembourg
1,566.35
-1.71
29/1/2015
-0.37
3.02
8.69
1,353.57
1,608.63
56.0
20.0
17.6
14.0
1.1
1.1
1.1
4.8
2.6
2.8
AUSTRIAN TRADED ATX INDX
Austria
2,187.13
-0.32
29/1/2015
-6.53
1.25
-15.29
1,980.53
2,692.17
24.7
N/A
12.8
10.5
1.0
0.9
0.8
2.8
3.6
4.2
OMX COPENHAGEN 20 INDEX
Denmark
815.32
0.02
29/1/2015
9.60
9.52
27.64
618.14
822.04
19.7
22.7
17.6
15.5
2.5
2.8
2.6
1.8
2.1
2.6
Switzerland
8,435.34
1.49
29/1/2015
-0.73
-6.10
2.81
7,852.83
9,292.44
18.4
19.6
16.4
15.0
2.6
2.5
2.3
3.0
3.5
3.8
OMX STOCKHOLM 30 INDEX
LUXEMBOURG LuxX INDEX
SWISS MARKET INDEX
Emerging Europe
BIST 100 INDEX
SOFIX INDEX
WSE WIG INDEX
BUCHAREST BET INDEX
Turkey
88,557.78
-1.97
29/1/2015
5.15
3.31
41.24
60,848.52
91,805.74
9.9
10.7
10.9
9.5
1.3
1.4
1.3
2.7
2.7
3.1
Bulgaria
498.42
-0.64
29/1/2015
-7.73
-4.54
-8.49
486.61
625.40
7.0
7.6
N/A
N/A
0.7
N/A
N/A
5.3
N/A
N/A
Poland
52,040.24
0.65
29/1/2015
3.27
1.21
3.22
48,765.47
55,687.59
17.5
16.8
13.3
11.4
1.3
1.3
1.2
3.7
3.7
4.0
Romania
7,011.07
0.05
29/1/2015
1.09
-1.02
9.06
6,110.93
7,309.05
11.9
9.7
8.9
8.2
1.0
0.9
0.8
2.8
4.1
4.8
BRIC
BRAZIL IBOVESPA INDEX
Brazil
47,762.24
0.14
-4.49
1.10
44,904.83
62,304.88
29.8
15.4
10.6
9.0
1.1
1.1
1.0
4.0
4.4
5.1
Russia
1,657.98
1.12
9:16:56 πµ
19.96
18.71
13.31
1,182.89
1,706.29
6.7
8.2
5.3
4.6
0.8
0.5
0.4
3.9
5.5
6.4
India
29,318.55
-1.22
9:01:55 πµ
12.39
6.62
43.03
19,963.12
29,844.16
16.7
20.5
18.7
15.9
2.6
2.9
2.6
1.5
1.4
1.5
China
3,210.36
-1.59
9:01:34 πµ
47.18
-0.75
57.91
1,974.38
3,406.79
10.3
15.4
12.3
10.8
1.4
1.6
1.4
3.0
2.4
2.7
DOW JONES INDUS. AVG
US
17,416.85
1.31
29/1/2015
3.18
-2.28
9.90
15,340.69
18,103.45
15.7
15.6
16.1
14.5
2.9
2.9
2.7
2.1
2.4
2.5
NASDAQ COMPOSITE INDEX
US
4,683.41
0.98 12:16:00 πµ
4.94
-1.11
13.59
3,946.03
4,814.95
27
34
19.9
17.1
3.3
3.3
3.0
1.2
1.2
1.2
S&P 500 INDEX
US
2,021.25
0.95
29/1/2015
2.60
-1.83
12.66
1,737.92
2,093.55
17.2
17.8
16.9
15.0
2.6
2.5
2.4
1.9
2.1
2.2
1.7
MICEX INDEX
S&P BSE SENSEX INDEX
SHANGHAI SE COMPOSITE
29/1/2015 -16.03
US
Asia, Pacific
NIKKEI 225
HANG SENG INDEX
Japan
17,674.39
0.39
8:28:01 πµ
12.96
1.28
17.77
13,885.11
18,030.83
22.2
20.7
19.0
16.8
1.7
1.7
1.6
1.3
1.5
Hong Kong
24,518.37
-0.32
9:01:56 πµ
-0.86
3.87
11.27
21,137.61
25,362.98
10.9
10.4
11.4
10.2
1.4
1.3
1.2
3.3
3.5
3.8
Singapore
3,419.98
0.03
9:01:56 πµ
1.98
1.63
12.97
2,953.01
3,432.62
13.6
13.9
13.9
12.7
1.4
1.3
1.2
3.3
3.3
3.6
Australia
5,588.32
0.34
8:00:36 πµ
-0.61
3.28
7.71
5,052.20
5,679.50
19.8
19.3
16.0
14.7
2.0
1.9
1.8
4.3
4.6
4.9
Straits Times Index STI
S&P/ASX 200 INDEX
Volatility & Risk Indexes
* 2013 P/E and P/Book ratios are calculated using the price of the index at 31.12.13
VDAX
VIX
VXN
DAX
19.84
2.32
29/1/2015
34.24
1.85
15.96
10.80
24.09
S&P 500
18.76
-8.22
29/1/2015
40.74
-2.29
8.50
10.28
31.06
Nasdaq 100
19.48
-8.93
29/1/2015
39.84
-0.81
4.45
9.66
31.17
MARKIT ITRX EUROPE 12/19 (Generic)
Europe
57.17
-
9:15:17 πµ
-7.49
-9.12
-29.35
51.78
86.56
MARKIT ITRX EUR XOVER 12/19 (Generic)
Europe
311.81
-
9:15:17 πµ
26.31
-9.87
1.35
218.43
429.90
% 6m
% ytd
% 52w
52w Low
52w High
COMMODITIES
Energy
Currencies
Price
% 1d
% 6m
% ytd
EUR / US Dollar
1.1327
0.19
-15.34
-6.39
-16.42
1.1098
-
EUR/Japanese Yen
133.44
-0.25
-3.11
-7.98
-4.21
130.15
149.80
43.58
107.73
EUR / British Pound
0.7520
0.10
-5.02
-3.17
-8.55
0.7405
0.8403
-54.78
45.19
115.71
EUR / Swiss Franc
1.0453
0.07
-14.15 -13.08
-14.64
0.7813
1.2262
-46.24
2.67
6.49
EUR / Canadian Dollar
1.4321
0.13
-5.37
1.3754
1.5587
EUR / Australian Dollar
1.4565
-0.47
1.42
-1.72
-5.68
1.3798
1.5591
EUR / Turkish Lira
2.7289
0.00
-4.59
-3.55
-10.71
2.6045
3.1300
3m
Exchange
Last Price
% 1d
-
46.63
-0.47
9:16:00 πµ -55.46
-16.37
-57.02
-
NYM
44.46
-0.16
9:16:55 πµ -55.66
-16.54
-54.74
Brent Crude Futr-Generic 1st month ($/bbl)
ICE
48.82
-0.63
9:06:54 πµ -54.16
-14.84
Natural Gas Futr-Generic 1st month ($/bbl)
NYM
2.69
-0.92
9:16:25 πµ -28.84
-6.75
Dated BFO Crude Oil Spot Px ($/bbl)
WTI Crude Futr-Generic 1st month ($/bbl)
Last Upd
Precious Metals
Exchange
Last Price
% 1d
Last Upd
% 6m
% ytd
% 52w
52w Low
52w High
GOLD SPOT $/OZ
-
1,261.98
0.37
9:16:53 πµ
-2.65
6.51
1.45
1131.24
1392.22
SILVER SPOT $/OZ
-
16.91
-0.22
9:16:51 πµ -17.96
7.69
-11.75
14.29
22.18
PLATINUM SPOT $/OZ
-
1,223.85
0.27
9:16:46 πµ -17.46
1.31
-11.48
1177.15
1521.38
PALLADIUM SPOT $/OZ
-
778.70
0.64
9:16:30 πµ -11.56
-2.39
9.99
696.80
912.00
Base Metals
** Last 12 months (Trailing 12 months)
Money Market Rates
1w
-1.89
1.3994
6m
9m
12m
-0.0140
0.0010
0.0530 0.1350
0.2040
0.2730
US
0.1367
0.1705
0.2546 0.3574
0.5508
0.6179
Japan
0.0407
0.0714
0.1021 0.1436
0.3543
0.2676
Europe
1m
1.89
% 52w 52wLow 52wHigh
Exchange
Last Price
% 1d
Last Upd
% 6m
% ytd
% 52w
52w Low
52w High
LME ALUMINUM 3MO ($) / MT
LME
1,819.00
-1.68
29/1/2015
-8.22
-1.81
4.42
1671.25
2119.50
LME COPPER
LME
5,395.00
-1.62
29/1/2015 -23.82
-14.37
-24.30
5339.50
7220.00
LME
1,860.00
-1.51
29/1/2015 -17.95
0.11
-13.19
1743.00
2307.00
Latest Rate
Last Update
Next Update
LME
14,900.00
-1.00
29/1/2015 -20.11
-1.65
6.54
13650.00
21625.00
Europe
ECB
0.05
22/1/2015
5/3/2015
Exchange
Last Price
% 1d
Last Upd
% 6m
% ytd
% 52w
52w Low
52w High
UK
BoE
0.50
8/1/2015
5/2/2015
Corn Futr-Generic 1st month ($/bu.)
CBT
370.25
-0.34
9:06:50 πµ
2.35
-6.74
-14.59
318.25
519.50
US
Fed
0.25
28/1/2015
18/3/2015
Wheat Futr - Generic 1st month ($/bu.)
CBT
508.25
0.10
9:06:28 πµ
-3.60
-13.82
-8.18
466.25
735.00
Japan
BoJ
0.10
22/1/2014
*
Soybean Futr - Generic 1st month ($/bu.)
CBT
970.50
0.23
9:06:51 πµ -20.48
-4.78
-23.88
904.00
1536.75
LME LEAD
LME NICKEL
3MO ($) / MT
3MO ($) / MT
3MO ($) / MT
Agriculture
Sugar Futr - Generic 1st month ($/lb.)
NYB
14.85
-2.04
29/1/2015 -10.65
2.27
0.75
13.32
18.47
Coffee Futr - Generic 1st month ($/lb.)
NYB
160.00
-4.59
29/1/2015 -11.46
-3.96
36.64
117.15
225.50
Live Cattle Futr - Generic 1st month ($/lb.)
CME
153.53
-0.28
29/1/2015
-3.31
-7.35
8.06
135.40
171.98
Lean Hogs Futr - Generic 1st month ($/lb.)
CME
68.55
-4.16
29/1/2015 -43.56
-15.58
-20.77
68.53
133.90
Source: Bloomberg
Interest Rates
* As of 4/4/2013, the BOJ has shifted its monetary policy focus to a targeted monetary
base via Japanese government bond (JGB) purchases.
Please refer to the last pages of this report for important disclosures
Global Markets Overview
January 30, 2015
Research Department
Bonds, Spreads, CDS
10 Yr Bond Yields
5 Yr Bond Yields
Greece, Germany, Ireland, Portugal, Spain
Germany, Ireland, Portugal, Spain, Greece
14
11
13
10
12
9
11
10
8
9
7
8
6
7
5
6
5
4
4
3
3
2
2
1
1
0
0
31/1/2014
24/4/2014
Greece
16/7/2014
Germany
Ireland
7/10/2014
Portugal
-1
30/1/2014
29/12/2014
Spain
Italy
Greek Spreads, 10 Yr Bonds (5 Yr n/a)
35835
-3
1,400
1,650
1,600
1,250
1,550
1,200
1,500
1,150
1,450
1,100
1,400
1,050
1,350
1,000
1,300
950
1,250
900
1,200
850
1,150
800
1,100
750
1,050
700
1,000
650
950
600
900
16/12/2014
26/12/2014
Greek 10Yr Spread
5/1/2015
15/1/2015
25/1/2015
6/10/2014
Portugal
Spain
850
13/1/2015
Greek 5Yr Spread
16/1/2015
19/1/2015
22/1/2015
Greek 5Yr CDS
Spreads and CDS, 10 Yr Bonds
-
Ireland, Portugal, Italy, Spain (CBIL pricing for CDS)
300
28/12/2014
Italy
Greece
Greek CDS, 5 Yr & 10 Yr Bonds (CMAN pricing)
66257
1,300
6/12/2014
15/7/2014
Ireland
1,700
1,350
550
26/11/2014
23/4/2014
Germany
25/1/2015
28/1/2015
Greek 10Yr CDS
Spreads and CDS, 5 Yr Bonds
Ireland, Portugal, Italy, Spain (CBIL pricing for CDS)
220
280
200
260
180
240
220
160
200
140
180
523
160
120
140
100
725.1
702.1
120
80
100
60
80
60
40
40
20
390.16
20
0
18/12/2014
28/12/2014
Irish Spread
Portugese CDS
Italian Spread
Source: Bloomberg
7/1/2015
Irish CDS
Spanish Spread
Italian CDS
17/1/2015
Portugese Spread
Spanish CDS
27/1/2015
0
18/12/2014
28/12/2014
Irish Spread (6Yr)
Portugese CDS
Italian Spread
7/1/2015
Irish CDS
Spanish Spread
Italian CDS
17/1/2015
27/1/2015
Portugese Spread
Spanish CDS
Please refer to the last pages of this report for important disclosures
Global Markets Overview
January 30, 2015
Research Department
Currencies
Euro / US Dollar
1.1327
0.19%
1.40
1.38
1.36
1.34
1.32
1.30
1.28
1.26
1.24
1.22
1.20
1.18
1.16
1.14
1.12
1.10
30/1/2014
28/2/2014
30/3/2014
30/4/2014
30/5/2014
Euro / Japanese Yen
133.44
30/6/2014
30/7/2014
30/8/2014
30/9/2014
30/10/2014
30/11/2014
30/12/2014
Euro / British Pound
-0.25%
0.7520
30/1/2015
0.10%
0.85
150
######
-3.00
145
0.84
0.83
0.82
0.81
0.80
140
0.79
0.78
0.77
135
0.76
0.75
130
30/1/2014
30/3/2014
30/5/2014
30/7/2014
30/9/2014
30/11/2014
30/1/2015
0.74
30/1/2014
30/3/2014
30/5/2014
30/7/2014
30/9/2014
30/11/2014
30/1/2015
Commodities, (Precious) Metals
Dated BFO Crude Oil Spot Px ($/bbl)
46.63
Gold, Spot ($/OZ)
-0.47%
120
1,261.98
0.37%
1,450
110
1,400
100
1,350
90
1,300
80
-
1,250
70
1,200
60
1,150
50
40
30/1/2014
30/3/2014
30/5/2014
30/7/2014
30/9/2014
Aluminum (3MO Future) ($/MT)
1,819.00
30/11/2014
30/1/2015
1,100
30/1/2014
30/5/2014
30/7/2014
30/9/2014
Copper (3MO Future) ($/MT)
-1.68%
2,150
30/3/2014
7,400
2,100
7,200
2,050
7,000
2,000
6,800
1,950
6,600
30/11/2014
5,395.00
30/1/2015
-1.62%
702.1
6,400
1,900
6,200
1,850
6,000
363.8
1,800
390.2
5,800
1,750
5,600
1,700
1,650
30/1/2014
Source: Bloomberg
5,400
23/4/2014
15/7/2014
6/10/2014
28/12/2014
5,200
30/1/2014
23/4/2014
15/7/2014
6/10/2014
28/12/2014
Please refer to the last pages of this report for important disclosures
Global Markets Overview
January 30, 2015
Research Department
Macroeconomic Calendar
Regions included: EC, Greece, Germany, France, Portugal, Italy, Spain, Ireland, United Kingdom, US, China, Japan
Date Time
01/29/2015 10:00
01/29/2015 10:00
01/29/2015 10:55
01/29/2015 10:55
01/29/2015 11:00
01/29/2015 11:00
01/29/2015 11:00
01/29/2015 11:00
01/29/2015 11:30
01/29/2015 11:30
01/29/2015 12:00
01/29/2015 12:00
01/29/2015 12:00
01/29/2015 12:00
01/29/2015 12:00
01/29/2015 12:00
01/29/2015 12:00
01/29/2015 12:00
01/29/2015 13:00
01/29/2015 15:00
01/29/2015 15:00
01/29/2015 15:00
01/29/2015 15:00
01/29/2015 15:30
01/29/2015 15:30
01/29/2015 16:45
01/29/2015 17:00
01/29/2015 17:00
01/29/2015 17:00
01/30/2015 01:30
01/30/2015 01:30
01/30/2015 01:30
01/30/2015 01:30
01/30/2015 01:30
01/30/2015 01:30
01/30/2015 01:30
01/30/2015 01:30
01/30/2015 01:30
01/30/2015 01:50
01/30/2015 01:50
01/30/2015 02:05
01/30/2015 04:00
01/30/2015 07:00
01/30/2015 07:00
01/30/2015 07:00
01/30/2015 09:00
01/30/2015 09:00
01/30/2015 09:45
01/30/2015 09:45
01/30/2015 09:45
01/30/2015 09:45
01/30/2015 10:00
01/30/2015 10:00
01/30/2015 10:00
01/30/2015 10:00
01/30/2015 11:00
01/30/2015 11:00
01/30/2015 11:00
01/30/2015 11:00
01/30/2015 11:30
01/30/2015 11:30
01/30/2015 11:30
01/30/2015 11:30
01/30/2015 11:30
01/30/2015 11:30
01/30/2015 12:00
01/30/2015 12:00
01/30/2015 12:00
01/30/2015 12:00
01/30/2015 12:00
01/30/2015 12:00
01/30/2015 13:00
01/30/2015 13:00
01/30/2015 13:00
01/30/2015 13:00
01/30/2015 15:30
01/30/2015 15:30
01/30/2015 15:30
01/30/2015 15:30
01/30/2015 15:30
01/30/2015 16:00
01/30/2015 16:45
01/30/2015 17:00
01/30/2015 17:00
01/30/2015 17:00
01/30/2015 17:00
01/30/2015 17:00
02/01/2015 03:00
Source: Bloomberg
Event
SP
SP
GE
GE
EC
EC
IT
IT
PO
PO
IT
IT
IT
EC
EC
EC
EC
EC
UK
GE
GE
GE
GE
US
US
US
US
US
US
JN
JN
JN
JN
JN
JN
JN
JN
JN
JN
JN
UK
JN
JN
JN
JN
GE
GE
FR
FR
FR
FR
SP
SP
SP
SP
GE
GE
SP
IT
UK
UK
UK
UK
UK
UK
EC
EC
GR
IT
IT
EC
PO
PO
PO
PO
US
US
US
US
US
US
US
US
US
US
US
US
CH
13)
14)
15)
16)
17)
18)
23)
24)
25)
26)
29)
30)
31)
32)
33)
34)
35)
36)
37)
40)
41)
42)
43)
44)
45)
46)
47)
48)
49)
50)
51)
52)
53)
54)
55)
56)
57)
58)
59)
60)
61)
62)
63)
64)
65)
66)
67)
68)
69)
70)
71)
72)
73)
74)
75)
76)
77)
78)
79)
80)
81)
82)
83)
84)
85)
86)
87)
88)
89)
90)
91)
92)
93)
94)
95)
96)
97)
98)
99)
100)
101)
102)
103)
104)
105)
106)
107)
108)
Retail Sales YoY
Retail Sales SA YoY
Unemployment Change (000's)
Unemployment Rate
M3 Money Supply YoY
M3 3-month average
Hourly Wages MoM
Hourly Wages YoY
Consumer Confidence Index
Economic Climate Indicator
Consumer Confidence Index
Business Confidence
Economic Sentiment
Business Climate Indicator
Industrial Confidence
Consumer Confidence
Economic Confidence
Services Confidence
CBI Reported Sales
CPI MoM
CPI YoY
CPI EU Harmonized MoM
CPI EU Harmonized YoY
Initial Jobless Claims
Continuing Claims
Bloomberg Consumer Comfort
Pending Home Sales MoM
Pending Home Sales NSA YoY
ISM Releases Seasonal Adjustments
Jobless Rate
Job-To-Applicant Ratio
Overall Household Spending YoY
Natl CPI YoY
Natl CPI Ex Fresh Food YoY
Natl CPI Ex Food, Energy YoY
Tokyo CPI YoY
Tokyo CPI Ex-Fresh Food YoY
Tokyo CPI Ex Food, Energy YoY
Industrial Production MoM
Industrial Production YoY
GfK Consumer Confidence
Vehicle Production YoY
Housing Starts YoY
Annualized Housing Starts
Construction Orders YoY
Retail Sales MoM
Retail Sales YoY
Consumer Spending MoM
Consumer Spending YoY
PPI MoM
PPI YoY
GDP QoQ
GDP YoY
CPI EU Harmonised YoY
CPI YoY
CPI Brandenburg MoM
CPI Brandenburg YoY
Current Account Balance
Unemployment Rate
Net Consumer Credit
Net Lending Sec. on Dwellings
Mortgage Approvals
Money Supply M4 MoM
M4 Money Supply YoY
M4 Ex IOFCs 3M Annualised
Unemployment Rate
CPI Estimate YoY
Retail Sales YoY
PPI MoM
PPI YoY
CPI Core YoY
Retail Sales MoM
Retail Sales YoY
Industrial Production MoM
Industrial Production YoY
Employment Cost Index
GDP Annualized QoQ
Personal Consumption
GDP Price Index
Core PCE QoQ
ISM Milwaukee
Chicago Purchasing Manager
U. of Mich. Sentiment
U. of Mich. Current Conditions
U. of Mich. Expectations
U. of Mich. 1 Yr Inflation
U. of Mich. 5-10 Yr Inflation
Manufacturing PMI
Survey
Actual
Prior
Revised
Dec
Dec
Jan
Jan
Dec
Dec
Dec
Dec
Jan
Jan
Jan
Jan
Jan
Jan
Jan
Jan F
Jan
Jan
Jan
Jan P
Jan P
Jan P
Jan P
Jan 24
Jan 17
Jan 25
Dec
Dec
-2.50%
-10K
6.50%
3.50%
3.10%
----100
98
-0.12
-4.5
-8.5
101.6
6
32
-0.80%
-0.10%
-1.00%
-0.20%
300K
2405K
-0.50%
10.50%
5.40%
6.50%
-9K
6.50%
3.60%
3.10%
0.00%
1.10%
-21.9
0.3
104
97.1
91.6
0.16
-5
-8.5
101.2
4.8
39
-1.00%
-0.30%
-1.30%
-0.50%
265K
2385K
47.3
-3.70%
8.50%
0.50%
1.90%
-27K
6.50%
3.10%
2.70%
0.10%
1.10%
-22.3
0.3
99.7
97.5
87.6
0.04
-5.2
-8.5
100.7
5.6
61
0.00%
0.20%
0.10%
0.10%
307K
2443K
44.7
0.80%
1.70%
---25K
6.60%
-----0.2
99.9
97.3
-0.15
--100.6
------308K
2456K
-0.60%
1.50%
Dec
Dec
Dec
Dec
Dec
Dec
Jan
Jan
Jan
Dec P
Dec P
Jan
Dec
Dec
Dec
Dec
Dec
Dec
Dec
Dec
Dec
Dec
4Q P
4Q P
Jan P
Jan P
Jan
Jan
Nov
Dec P
Dec
Dec
Dec
Dec
Dec
Dec
Dec
Jan
Nov
Dec
Dec
Jan A
Dec
Dec
Dec
Dec
4Q
4Q A
4Q A
4Q A
4Q A
Jan
Jan
Jan F
Jan F
Jan F
Jan F
Jan F
Jan
3.50%
1.12
-2.30%
2.30%
2.60%
2.10%
2.20%
2.20%
1.80%
1.20%
0.30%
-2
--14.80%
0.900M
-0.30%
3.60%
0.50%
-0.50%
--0.50%
1.90%
-1.50%
-1.20%
---13.50%
1.2B
1.9B
59.0K
---11.50%
-0.50%
---0.70%
----0.60%
3.00%
4.00%
0.90%
1.10%
58
57.5
98.2
----50.2
3.40%
1.15
-3.40%
2.40%
2.50%
2.10%
2.30%
2.20%
1.70%
1.00%
0.30%
1
-2.50%
-14.70%
0.883M
7.50%
0.20%
4.00%
------------------------------------------
3.50%
1.12
-2.50%
2.40%
2.70%
2.10%
2.10%
2.30%
1.80%
-0.50%
-3.70%
-4
-12.20%
-14.30%
0.888M
16.90%
1.00%
-0.80%
0.40%
-1.10%
-0.10%
-2.00%
0.50%
1.60%
-1.10%
-1.00%
0.00%
0.30%
0.3B
13.40%
1.3B
2.1B
59.0K
0.00%
-2.80%
2.90%
11.50%
-0.20%
0.50%
-0.20%
-1.60%
0.70%
3.10%
0.20%
-0.10%
-2.00%
0.70%
5.00%
3.20%
1.40%
1.40%
57.61
58.3
98.2
108.3
91.6
2.40%
2.80%
50.1
------2.20%
---------0.50%
-0.80%
----------------------------------58.8
-------
Please refer to the last pages of this report for important disclosures
Global Markets Overview
January 30, 2015
Research Department
Economic Events Calendar
01/30/2015 11:00
01/30/2015 11:00
01/30/2015 12:00
01/30/2015 13:00
01/30/2015 13:00
01/30/2015 14:45
01/30/2015 16:00
01/30/2015 18:30
01/29/2015 01/30
02/02/2015 10:00
02/02/2015
02/03/2015 11:00
02/04/2015 13:00
02/04/2015 18:00
02/04/2015 18:00
02/04/2015 19:45
02/05/2015 11:00
02/05/2015 13:00
02/05/2015 18:00
02/05/2015
02/06/2015 12:00
02/06/2015 19:45
02/06/2015
02/08/2015 02/10
02/09/2015 03:30
02/09/2015 13:00
02/10/2015 11:00
02/10/2015 11:00
02/10/2015 15:20
02/10/2015 17:00
02/11/2015 15:00
02/11/2015 18:00
02/12/2015
02/13/2015 15:30
02/13/2015
02/16/2015 16:00
02/17/2015 10:00
02/18/2015 05:00
02/20/2015 15:30
02/25/2015 14:45
02/25/2015 19:00
02/25/2015
02/26/2015 20:00
02/27/2015
EC
EC
PO
PO
PO
PO
PO
GE
EC
HU
US
PO
PO
EC
PO
US
EC
PO
PO
EC
IT
US
EC
GR
JN
PO
PO
PO
US
PO
US
PO
EC
US
PO
EC
EC
JN
US
EC
FR
PO
GE
EC
Regions included: EC, Greece, Germany, France, Portugal, Italy, Spain, Ireland, United Kingdom, US, China, Japan
1)
NATO's Stoltenberg Holds Press Conference in Brussels
2)
EU's Katainen Speaks on EU Investment Program in Frankfurt
3)
Portuguese Prime Minister Speaks at Debate in Parliament
4)
Portugal Releases December Retail Sales, Employment Report
5)
Portugal Reports Industrial Production Index
6)
Portuguese Vice Premier Portas Speaks at Awards Event
7)
Banco BPI CEO Speaks at American Club of Lisbon Event
8)
Bundesbank's Nagel Speaks in Munich
9)
EU Justice, Interior Ministers Hold Meeting in Latvia
10)
European Central Bankers Meet in Hungary
11)
U.S. President Obama to Release Fiscal 2016 Budget
12)
Fitch Ratings Holds Lisbon Credit Conference
13)
Portugal Reports Fourth-Quarter Unemployment Rate
14)
EU's Hill Speaks at Long-Term Financing Conference in Brussels
15)
Former Novo Banco Board Member Rato Speaks in Parliament
16)
Fed's Mester Speaks on Economy and Banking in Columbus
17)
EU Publishes Economic Forecasts
18)
Portugal Releases Industrial Sales, Employment Report
19)
Espirito Santo Board Member dos Santos Speaks in Parliament
20)
NATO Defense Ministers Hold Meeting in Brussels
21)
Bank of Italy Report on Balance-Sheet Aggregates
22)
Fed's Lockhart Speaks on U.S. Economy in Naples, Florida
23)
U.S.'s Biden Meets With EU Officials in Brussels
24)
Merkel to Make Two-Day Trip to U.S. and Canada
25)
BOJ Board Member Morimoto Speaks in Chiba
26)
Portugal Reports International Trade Figures for December
27)
ECB's Costa, Praet Speak on Financial Stability in Lisbon
28)
Novo Banco CEO Stock da Cunha Speaks in Parliament
29)
Fed's Lacker to Speak on Economy in Raleigh, North Carolina
30)
Construction Entrepreneur Guilherme Speaks in Parliament
31)
Fed's Fisher Speaks to Economists in New York
32)
Former Tranquilidade CEO Brito e Cunha Speaks in Parliament
33)
EU Leaders Hold Summit in Brussels
34)
Revisions of Producer Price Index
35)
Bank of Portugal Releases Data on Banks
36)
Euro-Area Finance Ministers Meet in Brussels
37)
EU Finance Ministers Hold Meeting in Brussels
38)
Bank of Japan Policy Statement/Kuroda Press Conference
39)
Revisions of Consumer Price Index
40)
EU Publishes Its Winter Economic Forecasts
41)
Total Jobseekers
42)
Portugal Releases Year-to-Date Budget Report
43)
Fed's Lockhart Speaks on U.S. Outlook At Banking Conference
44)
EU-Brazil Summit in Brussels
CH
JN
JN
IT
IT
IT
IR
US
US
UK
UK
UK
FR
FR
FR
US
US
CH
CH
CH
JN
US
US
CH
GR
UK
JN
JN
FR
JN
UK
UK
UK
GE
US
US
JN
US
US
IT
GR
GE
US
JN
Regions included: EC, Greece, Germany, France, Portugal, Italy, Spain, Ireland, United Kingdom, US, China, Japan
1)
China Development Bank to Sell CNY4Bln 1-Year Bonds(1502)
2)
Japan Sells JPY5.73 Tln 3-Month Bills; Yield -0.0027%(509)
3)
Japan Sells JPY2.699 Tln 2-Year Bonds; Yld 0.006% (349)
4)
Italy Sells EUR3 Bln 1.05% 2019 Bonds; Yld 0.89%
5)
Italy Sells EUR3.5 Bln 2.5% 2024 Bonds; Yld 1.62%
6)
Italy Sells EUR1.75 Bln Floating 2020 Bonds; Yld 0.87%
7)
Ireland to Sell EUR500 Mln 183-Day Bills
8)
U.S. Sells USD35 Bln 5-Year Notes; High Yld 1.288%
9)
U.S. Sells USD29 Bln 7-Year Notes; High Yld 1.590%
10)
U.K. to Sell GBP500 Mln 28-Day Bills
11)
U.K. to Sell GBP1.5 Bln 182-Day Bills
12)
U.K. to Sell GBP1 Bln 92-Day Bills
13)
France to Sell 3-Month Bills
14)
France to Sell 6-Month Bills
15)
France to Sell 12-Month Bills
16)
U.S. to Sell USD26 Bln 3-Month Bills
17)
U.S. to Sell USD26 Bln 6-Month Bills
18)
China Development Bank to Sell CNY6 Bln 5-Year Bonds (1503)
19)
China Development Bank to Sell CNY5 Bln 7-Year Bonds (1504)
20)
China Development Bank to Sell CNY7 Bln 10-Year Bonds (1505)
21)
Japan to Sell 10-Year Bonds
22)
U.S. to Sell USD25 Bln 52-Week Bills
23)
U.S. to Sell 4-Week Bills
24)
China to Sell CNY20 Bln 5-Year Bonds (1503)
25)
Greece to Sell 26-Week Bills
26)
U.K. to Sell 2024 I/L Bonds
27)
Japan to Sell 3-Month Bill
28)
Japan to Sell 30-Year Bonds
29)
France to Sell Bonds
30)
Japan to Sell 6-Month Bill
31)
U.K. to Sell 1-Month Bills
32)
U.K. to Sell 3-Month Bills
33)
U.K. to Sell 6-Month Bills
34)
Germany to Sell EUR2 Bln Bubills (DE0001119386)
35)
U.S. to Sell 3-Month Bills
36)
U.S. to Sell 6-Month Bills
37)
Japan Auction for Enhanced-Liquidity
38)
U.S. to Sell 4-Week Bills
39)
U.S. to Sell 3-Year Notes
40)
Italy to Sell Bills
41)
Greece to Sell 13-Week Bills
42)
Germany to Sell EUR5 Bln Bonds (DE0001137495)
43)
U.S. to Sell 10-Year Notes
44)
Japan to Sell 3-Month Bill
Government Auctions / Buyouts Calendar
01/29/2015 05:00
01/29/2015 05:35
01/29/2015 05:45
01/29/2015 12:00
01/29/2015 12:00
01/29/2015 12:00
01/29/2015 12:30
01/29/2015 18:30
01/29/2015 20:00
01/30/2015 13:00
01/30/2015 13:00
01/30/2015 13:00
02/02/2015 15:50
02/02/2015 15:50
02/02/2015 15:50
02/02/2015 18:30
02/02/2015 18:30
02/03/2015 04:30
02/03/2015 05:00
02/03/2015 05:00
02/03/2015 05:45
02/03/2015 18:30
02/03/2015 18:30
02/04/2015 05:00
02/04/2015 12:00
02/04/2015 12:30
02/05/2015 05:35
02/05/2015 05:45
02/05/2015 11:50
02/06/2015 05:35
02/06/2015 13:00
02/06/2015 13:00
02/06/2015 13:00
02/09/2015 12:30
02/09/2015 18:30
02/09/2015 18:30
02/10/2015 10:00
02/10/2015 18:30
02/10/2015 20:00
02/11/2015 12:00
02/11/2015 12:00
02/11/2015 12:30
02/11/2015 20:00
02/12/2015 05:35
Source: Bloomberg
Please refer to the last pages of this report for important disclosures
Global Markets Overview
January 30, 2015
Research Department
Earnings Releases Calendar
Global - Top Events
Primary Exchange
New York
Tokyo
Tokyo
Helsinki
SIX Swiss Ex
Xetra
London
Stockholm
MICEX Main
London
Xetra
Helsinki
New York
New York
Toronto
New York
Stockholm
New York
New York
NASDAQ GS
New York
NASDAQ GS
New York
New York
New York
New York
New York
New York
New York
New York
New York
New York
New York
New York
NASDAQ GS
NASDAQ GS
New York
New York
New York
New York
New York
NASDAQ GS
New York
NASDAQ GS
NASDAQ GS
New York
New York
New York
Toronto
Korea SE
Stockholm
New York
New York
Copenhagen
Soc.Bol SIBE
New York
New York
New York
NASDAQ GS
New York
New York
London
Natl India
Natl India
SIX Swiss Ex
New York
New York
New York
New York
New York
NASDAQ GS
Tokyo
EN Paris
Dublin
Company Name
Albemarle Corp
(C) Nomura Holdings Inc
(C) Toshiba Corp
Nokia OYJ
Givaudan SA
Infineon Technologies AG
Diageo PLC
Sandvik AB
(C) Gazprom OAO
Royal Dutch Shell PLC
Deutsche Bank AG
Kone OYJ
Air Products & Chemicals Inc
Helmerich & Payne Inc
Potash Corp of Saskatchewan Inc
Thermo Fisher Scientific Inc
Atlas Copco AB
Enterprise Products Partners LP
Time Warner Cable Inc
Alexion Pharmaceuticals Inc
PulteGroup Inc
Viacom Inc
EMC Corp/MA
Baxter International Inc
Colgate-Palmolive Co
Dow Chemical Co/The
Ford Motor Co
Harley-Davidson Inc
Hershey Co/The
Occidental Petroleum Corp
ConocoPhillips
Coach Inc
Alibaba Group Holding Ltd
Blackstone Group LP/The
Celgene Corp
JetBlue Airways Corp
Valero Energy Corp
Abbott Laboratories
Royal Caribbean Cruises Ltd
Phillips 66
Ally Financial Inc
Biogen Idec Inc
Manitowoc Co Inc/The
Amazon.com Inc
Google Inc
Visa Inc
Deckers Outdoor Corp
InvenSense Inc
Canadian Oil Sands Ltd
(C) Hyundai Glovis Co Ltd
Svenska Cellulosa AB SCA
Chevron Corp
Eli Lilly & Co
Novo Nordisk A/S
Banco Popular Espanol SA
Simon Property Group Inc
MasterCard Inc
AbbVie Inc
Mattel Inc
Altria Group Inc
Tyson Foods Inc
BT Group PLC
(P) ICICI Bank Ltd
(C) ICICI Bank Ltd
Julius Baer Group Ltd
Sysco Corp
Exxon Mobil Corp
Anadarko Petroleum Corp
Cliffs Natural Resources Inc
XL Group PLC
Advent Software Inc
(C) Sharp Corp/Japan
Klepierre
Ryanair Holdings PLC
Bloomberg
Ticker
ALB US
8604 JP
6502 JP
NOK1V FH
GIVN VX
IFX GR
DGE LN
SAND SS
GAZP RM
RDSA LN
DBK GR
KNEBV FH
APD US
HP US
POT CN
TMO US
ATCOA SS
EPD US
TWC US
ALXN US
PHM US
VIAB US
EMC US
BAX US
CL US
DOW US
F US
HOG US
HSY US
OXY US
COP US
COH US
BABA US
BX US
CELG US
JBLU US
VLO US
ABT US
RCL US
PSX US
ALLY US
BIIB US
MTW US
AMZN US
GOOGL US
V US
DECK US
INVN US
COS CN
086280 KS
SCAB SS
CVX US
LLY US
NOVOB DC
POP SM
SPG US
MA US
ABBV US
MAT US
MO US
TSN US
BT/A LN
ICICIBC IN
ICICIBC IN
BAER VX
SYY US
XOM US
APC US
CLF US
XL US
ADVS US
6753 JP
LI FP
RYA ID
Date
29/1/2015
29/1/2015
29/1/2015
29/1/2015
29/1/2015
29/1/2015
29/1/2015
29/1/2015
29/1/2015
29/1/2015
29/1/2015
29/1/2015
29/1/2015
29/1/2015
29/1/2015
29/1/2015
29/1/2015
29/1/2015
29/1/2015
29/1/2015
29/1/2015
29/1/2015
29/1/2015
29/1/2015
29/1/2015
29/1/2015
29/1/2015
29/1/2015
29/1/2015
29/1/2015
29/1/2015
29/1/2015
29/1/2015
29/1/2015
29/1/2015
29/1/2015
29/1/2015
29/1/2015
29/1/2015
29/1/2015
29/1/2015
29/1/2015
29/1/2015
29/1/2015
29/1/2015
29/1/2015
29/1/2015
29/1/2015
29/1/2015
30/1/2015
30/1/2015
30/1/2015
30/1/2015
30/1/2015
30/1/2015
30/1/2015
30/1/2015
30/1/2015
30/1/2015
30/1/2015
30/1/2015
30/1/2015
30/1/2015
30/1/2015
2/2/2015
2/2/2015
2/2/2015
2/2/2015
2/2/2015
2/2/2015
2/2/2015
3/2/2015
2/2/2015
2/2/2015
C
C
C
C
C
C
C
C
C
C
C
C
C
C
C
C
C
C
C
C
C
C
C
C
C
C
C
C
C
C
C
C
C
C
C
C
C
C
C
C
C
C
C
C
C
C
C
C
C
C
C
C
C
C
C
C
C
C
C
C
C
C
C
C
C
C
C
C
C
C
C
C
C
C
Time
Period
0:12
8:00
8:00
8:00
8:00
8:30
9:00
9:00
9:00
9:01
Bef-mkt
12:45
13:00
13:00
13:00
13:00
13:00
13:00
13:00
13:25
13:30
13:50
13:54
14:00
14:00
14:00
14:00
14:00
14:00
14:00
14:00
14:00
14:00
14:02
14:30
14:30
14:37
14:45
15:00
15:00
15:48
23:01
23:01
23:01
23:02
23:05
23:06
23:06
23:26
7:09
9:00
Bef-mkt
Bef-mkt
Bef-mkt
Bef-mkt
Bef-mkt
Bef-mkt
Bef-mkt
13:00
14:00
14:30
Q4 2014
Q3 2015
Q3 2015
Y 2014
Y 2014
Q1 2015
S1 2015
Y 2014
Q3 2014
Y 2014
Y 2014
Y 2014
Q1 2015
Q1 2015
Q4 2014
Q4 2014
Y 2014
Q4 2014
Q4 2014
Q4 2014
Q4 2014
Q1 2015
Q4 2014
Q4 2014
Q4 2014
Q4 2014
Q4 2014
Q4 2014
Q4 2014
Q4 2014
Q4 2014
Q2 2015
Q3 2015
Q4 2014
Q4 2014
Q4 2014
Q4 2014
Q4 2014
Q4 2014
Q4 2014
Q4 2014
Q4 2014
Q4 2014
Q4 2014
Q4 2014
Q1 2015
Q3 2015
Q3 2015
Q4 2014
Y 2014
Y 2014
Q4 2014
Q4 2014
Y 2014
Y 2014
Q4 2014
Q4 2014
Q4 2014
Q4 2014
Q4 2014
Q1 2015
Q3 2015
Q3 2015
Q3 2015
Y 2014
Q2 2015
Q4 2014
Q4 2014
Q4 2014
Q4 2014
Q4 2014
Q3 2015
Y 2014
Q3 2015
8:00
Bef-mkt
15:00
Aft-mkt
Aft-mkt
Aft-mkt
Aft-mkt
6:00
Actual
0.99
19.23
9.6976
0.294
57.757
0.115
0.537
4.797
4.464
3.575
3.928
1.47
1.55
1.7
0.49
1.99
10.46
0.35
2.03
1.3
0.43
1.29
0.69
1.34
0.76
0.85
0.26
0.35
1.04
0.72
0.6
0.72
5.05
1.25
1.01
0.26
1.83
0.71
0.32
1.63
0.4
4.09
0.27
0.45
6.88
2.53
4.5
0.21
0.05
14300
EPS (local currency)
Estimate
Surprise Guidance
1.02
-2.94%
15.118
27.20%
8.502
14.06%
0.27
8.89%
68.478
-15.66%
0.099
16.16%
0.621
-13.53%
4.782
0.31%
3.601
2.982
1.548
1.491
1.551
0.464
1.94
10.719
0.366
2.092
1.287
0.402
1.285
0.683
1.311
0.743
0.695
0.224
0.334
1.064
0.678
0.584
0.66
4.651
0.918
1.007
0.239
1.328
0.686
0.418
1.407
0.393
3.775
0.318
0.183
7.11
2.487
4.515
0.199
0.213
15023.3
10.631
1.643
0.732
10.071
0.138
2.465
0.674
0.856
0.913
0.664
0.727
0.078
4.969
2.669
0.408
1.345
0.87
0.117
0.881
0.357
7.327
2.034
-0.013
-0.72%
31.72%
-5.04%
3.96%
9.61%
5.60%
2.58%
-2.42%
-4.37%
-2.96%
1.01%
6.97%
0.39%
1.02%
2.21%
2.29%
22.30%
16.07%
4.79%
-2.26%
6.19%
2.74%
9.09%
8.58%
36.17%
0.30%
8.79%
37.80%
3.50%
-23.45%
15.85%
1.78%
8.34%
-15.09%
145.90%
-3.23%
1.73%
-0.33%
5.53%
-76.53%
-4.82%
1.475
1.315
1.01
0.69
0.375
4.46
0.19
Currency
USD
JPY
JPY
EUR
CHF
EUR
GBp
SEK
RUB
GBp
EUR
EUR
USD
USD
CAD
USD
SEK
USD
USD
USD
USD
USD
USD
USD
USD
USD
USD
USD
USD
USD
USD
USD
USD
USD
USD
USD
USD
USD
USD
USD
USD
USD
USD
USD
USD
USD
USD
USD
CAD
KRW
SEK
USD
USD
DKK
EUR
USD
USD
USD
USD
USD
USD
GBp
INR
INR
CHF
USD
USD
USD
USD
USD
USD
JPY
EUR
EUR
(*) Reported Value, (^) GAAP Value, (T) Tentative, (C) Confirmed Date, (E) Estimated Date
Source: Bloomberg
Please refer to the last pages of this report for important disclosures
Global Markets Overview
January 30, 2015
Research Department
GREEK MARKET - Corporate Actions
General Meetings
Company
GM Date
Time
Compucon Computer Applications
30/1/15
12.00
Balkan Real Estate SA
3/2/15
15.00
Kleemann Hellas SA
4/2/15
14.00
MLS Multimedia SA
11/2/15
15.00
Alco Hellas SA
13/2/15
12.00
AGM: Annual General Meeting, EGM: Extra-ordinary General Meeting, Rep: Repetitive Meeting
Type
EGM
EGM
EGM
EGM
EGM
Comments
Dividends
Company
Interim Div
2014
X-Div
Date
Remaining Div
2014
X-Div
Date
Total Div
2014 (gross* )
X-Div
Date
Capital
X-Div
Return 2014
Date
Notes
0.15 €
To be proposed at the 26/6/14 GM
0.20 €
To be proposed at the 17/6/14 GM
0.03 €
Approved by the 3/6/14 GM
1.50 €
Approved by the 29/5/14 GM
0.125 €
Approved by the 29/12/14GM
0.2017€ (gross) interim div. + 0.0283€ (net) distribution of tax free reserves (0.23€ total, 0.21€ net)
0.17
21/01/15
0.025 €
20/1/15
Nexans Hellas SA
Hellenic Exchanges - Athens St
Elve SA
Alpha Trust Mutual Fund Manage
Folli Follie SA
OPAP SA
0.2300 €
12/01/15
GEKE SA
Thrace Plastics Co SA
* The abovementioned dividend amounts are subject to a 25% withholding tax (Law 3943/2011)
(1) 0.65€ from retained earnings & reserves + 0.15€ interim dividend 2014. Net amount equals to 0.5461€+0.1250€=0.672€
Rights Issue / Bonus Issue - (Reverse) Splits
Company
Compucon Computer Applications
Ilyda SA
Alco Hellas SA
Kekrops SA
Compucon Computer Applications
Lamda Development SA
JUMBO SA
Kathimerini Publishing SA
Kathimerini Publishing SA
Terms
9 new / 4 old at 1.82€
1 new / 100 old at 0.90€
Rev. Split: 1 new / 5 old
3 new / 1 old at 0.40€
Rev. Split: 1 new / 11 old
0.79469... new / 1 old at 4.25€
Bonus shares: 1 new / 22 old
8 new / 1 old at 0.33€
Rev. Split: 2 new / 10 old
Rights
New
Exercise
Trading
shares
Period
Period trading day
13/10/14
15/10/14
16/10 - 30/10/2014 16/10 - 24/10/2014
18/11/14
Cease of trading: 1/9/2014
5/9/14
11/8 - 19/8/2014
5/8/14
11/8 - 25/8/2014
29/8/14
2/7/14
4/7/14
8/7/14
23/6/14
25/6/14
27/6 - 11/7/2014
27/6 - 7/7/2014 22/7/2014
5/3/14
7/3/14
- 11/3/2014
6/3/14
10/3 - 24/3/2014
10/3 - 18/3/2014
4/3/14
28/3/14
4/3/14
10/3/14
ExDate
Record
Date
Comments
& Notes
Approved by the 6/5 GM
Adjusted start share price 0.751€
Adjusted start share price 0.418€
Approved by the 12/2 GM
Adjusted price €4.46 after the split,
€0.788 after the increase
Mergers
Company
(1)
Elval - Hellenic Aluminium Ind
Absorbed Company
(2)
ETEM SA
Exchange
Terms (1/1)
1/1
Exchange
Terms (1/2)
1/6
Absorbed Company
Cease Trading Day
02/12/14
New Shares
Start Trading Day
5/12/14
Comments
Financial Calendar
Company
FY 2014 Results
Fourlis Holdings SA
24/2/15
Hellenic Telecommunications Or
26/2/15
Bmkt: Before market opens, Amkt: After market closes, ND: Non distribution (of dividend)
Bold Colors indicate a new addition (stays bold for a couple of days) or a current action / event
Time
of Releases
Amkt
Bmkt
Please refer to the last pages of this report for important disclosures
Global Markets Overview
January 30, 2015
Research Department
Bonds, Spreads, CDS
10 Yr Bond Yields
5 Yr Bond Yields
Greece, Germany, Ireland, Portugal, Spain
Germany, Ireland, Portugal, Spain, Greece
14
11
13
10
12
9
11
10
8
9
7
8
6
7
5
6
5
4
4
3
3
2
2
1
1
0
0
31/1/2014
24/4/2014
Greece
16/7/2014
Germany
Ireland
7/10/2014
Portugal
-1
30/1/2014
29/12/2014
Spain
Italy
Greek Spreads, 10 Yr Bonds (5 Yr n/a)
35835
-3
1,400
1,650
1,600
1,250
1,550
1,200
1,500
1,150
1,450
1,100
1,400
1,050
1,350
1,000
1,300
950
1,250
900
1,200
850
1,150
800
1,100
750
1,050
700
1,000
650
950
600
900
16/12/2014
26/12/2014
Greek 10Yr Spread
5/1/2015
15/1/2015
25/1/2015
6/10/2014
Portugal
Spain
850
13/1/2015
Greek 5Yr Spread
16/1/2015
19/1/2015
22/1/2015
Greek 5Yr CDS
Spreads and CDS, 10 Yr Bonds
-
Ireland, Portugal, Italy, Spain (CBIL pricing for CDS)
300
28/12/2014
Italy
Greece
Greek CDS, 5 Yr & 10 Yr Bonds (CMAN pricing)
66257
1,300
6/12/2014
15/7/2014
Ireland
1,700
1,350
550
26/11/2014
23/4/2014
Germany
25/1/2015
28/1/2015
Greek 10Yr CDS
Spreads and CDS, 5 Yr Bonds
Ireland, Portugal, Italy, Spain (CBIL pricing for CDS)
220
280
200
260
180
240
220
160
200
140
180
523
160
120
140
100
725.1
702.1
120
80
100
60
80
60
40
40
20
390.16
20
0
18/12/2014
28/12/2014
Irish Spread
Portugese CDS
Italian Spread
Source: Bloomberg
7/1/2015
Irish CDS
Spanish Spread
Italian CDS
17/1/2015
Portugese Spread
Spanish CDS
27/1/2015
0
18/12/2014
28/12/2014
Irish Spread (6Yr)
Portugese CDS
Italian Spread
7/1/2015
Irish CDS
Spanish Spread
Italian CDS
17/1/2015
27/1/2015
Portugese Spread
Spanish CDS
Please refer to the last pages of this report for important disclosures
OTHER IMPORTANT DISCLOSURES
- The present research report has been published for the first time today/ or on the…./…./……
- The above research material is provided to investors exclusively for information purposes and is not to be used or considered as an offer, advice or invitation to sell or buy or
subscribe for any financial instrument mentioned in the present report. Prelium Investment Services SA shall not treat recipients as its customers by virtue of receipt of this
report. Investors should not in any case rely exclusively upon information contained in this report in order to form any investment decision, but they should at their own and on
an independent basis analyze, evaluate and assess the appropriateness and the value of any particular investment, using the statements and recommendations of this report
only as one of the factors which could effect their investment decisions The investments or services contained or referred to in this report may not be suitable for all investors
and it is recommended that the investors, apart from the independent evaluation of particular investment and strategies, should consult an independent investment advisor if
they are in doubt about such investments or investment services. Securities or the other financial instruments referred to in the research report are subject to investment risks,
including the possible loss of the principal capital invested.
- The clients of Prelium Investment Services SA may already have or may have in the future a position or engage in transactions in any of the financial instruments mentioned
herein or any related investment.
- Although the information or opinions herein was obtained or compiled form sources that are deemed reliable, the accuracy, completeness or correctness of those information
or opinions can not be guaranteed. In producing the research reports, members of Prelium Investment Services SA Research Department may have received assistance from
the subject company (-ies), referred to in this report. Any such assistance may include access to sites of the issuers, visits to certain operations of the subject company (-ies),
meetings with management, employees or other parties associated with the subject company (-ies), and handing by them of historical data regarding the subject company (-ies)
(financial statements and other financial data), as well as of all publicly available information regarding strategy and financial targets. Prelium Investment Services SA research
personnel are prohibited from accepting payment or reimbursement of travel expenses from site visits to subject companies. It should be presumed that the author of this report,
in most cases, has had discussions with the subject company (-ies) to ensure factual accuracy prior to publication. All opinions and estimates in this report reflect the personal
views and judgments of the author and are given in good faith. In addition, those opinions and estimates apply as of the date of the issuance of this report but are subject to
changes without any prior notice. Prices and availability of financial instruments are also subject to changes without prior notice. It should be assumed that any prices quoted in
this report are the closing prices of the last session of the Athens Stock Exchange, unless otherwise indicated. Although Prelium Investment Services SA does not set a
predetermined frequency for publications, it is in the intention of Prelium Investment Services SA to provide research coverage of the subject company (-ies), including in
response to any news affecting these issuers, unless there is lack of news and capacity. Prelium Investment Services SA does not accept any liability whatsoever for any direct
or consequential loss arising from any use of this document or its contents or in respect of any errors or omissions thereto.
PRELIUM SECURITIES & INVESTMENT SERVICES S.A.
Member of the Athens Stock Exchange, Member of the Athens Derivatives Exchange
Head Office: S. Davaki 1 & Kifisias Ave., 115 26 Athens, Greece, Tel. +30 210 36 77 000, Fax +30 210 69 26 403
e-mail [email protected], www.prelium.com
INSTITUTIONAL SALES
RESEARCH DEPARTMENT
Babis Angeletopoulos, [email protected]
Emi Moundrou, [email protected]
FOREIGN MARKETS
ASSET MANAGEMENT
Ioanna Karamani, [email protected]
Konstantinos Asimakopoulos, [email protected]
DERIVATIVES
Andreas Nikolopoulos, [email protected]


© Copyright 2026