
microimaging spectroscopy for the exploration of small bodies
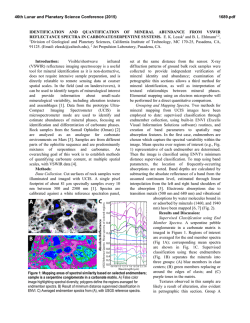
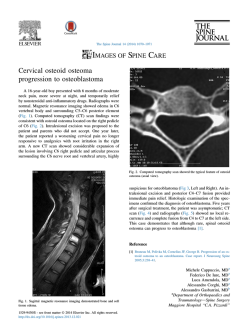
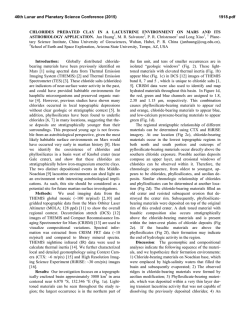
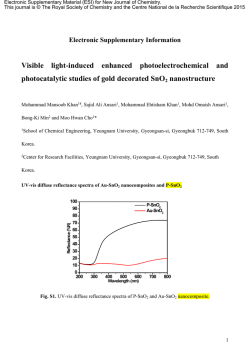
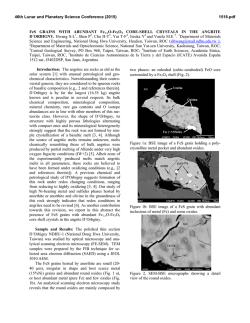
46th Lunar and Planetary Science Conference (2015) 2154.pdf MICROIMAGING SPECTROSCOPY FOR THE EXPLORATION OF SMALL BODIES: FIRST LABORATORY MEASUREMENTS OF CARBONACEOUS CHONDRITE AND HED METEORITES AND A PROPOSED M6 INSTRUMENT FOR IN SITU MEASUREMENT. R.O. Green1, B.L. Ehlmann1,2, A.A. Fraeman2, D. Blaney1, Y. Liu1, N.L. Chabot3, S. Murchie3, M. Wadhwa4, C.D.K. Herd5, M.A. Velbel6, P. Mouroulis1, B. Van Gorp1 1JPL/Caltech ([email protected]), 2GPS, Caltech, 3JHU-APL, 4ASU, 5U. Alberta, 6Michigan State Univ. investigations. Both were proposed for Mars2020 as Introduction: Analysis of mineralogy in geologiMinMap [5] and CIMMBA [6], respectively, receiving cal samples typically requires the preparation of thin Category 1 rankings. Presently, the UCIS prototype is sections or preparation of powders for determination operating at JPL, equipped with a spare focal plane of crystal structure of chemical composition. Here we array having a wavelength range of 500-2500 nm and describe a new technique for petrology, i.e., simultabreadboard foreoptics and an illumination system that neous analysis of small-scale mineralogy and texture, achieves 81 µm/pixel spatial resolution on rock samusing visible/shortwave infrared (VSWIR) imaging spectroscopy, that requires no sample preparation and ples up to ~10 cm ~10 cm in size with ~5 min recan be performed on a rough or cut surface. This apquired for data acquisition. Studies are being conductproach is ideal for the survey of a collection of rare or ed for a variety of Earth and planetary science applicaprecious samples to best target locations for followup tions [e.g., 7, 8]. destructive analyses or for in situ exploration of planeUtility for Meteorite Science in the Laboratory: tary surfaces, when multi-step sample preparation proVSWIR imaging spectroscopy provides a means of cedures may be prohibitively complex. Herein, we rapidly surveying the mineralogy and petrology of a describe first results from analyses of meteorites (carmeteorite, characterizing its compositional diversity bonaceous chondrites and HEDs) as well as an impleand identifying key areas for followup investigation mentation of our microimaging spectroscopy instruwith very high resolution techniques that require samment that is proposed for the Discovery-class mission ple preparation (e.g., SEM, TEM, FIBS, etc.). For our MERLIN [1] to investigate the moons of Mars by initial meteorite pilot study, we use a simple VSWIR landing and conducting in situ elemental and mineral abundance measurements on Phobos, a D-class small body. Development History and Laboratory Instrument Specifications: Investments in imaging spectrometer miniaturization via a joint JPL-APL effort under the MatISSE program and JPL internal funding have led to the development of a hand-sized prototype instrument, the Ultra Compact Imaging Spectrometer (UCIS) (for details, see [2]). The Figure 1: VSWIR imaging spectroscopy of the Murchison CM2 chondrite shows chondrules of UCIS prototype can be diverse composition and fine-grained matrix with varying degrees of aqueous alteration. (a) apfitted with a variety of proximate true color RGB combination (b) parameter map of mafic minerals and hydrated phases (R: foreoptics for panoramic LCPINDEX, G: OLINDEX, B: BD1900); (c) zoom of a region with aqueously altered or finely intermixed [3] or microscopic [4] olivine and Fe/Mg phyllosilicates; (d) zoom of a rare location with pyroxene; (e, f, g) single pixel spectra specific locations (indicated by x,y coordinates) compared with library spectral data [14]. imaging spectrsocpy 46th Lunar and Planetary Science Conference (2015) 2154.pdf parameter-based approach for mapping absorption band depths, similar to that employed for analysis of VSWIR spectroscopic data acquired from Mars orbit [9], although more complex machine-learning algorithms for characterizing endmembers [10] or quantifying endmember abundance [11] and mineral chemistry [12] also are possible. Analyses of the CM2 carbonaceous chondrite Murchison from the ASU meteorite collection demonstrate the ability to quickly map the distribution of mafic and altered phases, while highlighting key compositional variations (Fig. 1). Olivine-rich chondrules (green Figure 2: Howardite sample NWA1769 shows diversity in lithic fragments. (a) Approxiareas, Fig. 1b) of varying sizes are mate visible color image of sample (R: 750 nm, G: 650 nm, B: 550 nm), (b) Mineral indicator observed throughout the sample, map (R: LCPINDEX, G: OLINDEX, B: BD1000) highlighting compositional diversity in pyroxenes within the sample (red to pink) and olivine (cyan). See [9] for parameter definitions. (c) and UCIS data permit the ready Representative spectra from areas indicated by each letter. identification of an “anomalous” HgCdTe detector array with optimized cutoff wavearea, no more than a few pixels in size, with a lowlengths, M6 would be sensitive to all the phases in calcium pyroxene-rich clast, most likely a chondrule Figs. 1 and 2 and also possess improved sensitivity to fragment (magenta, Fig. 1d; 1f). Chondrules where volatile- and carbon-bearing phases via detection and olivine is affected by aqueous alteration (dark green spatial mapping of the fundamental absorptions of spectrum) vs. those where they are not (light green) hydroxylated and hydrated phases (2600-3100 nm) as can be discriminated (Fig. 1e), and several Fe/Mg well as organics and carbonates, which have absorpphyllosilicate alteration phases can be mapped in the tions from 3300-3500 nm. After placement 5 ± 0.5 cm matrix (blue areas in Fig. 1b; blue spectra in Fig. 1g). from the intended regolith or rock target, an illuminaAnalyses of the howardite NWA1769 also demontion system, using heritage OCO-2 quartz-halogen strate the ability of VSWIR imaging spectroscopy to lamps, lights the surface. Image cubes (~300 Mb commap diversity among lithic fragments (Fig. 2). Underpressed) are acquired at multiple focus positions of the standing the abundance, distribution, and chemical actively illuminated target. The cubes are then are zcomposition of these minerals provides insight into stacked using a MAHLI-like approach to produce bestprocesses on Vesta and linkages to interpretation to the focus, single images. Collectively, these data would Dawn dataset. Spectra from this sample show variaenable identification of key silicate, hydrated, and ortions in Fe and Ca content among the abundant pyroxganic phases in Phobos’ regolith; point counting to ene clasts (red spectra Fig. 2c). Several large plagioquantify phase abundances; and testing hypotheses for clase grains are also readily apparent (black spectrum, the origin and evolution of this small body, working Fig. 2c), as well as a small number of rare olivine-rich synergistically with other payload instruments. fragments (blue spectrum, Fig. 2c). Ongoing work Acknowledgements: This work has been conducted at the Jet includes SEM analyses to confirm and further characPropulsion Laboratory, California Institute of Technology under a terize the identified phases [13]. contract with the National Aeronautics and Space Administration. Thanks to J.A. Barrat (U Brest) for supplying this howardite. Spacecraft Implementation for Small Body ExReferences: [1] Murchie et al., this conf. [2] Van Gorp et al., ploration: Based on the heritage of the UCIS instru2014, J. Appl. Rem. Sens. [3] Blaney et al., 2014, IPM abs. [4] Ehment, the MERLIN Mars Moon Microspectromelmann et al., 2014, IPM abs. [5] Blaney et al., 2014, LPSC [6] Ehlmann et al., 2014, LPSC [7] Sanders et al., 2013, AGU abs [8] ter/Microimager for Mineralogy (M6) was designed as Leask & Ehlmann, this conf. [9] Pelkey et al., 2007, JGR [10] Ehan arm-mounted VSWIR infrared microimaging speclmann & Dundar, this conf. [11] Mustard & Pieters, 1989, JGR [12] trometer system approximately 12 cm x 12 cm x 12 cm Sunshine et al., 1990, JGR [13] Liu this conference [14] Clark et al., in size [1]. Operating over an expanded wavelength 2007, USGS spectral library (online) range from 500-3600nm using a Teledyne 6604a


© Copyright 2026