
organic matter in the unique carbonaceous chondrite miller range
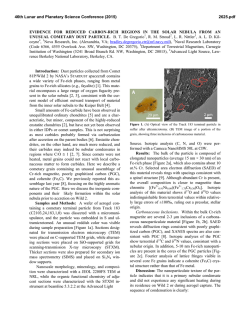
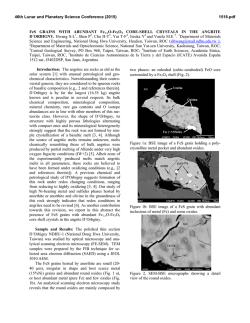
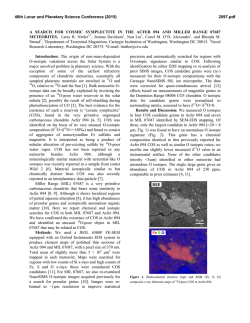
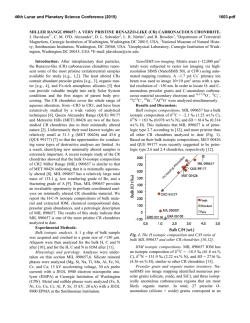
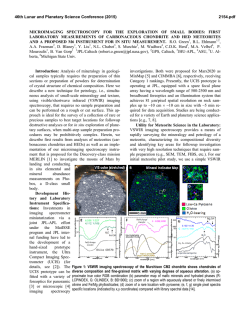
46th Lunar and Planetary Science Conference (2015)
1609.pdf
ORGANIC MATTER IN THE UNIQUE CARBONACEOUS CHONDRITE MILLER RANGE 07687: A
COORDINATED IN SITU NANOSIMS, FIB-TEM, AND XANES STUDY. J. Davidson1*, L. R. Nittler1, R. M.
Stroud2, A. Takigawa3, B. T. De Gregorio4, C. M. O’D. Alexander1, A. L. D. Kilcoyne5, and G. D. Cody6,
1
Department of Terrestrial Magnetism, Carnegie Institution of Washington (CIW), Washington DC 20015, 2Naval
Research Laboratory, Washington DC 20375, 3Department of Mineralogy and Geology, Kyoto University, Kyoto
606-8502, Japan, 4Nova Research Inc., Alexandria VA 22308, 5Advanced Light Source, LBNL, Berkeley CA
94720, 6Geophysical Laboratory, CIW, Washington DC 20015. *E-mail: [email protected]
Introduction: The organic matter (OM) present in
primitive chondrites may have supplied early Earth
with prebiotic molecules that were crucial for the
origin of life [e.g., 1]. While OM can be identified by
its isotopically anomalous compositions via secondary
ion mass spectrometry (SIMS), analysis of OM via
techniques such as X-ray absorption near edge structure (XANES) spectroscopy and transmission electron
microscopy (TEM) allows investigation of its chemistry and microstructure. The analysis of OM located in
situ also allows us to investigate its relationship to the
surrounding matrix material. Miller Range (MIL)
07687 is a unique ungrouped Antarctic carbonaceous
chondrite that shows minimal evidence of thermal
metamorphism [2], but it exhibits a unique type of partial, localized aqueous alteration [3]. It also shows petrographic similarities to the ungrouped C3 Acfer 094
[4]. As a result, MIL 07687 provides us with the opportunity to investigate the effects of aqueous alteration on OM in a single sample at the sub-µm scale. We
report the results of coordinated NanoSIMS–XANES–
TEM analyses of OM located in situ in MIL 07687.
Experimental Methods: Areas of matrix were
identified in a thin section of MIL 07687 via secondary
electron imaging with a JEOL JSM-6500F field emission scanning electron microscope (SEM) at the Carnegie Institution of Washington (CIW). Multiple matrix areas were then subjected to raster ion imaging via
high-resolution SIMS (NanoSIMS 50L at CIW) using
automated mapping routines. A ~2 pA Cs+ primary ion
beam was used to image 10×10 µm2 areas with a spatial resolution of ~150 nm. Three sets of measurements
were performed: (i) to locate C-anomalous carbonaceous material, and O- and C-anomalous presolar
grains (16,17,18O–, 12C2–, 12C13C–, 28Si–, 27Al16O– and secondary electrons), (ii) to determine the C and N isotopic compositions of carbonaceous material (16,17O–, 12C2–
, 12C13C–, 12C14N–, 12C15N–, 28Si– and secondary electrons), and (iii) to determine the H isotopic compositions of carbonaceous material (1H–, 2H–, 12C–, 13C–,
16 –
O and secondary electrons). The abundances of presolar grains were previously reported [4, 5]. In total,
~43,000 µm2 of fine-grained matrix were analyzed.
Three cross-sections (~100 nm thick) of matrix including isotopically anomalous carbonaceous material were
extracted for further analysis by focused ion beam
(FIB) lift-out using an FEI Nova 600 FIB-SEM at the
Naval Research Laboratory (NRL) and a Zeiss Auriga
FIB-SEM at CIW. C, N, and O K-edge XANES analyses were performed on two of the three extracted sections and on a microtomed section of insoluble organic
matter (IOM) using the scanning transmission X-ray
microscope on beamline 5.3.2.2 [6] at the Advanced
Light Source (ALS, LBNL). After XANES spectroscopy, TEM analysis was performed with a JEOL JEM
2200FS at NRL.
Results and Discussion:
NanoSIMS analysis. NanoSIMS ion image mapping identified abundant carbonaceous regions with
anomalous H/C/N isotopic compositions, with δ13C up
to ~200 ‰, δ15N up to ~2,000 ‰ and δD up to ~5,000
‰ (Fig. 1).
Fig. 1. NanoSIMS ion image maps (10×10 µm2 raster
areas) of isotopically anomalous OM in the matrix of
MIL 07687, with the location of three FIB-extracted
sections marked (numbered white lines). (a) Isotopically anomalous OM (δ13C = ~200 ‰) not associated
with Si indicated by the two arrows, (b) OM with isotopically normal C but isotopically anomalous N (δ15N
= ~1400 ‰) adjacent to a Group 4 presolar silicate
grain (outline indicated by arrow), and (c, d) N- and
H-isotopically anomalous OM in a vein (δ15N = 700
‰; δD = 2540 ‰). All scale bars are 1 µm.
Regions with anomalous C-isotopic compositions
do not always exhibit anomalous N- and/or H-isotopic
compositions, and vice versa. The majority of isotopi-
46th Lunar and Planetary Science Conference (2015)
cally anomalous OM grains in MIL 07687 are round
submicron hotspots; one N-anomalous region (~700
nm in diameter; δ15N = 804±22 ‰) is adjacent to an
18
O-rich presolar silicate grain [4] (Fig. 1b). However,
a large (~8×6 µm diameter), isotopically anomalous
‘vein’ of carbonaceous material was also identified
(Fig. 1c,d). The vein is isotopically anomalous in both
N (average δ15N = 700±8 ‰; Fig. 1c) and H (δD =
2540±40 ‰; Fig. 1d), but not C. The isotopic composition is variable across the vein with some hotspots seen
(up to ~2,000 ‰ in δ15N and ~5,000 ‰ in δD). The
MIL 07687 vein is similar to C-rich inclusions previously seen in the CR chondrites QUE 99177 [7] and
GRA 95229 [8], demonstrating the presence of such
material in chondrite groups other than the CR chondrites.
1609.pdf
matic peak (~285 eV), similar to what was seen in the
OM of QUE 99177 [7]. The carbon K-edge XANES
spectra indicate that the carbonaceous material is
chemically variable. No nanoglobules were seen either
in situ or in the extracted IOM via TEM analysis in
contrast to what is seen in the CR chondrites [e.g., 7, 8,
10]. The presence of carbonate is consistent with the
aqueously altered nature of MIL 07687. Thus, MIL
07687 should be considered to be a type 2 carbonaceous chondrite.
Fig. 3. Carbon K-edge XANES spectra from OM and
carbonate in Section 2 (Fig. 2) and microtomed IOM.
Chemical bonds associated with specific peaks are
shown (after [10]).
Fig. 2. TEM HAADF image of Section 2 (vein; Fig. 1c
and 1d) showing the distribution of C (darker regions).
See Fig. 3 for XANES spectra of marked locations.
XANES and TEM analysis. Carbon K-edge
XANES mapping of Section 1 did not detect significant amounts of C adjacent to the supernova silicate
grain. However, TEM analysis revealed that a thin
layer (~25 nm thick) of OM remains at the surface.
Section 3 contains a wedge of carbonaceous material at
the surface but the section could not be studied by
XANES due to the sample geometry (future TEM
analyses are planned). Sections 1 and 2 contain pockets
of OM throughout (e.g., Fig. 2), indicating that OM is
pervasive throughout the matrix of MIL 07687. Carbon
K-edge XANES spectra from OM in these sections
exhibit three spectral bands that are commonly seen in
chondritic IOM [9]. These bands are associated with
the presence of aromatic and olefinic carbon bonds (at
~285 eV), vinyl-keto bonds (at ~286.5 eV), and carboxyl bonds (at ~288.4 eV; Fig. 3) [9]. Spectral features associated with the presence of carbonate were
also seen (at ~290 eV). Spectra from carbonaceous
material show variability in the position of the aro-
Summary: We performed coordinated NanoSIMS
isotopic analysis, XANES spectroscopy, and TEM
microscopy on the OM in sections of matrix from the
unique carbonaceous chondrite MIL 07687. The carbonaceous material appears to be spectrally similar to
IOM from this and other primitive carbonaceous chondrites, but is morphologically different as it contains no
nanoglobules. The OM is present as abundant, isolated,
sub-micron inclusions but also as larger, albeit much
rarer, veins of material. Further NanoSIMS analyses
are planned.
References: [1] Busemann H. et al. (2006) Science
312, 727–730. [2] Davidson J. et al. (2014) LPS XLV,
1384. [3] Brearley A. (2012) LPS XLIII, 1233. [4] Davidson J. et al. (2014) LPS XLV, 1376. [5] Davidson J.
et al. (2014) Goldschmidt, 503. [6] Kilcoyne A. L. D.
et al. (2003) J. Synchrotron Rad., 10, 125–136. [7]
Peeters Z. et al. (2012) LPS XLII, 2612. [8] Peeters Z.
et al. (2012) Meeting of the Met. Soc, A5283. [9] Cody
G. D. et al. (2008) MAPS 43, 353–365. [10] De Gregorio B. T. et al. (2013) MAPS 48, 904–928.
Acknowledgements: ALS beamline 5.3.2.2 is supported by the Director of the Office of Science, Department of Energy, under Contract No. DE-AC0205CH11231.


© Copyright 2026