
2033
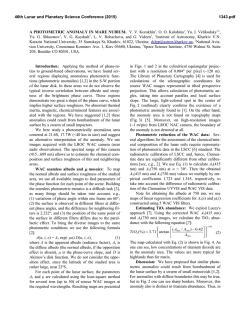
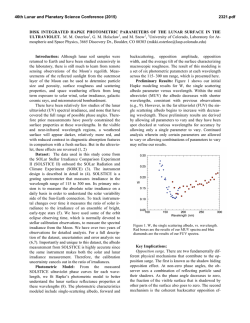
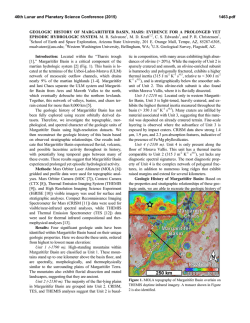
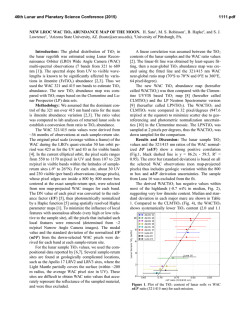
46th Lunar and Planetary Science Conference (2015)
2033.pdf
STATUS OF RESTORING MOON MINERALOGY MAPPER DATA TO FULL SPATIAL AND PHOTOMETRIC ACCURACY. L. R. Gaddis1, J. Boardman2, E. Malaret3, S. Besse4, R. Kirk1, B. Archinal1, K. Edmundson1, L. Weller1 and S. Sides1. 1Astrogeology Science Center, U.S. Geological Survey, 2255 N. Gemini Drive, Flagstaff, AZ, 86001 ([email protected]). 2Analytical Imaging and Geophysics, LLC, Boulder, CO. 3Applied Coherent
Technologies, Herndon, VA. 4ESA/ESTEC, Noordwijk, the Netherlands.
Introduction. The NASA Moon Mineralogy Mapper (M3) instrument on the ISRO Chandrayaan-1
spacecraft returned hyperspectral data for ~95% of the
Moon [e.g., 1-4]. The M3 data are uniquely valuable
for characterizing surficial water [e.g., 2, 5] and soil
and rock mineralogy at high spatial resolution (140
m/pixel) at wavelengths to ~3.0 μm [e.g., 6-9].
However, the M3 data were processed with a
preliminary global digital elevation model from the
Lunar Orbital Laser Altimeter (LOLA) on the Lunar
Reconnaissance Orbiter (LRO). The goal of this work
is to use the higher spatial resolution (~100 m/pixel)
and improved geodetic accuracy of the LRO Wide
Angle Camera (WAC) stereo-derived topographic
model [i.e., the GLD100 digital terrain model or DTM,
10] to improve the selenolocation of the M3 data. Rootmean-squared (RMS) positional errors will be reduced
from ~200 m relative and 450 m absolute to a pixel
(~140 m) or better, and the many images with positional errors of kilometers will be corrected. Spectrophotometric accuracy also will be improved using the
more detailed terrain model in photometric corrections.
This project has several goals: (1) Reprocess M3
data through the original mission’s Level 1B (L1B)
pipeline using the improved DTM to improve selenolocation accuracy; (2) Develop USGS ISIS3 software
[11] for processing M3 data (including a physically
rigorous camera model); (3) Control the global M3
dataset with better accuracy and generate new L1B
products; (4) Reprocess L1B data through the mission’s level 2 (L2) pipeline using the DTM to improve
thermal and photometric accuracy; (5) Improve the
photometric modeling; (6) Create orthorectified and
mosaicked (Level 3) data products; and (7) Deliver
interim and final products, including NAIF SPICE
kernels [12] and calibrated, map-projected M3 products
to the Planetary Data System (PDS). Here we describe
the completion of goals 1 and 2 and ongoing work on
goals 3, 4 and 5.
Improved Selenolocation. The GLD100 is a perfect match for the ~140 m pixel sizes of the M3 data
and geodetically controlling to it is a major step forward in the spatial accuracy of the M3 data. The M3
L1B processing pipeline was used to completely reprocess the data through ray tracing and geometric modeling, creating a full-mission orthorectified product.
There were several major steps in this effort: (1) Create
and validate accurate image frame timing kernel
(SCLK) for every M3 image frame; (2) Complete fullmission ephemeris data; (3) Use GLD100 for tiepointing to the lunar surface and recreating spacecraft
attitude history; (4) Create millions of image-to-image
tie points and image-to-DTM control points; (5) Improve the attitude (roll, pitch and heading vs. time)
inversion at the 1 to 3 M3-pixel level; and (6) Rederive
the full-scene ray-tracing and redelivery of improved
L1B spatial products for each M3 image. Figure 1
shows an uncontrolled test mosaic illustrating wellaligned image frames and detailed and well-resolved
surface features.
Figure 1. 3D view of M3 mosaic from Optical Period (OP)
1B of the central lunar near side featuring Arzachel (18.2°S,
358.1°E; Diam: 96 km, Depth: 3.61 km) and Alpetragius
(16.0°S, 355.5°E, Diam: 39 km, Depth: 3.9 km) craters.
ISIS Software. The USGS ISIS software is free to
users (see http://isis.astrogeology.usgs.gov/, [11]) and
it is used for this work because it supports rigorous
physical modeling of the geometry of image formation
from planetary cameras and the use of photogrammetric bundle-adjustment techniques to control images.
The resulting cartographic products have precision and
accuracy that is not only as high as possible but well
understood and documented by statistical error estimates. For working with M3 data, software has been
developed to support (1) ingestion of M3 L1B data
(both old and new products), (2) creation of pointing,
instrument and frames kernels (CK, IK, SPK, and FK)
from LOC files, and (3) development of a camera
model with characterization of optical distortion of the
M3 camera. The ingestion program provides access not
only to the images in ISIS but also to the associated
metadata. Information in the labels (e.g., the different
resampling of data in the spatial and spectral dimensions in M3 Global and Target Modes) is translated to
an ISIS-friendly format. The appropriate spacecraft
position kernel (SPK, trajectory for an image) is associated with the file, and an initial CK (pointing) kernel
is computed from the LOC file. These capabilities al-
46th Lunar and Planetary Science Conference (2015)
low us to use ISIS to generate improved spacecraft
position and pointing data and to support derivation of
a rigorous solution of the camera pointing and generation of improved CK kernels. The camera model provides the ability to calculate image coordinates (line,
sample) of a point in 3 dimensions or the reverse. A
key part of the ISIS camera model is a new optical
distortion model that provides an accurate representation of the M3 camera geometry in terms of physical
parameters (i.e., boresight orientation, focal length,
radial and decentering distortions).
The ISIS jigsaw program will support a "self calibration" capability that takes advantage of the new
camera model formulation. Jigsaw performs a bundle
adjustment on overlapping images to simultaneously
refine image geometry (i.e., camera pointing, spacecraft position) and control-point coordinates (lat, lon,
radius) to reduce boundary mismatches in mosaics
(Figure 2). Updated jigsaw tools will provide an advanced adjustment capability that allows simultaneous
improvement of the camera parameters and modeling
of timing biases. Controlling the M3 data with these
tools is valuable as an independent check of the solution derived with the team processing pipeline, but this
work also will improve the accuracy and precision of
products to an extent that will be well documented by
rigorous modeling of error propagation. A result of
these new tools will be the creation of significantly
updated SPK kernel data for M3. New SPK data and
other updated kernels for M3 will be delivered to PDS
and NAIF. These data will document the position and
pointing of the spacecraft at all phases of the mission
during collection of M3 data. This information has
been lacking because of the loss of one and then both
star tracker instruments during the mission.
Next Steps: This reprocessing effort affords an opportunity to re-examine the photometric correction of
the M3 data and improve it. The photometric correction
2033.pdf
is based on imaging parameters derived from the improved DTM and is applied to the L2 data. We are
researching application of the Hapke and Akimov photometric models [e.g., 13]. Once a photometric model
is selected, it will be applied to L2 data from which a
thermal correction has been removed [e.g., 14].
In parallel with this work, we are continuing to use
ISIS to create and refine the geodetic control needed to
complete global mosaics with the M3 data. Although
we use feature-based matching tools, control is
primarily evaluated through an iterative process of
orthorectification of images and examination of
consistency of placement of overlapping images in
map coordinates of test mosaics. Presently we are
working with a single wavelength (band 9, 750 nm) to
establish control, but the results will be applicable to
the full multiband dataset. The goal is to produce an
improved hyperspectral mosaic of all M3 Global Mode
data, along with updated kernels and metadata.
References: [1] Goswami & Annadurai, 2009,
Curr. Sci., 96(4), 486-491. [2] Pieters et al., 2009, Science, 326, 568-572. [3] Boardman et al., 2011, JGR
116, E00G14, doi:10.1029/2010JE003730. [4] Green
et
al.,
2011,
JGR
116,
E00G19,
doi:
10.1029/2011JE003797. [5] McCord et al. 2011, JGR
116, E00G05, doi: 10.1029/2010JE003711. [6] Besse
et
al.,
2011,
JGR
116,
E00G13,
doi:10.1029/2010JE003725. [7] Isaacson et al., 2011,
JGR 116, E00G11, doi: 10.1029/2010JE003731. [8]
Mustard et al., 2011, JGR 116, E00G12, doi:
10.1029/2010JE003726. [9] Pieters et al., 2011, JGR
116, E00G08, doi: 10.1029/2010JE003727. [10]
Scholten et al., 2012, JGR 117, E00H17,
doi:10:1029/2011JE003926. [11] Keszthelyi et al.,
2014, LPS XL, Abstract #1686.
[12] Acton, 1996.
PSS, 44(1), 65; http://naif.jpl.nasa.gov/naif/.
[13]
Shkuratov et al., 2011, PSS 59, 1326-1371. [14] Clark
et al., JGR 116, E00G16, doi: 10.1029/2010JE003751.
Figure 2. ISIS test mosaics using 4 M3 images from OP2B and OP2C centered at 28°N, 337°E. (Left) Uncontrolled mosaic using
improved LOC data, showing misregistration and 3X or 2X repeated features (arrows). (Right) Controlled mosaic created using
ISIS jigsaw. Although vertical banding is still apparent, the spatial improvement is obvious.


© Copyright 2026