COMPOSITION OF THE LUNAR HIGHLANDS AS REVEALED BY
46th Lunar and Planetary Science Conference (2015)
2545.pdf
COMPOSITION OF THE LUNAR HIGHLANDS AS REVEALED BY LUNAR PROSPECTOR THERMAL
NEUTRON MEASUREMENTS. Patrick N. Peplowski1*, David J. Lawrence1, David Bazell1, 1Johns Hopkins
University Applied Physics Laboratory, Laurel, MD 20723 (*[email protected])
Introduction: The composition of surface materials in the lunar highlands provides important constraints on models of the formation and early evolution
of the Moon. For example, the global lunar magma
ocean hypothesis [e.g. 1] makes predictions regarding
the nature of the primordial lunar crust for comparison
to the present-day composition of the highlands. Since
the lunar highlands are underrepresented in the Apollo
and Luna sample suites, and much of what we know
regarding the composition of this terrane comes from
remote sensing measurements and geochemical analyses of feldspathic lunar meteorites [2].
One of the most sensitive indicators of the composition of the highlands is the thermal neutron measurements made by the Lunar Prospector (LP) Neutron
Spectrometer (NS) [3]. Thermal neutron measurements
are sensitive to the concentrations of thermal-neutronabsorbing elements, which on the moon includes Fe,
Ti, and the rare-earth elements (REE) Gd and Sm. Prior analyses have used LP thermal neutron data to examine global distributions of Fe, Ti, and REEs [4,5], as
well as to map geochemical terranes across the surface
[6]. We continue these efforts by examining thermal
neutron count rates within the highlands in order to
understand the compositional variability in this region.
Dataset Reduction: This analysis uses corrected,
global maps of LP/NS-measured thermal neutron count
rates [7]. We restrict our analysis to the lunar highlands, which we define to be regions with Fe <4.5
wt%, Ti <1 wt%, and Th <1.1 ppm. This definition
omits the Fe- and Ti-rich mare basalts, and the REErich Procellarum KREP terrane (PKT). Elemental data
used in this selection are from the LP Gamma-Ray
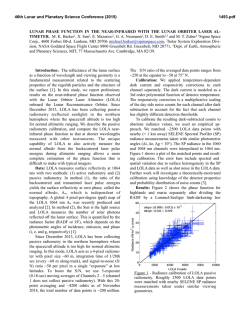
Spectrometer [8]. A map of thermal neutron count
rates within the highlands is shown in Figure 1.
As noted previously, thermal neutron count rates
are sensitive to the neutron absorbing elements Fe, Ti,
Gd, and Sm. In response, we create a detrended thermal neutron map in which variation resulting from
these elements have been removed. This is done in two
steps: 1) Fe and Ti contributions are removed by plotting thermal neutron count rates as a function of Fe +
Ti, where each is weighted by their relative thermalneutron-absorption cross sections (2.56 and 5.99 mb,
respectively); 2) The Fe- and Ti-detrended thermal
neutron count rate is then plotted as a function of Th
concentration, where Th is a stand-in for the REEs.
The notable Th-dependent variations in the thermal
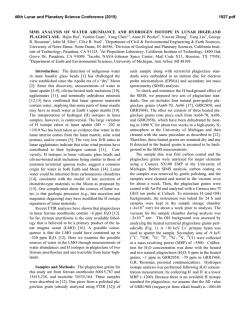
neutron count rates were then detrended to produce the
map shown in Figure 2.
The de-trended thermal neutron map contains appreciable variability that does not depend on the neu-
tron absorbers typically associated with the lunar surface (Fe, Ti, REEs). One possible source is hydrogen.
At the low (~10-120 ppm) levels seen in the highlands
[9], increasing hydrogen concentrations will result in
increasing thermal neutron flux as higher energy neutrons are moderated into the thermal energy regime (E
<~0.1 eV). The correlation coefficient of -0.3 for the
detrended thermal neutrons versus hydrogen concentration indicates that hydrogen is not responsible for
the variability seen in Figure 2.
Composition of the highlands: The detrended
map (Figure 2) shows evidence for two distinct populations – one centered at ~630 counts per (cp) 32 s, and
the second centered at ~665 cp 32s. Both populations
are broad (full-width half maximum ~35 cp 32), and
there is significant overlap. We compare this to the
geochemical mapping of Feldman et al. [6], who found
that the highlands consisted of three distinct units: 1) a
ferroan anorthositic rich unit (FAN), 2) a norite-rich
unit (NOR), and 3) a unit with a composition similar to
the Apollo 16 (A16) and Luna 20 (L20) samples (A16L20). The latter represents a mixing of highlands-like
materials and mare basalts. The spatial distribution of
our higher count rate (~665 cp 32s) population closely
corresponds to the portion of the surface mapped as
FAN by Feldman et al. [6]. The lower count rate (~630
cp 32s) unit corresponds to the NOR+A16-L20 units.
These observations suggest that the detrended
thermal neutrons may be mapping FAN/NOR/Mare
Baslat admixtures within the lunar highlands. To test
this hypothesis, we performed radiation transport modeling of thermal neutron count rates for the Apollo and
Luna sample suites, FAN and NOR endmembers [10],
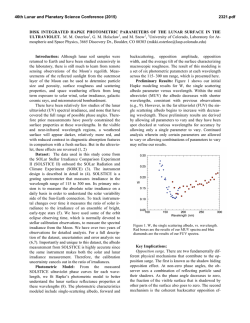
and admixtures of these endmembers (Figure 3). The
modeled count rates were normalized to the measured
(pre-detrending) count rates using the sample suite
modeled values and the LP/NS measurements over
those locations. Figure 3 compares the measured highlands thermal neutron count rates to the modeled FANNOR mixtures. Surprisingly, these admixtures were
only able to account for approximately half of the
measured thermal neutron variability. The addition of a
carbonaceous chondrite (CC) component (0 to 4 wt%),
attributed to infall of meteoritic material, improved the
agreement, however the dynamic range of the measurements still exceeds the models. Note that these CC
concentrations are notionally consistent with those
observed in the Apollo samples (~1.9%; [10]), however CC concentrations >1.5% result in H concentrations
that are higher than those seen in the highlands [9].
Discussion: Lunar thermal neutron count rates vary
significantly (~30%) across the lunar highlands, sug-
46th Lunar and Planetary Science Conference (2015)
gesting the presence of significant compositional variability in this region. Note that this variability is notably larger than that observed on Vesta (~20%; [13])
and Mercury (~9%; [14]).
Our preliminary results show that at least two distinct terranes are present in the lunar highlands. They
are broadly consistent with the terranes identified by
Feldman et al. [6], suggesting that they correspond to
FAN, NOR, and mare basalt endmembers. However,
the absolute values of the measured thermal neutron
count rates have yet to be reproduced in radiation
transport simulations of those compositional types. The
source of this discrepancy is unknown, although the
residual variability in the detrended thermal neutron
count rates suggests that elements other than Fe, Ti,
and REEs (as represented by Th concentrations) may
be important. Because our modeled count rates underpredict the measured count rates in the highlands (and
therefore over-predict the neutron absorption), a lowabsorption element (e.g. Al, Mg, Si) must be more
2545.pdf
abundant than highlands than is accounted for in our
models. Those models were based on the AFHT composition [2] and NOR, FAN lunar compositions [10].
References: [1] Warren (1985) Ann. Rev. Earth
Planet. Sci. 13, 201-240. [2] Korotev et al. (2003) Geochim. Cosmochim. Acta. 67, 4895-4923. [3] Feldman
et al. (2004) JGR 109, E07S06. [4] Elphic et al. (2002),
JGR 107, E001460. [5] Elphic et al. (2000) JGR 105,
E001176. [6] Feldman et al. (2000) JGR 105,
E001183. [7] Maurice et al. (2004) JGR 109, E002208.
[8] Prettyman et al. (2006) JGR 111, E12007. [9]
Lawrence et al. (2014) LPSC 45, abstract 1565. [10]
Haskin and Warren (1991), in Lunar Source Book: A
User’s Guide to the Moon. [11] Lawrence et al. (2002)
JGR 107, E001530. [12] Ganapathy et al. (1970) Proc.
Apollo 11 Lunar Sci. Conf., 1117-1142. [13] Prettyman
et al. (2013) Meteorit. Planet. Sci. 48, 2211-2236. [14]
Peplowski et al. (2015) Icarus, in review.
Figure 1. Thermal neutron count rates (counts per 32
s) across the lunar highlands, as measured by the Lunar Prospector Neutron Spectrometer [7].
Figure 3. a) Fe (wt%) versus thermal neutron count
rates (counts per 32 s). b) Fe (wt%) versus modeled
thermal neutron count rates for Apollo (A), Luna (L),
and ferroan anorthosite (FAN) + norite (NOR) admixtures with varying levels of carbonaceous chondrite
(CC) contamination.
Figure 2. De-trended thermal neutron count rates
(counts per 32 s) across the lunar highlands, with contributions from variable Fe, Ti, and REE abundances
empirically removed.
© Copyright 2026
![Download the PDF [178 KB]](http://s2.esdocs.com/store/data/000499344_1-7f4373c1afe39f332b14a8d11d1a7c7f-250x500.png)
