
Enhanced Photometry Using Stereophotoclinometry on the Moon
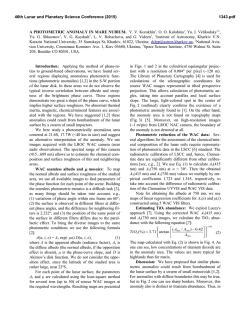
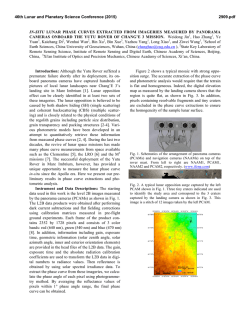
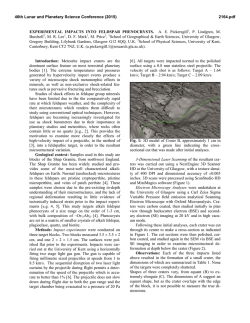
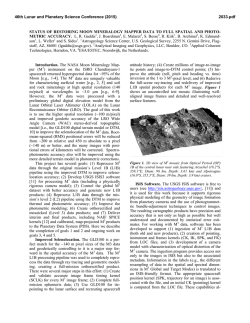
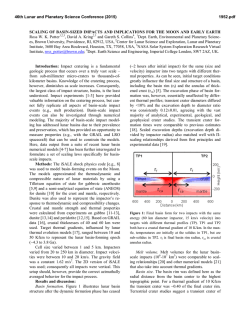
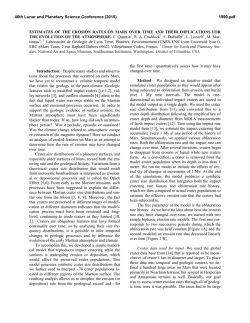
46th Lunar and Planetary Science Conference (2015)
1556.pdf
ENHANCED PHOTOMETRY USING STEREOPHOTOCLINOMETRY ON THE MOON. E. E. Palmer1*
and D. L. Domingue1, *[email protected], 1Planetary Science Institute, 1700 E. Fort Lowell, Suite 106, Tucson AZ,
85719, USA.
Introduction: Photometric characterization of a
planetary surface is highly dependent on the accuracy
to which the illumination and viewing conditions can
be determined. Due to the difficulties of registering
imaging data to a high-resolution digital terrain model
(DEM), photometric analyses typically neglect the
effect of local topography, and instead uses global values. We have developed a technique that allows us to
integrate local topography (on meter scales) into the
photometric analysis of the lunar surface. Photometric
characterization of the lunar surface is the first step in
a process to generate a thermal correction for the Moon
Mineralogy Mapper (M3) data, which will improve the
detection of water on the Moon [1 – 6] and its correlation with such surface properties as slope, roughness,
and composition.
Stereophotoclinometry: The first step for incorporating the illumination (incidence angle) and viewing (emission angle) geometries from local topography
into photometric analyses is to develop an ultra-high
resolution terrain model of the surface. Using Lunar
Reconnaissance Orbiter Camera (LROC) data, we have
constructed a DEM for Tsiolkovsky crater using the
techniques of stereophotoclinometry (SPC) [7]. We
selected a specific sub-region that includes several
types of terrains and a variety of slopes and slope orientations. The test region contains the mare floor of
the crater, a rill within the mare, and one of the andesitic uplifts from the central peak. There are substantial variations in the terrain slope orientations within
this test region, including south-facing slopes that will
have lower temperatures due to their lower insolation.
The source LROC data has a resolution of 0.5 meters,
while the DEM has a grid spacing of 1.5 meters with a
vertical precision of approximately 1 meter. The test
region is a 2,000 x 2,000 pixel region with 5 meter
pixels (i.e. 10 km x 10 km).
Photometric Cubes: The next step in this topographically-enhanced photometric analysis is the construction of “Photometric Cubes”. Photometric cubes
are layered images, in which each layer contains specific data relevant to the pixel position within the cube.
For each LROC image that falls within our test region
we generate a 4-band cube where the four layers contain the reflectance (I/F), phase angle (α), incidence
angle (i), and emission angle (e). The I/F values come
directly from the calibrated LRO NAC images themselves. The phase angle is generated from the United
States Geologic Survey (USGS) Integrated Software
for Imagers and Spectrometers (ISIS) tool. Incidence
and emission angles are calculated directly from the
topographic model using the spacecraft and sun positions. The NAC images are narrower than our test
region, so multiple images are required to fully mosaic
the selected area. Figure 1 shows the parameters derived from image M110751047RC.
Figure 1. The 4 bands from the photometric cube constructed for LROC image M110751047RC. The incidence band (bottom left) and emission band (bottom
right) are derived from the DEM, and thus show the
values for these angle over the entire test region. The
I/F band (top left) and the phase angle band (top right)
are derived from the image and only display the values
for the regions imaged within the test area registerd to
their physical location within the test region.
The key component to generating the photometric
cubes is the registration process performed by SPC.
We use SPC to identify several thousand control-points
(a.k.a. landmarks) in an image that locks its position to
the existing DEM and registers it at a 1/10th of a pixel
accuracy. Once this is performed on all the images,
any location within the working region (2,000 x 2,000
pixel) can be selected and the exact I/F for each observation of that surface feature, along with the associated
α, i, and e can be retreived.
46th Lunar and Planetary Science Conference (2015)
Emission'
Grouping: While this technique would enable you
to perform photometric anlyses on a pixel-by-pixel
basis, the number of images acquired by LROC is limited, requiring grouping of pixels. We used the full
resolution LROC images to define several categories
of terrains. By grouping similar terrains, a single image no longer provides a single data point for a phase
function for photometric modeling (i.e. average I/F, α,
i, and e), but provides a much larger set of data (Fig.
2). Here the phase changes little across the image field
of view, but the range of incidence and emission angles is significant.
Incidence'
Figure 2. Plot of incidence versus emission angle values across the maria floor protion of the test region in
Tsiolkovsky crater. These angle values were extracted
from the four images used in the preliminary analyses
(blue: M110751047RC, red: M103668324L, green:
M123730396L, yellow: M103675484L)
Photometric Characterization Strategy: The
photometric data extracted from the Tsiolkovsky crater
test region is being partitioned based on geologic unit
and regolith morphology. The partitions begin with
two basic divisions: crater floor maria and central peak
uplift. Each of these two regions are to be photometrically modeled individually. These regions are then to
be further divided. The floor maria units will include:
(1) crater and crater ejecta, (2) rill, and (3) boulder
regions. The central peak uplift units will include: (1)
crater and crater ejecta, (2) boulder regions, and (3)
sloped walls (further divided by orientation: north-,
south-, east-, and west-facing).
Each surface unit will be modeled using Hapke’s
model [8 – 14], which is based on geometric optics and
the equtions of radiative transfer, and a second model
described by Kaasalainen et al. [15] and Shkuratov et
al. [16], which has been recently applied to Vesta [17],
the Moon [16], and Mercury [18] (hereafter referred to
as
the
Kaasalainen-Shkuratov
model).
The
Kaasalainen-Shkuratov model separates the effects due
to phase angle (the angle between the incident and
1556.pdf
reflected rays of light) from those due to incidence and
emission angles (which are measured from the surface
normal and thus depend on local topography). The
results from each model will be used to derive and
compare the Bond albedo for the different regolith
region divisions, which in turn provides a surface temperature and thermal spectrum.
Preliminary Results: Hapke modeling of the floor
maria (large crater, rill, and boulder fields excluded)
has been performed. A preliminary Bond albedo of
0.063 was derived for of this region, based on a phase
integral value of 0.458 and physical albedo of 0.137
calculated from the modeling results.
References: [1] Vilas, F. et al. 2008. Earth Planets
Space 60, 67. [2] Clark, R.N., 2009. Science 326, 562.
[3] Pieters, C. M., et al. 2009. Science 326, 568. [4]
Sunshine, J. M., et al. 2009. Science 326, 565. [5]
McCord, T. B., et al. 2011. J. Geophys. Res. 106,
3311. [6] Clark et al. 2011. LPI Contribution #1621,
p8. [7] Gaskell R. W. (2008) Meteoritics & Planet. Sci.
43, 1049-1062. [8] Hapke, B., 1981. J. Geophys. Res.
68, 4571–4586. [9] Hapke, B., 1984. Icarus 59, 41–59.
[10] Hapke, B., 1986. Icarus 67, 264–280. [11] Hapke,
B., 1993. Theory of Reflectance and Emittance Spectroscopy. Cambridge University Press, N.Y., 455 pp.
[12] Hapke, B., 2002. Icarus 157, 523–534. [13]
Hapke, B., 2008. Icarus 195, 918–926. [14] Hapke, B.,
2012. Theory of Reflectance and Emittance Spectroscopy. Cambridge University Press, N.Y., 2nd Ed., 513
pp. [15] Kaasalainen, M., et al., 2001. Icarus 153, 37–
51. [16] Shkuratov Y., et al., 2011. Planet. Space Sci.
59, 1326-1371. [17] Schröder, S.E., et al., 2013.
Planet. Space Sci. 85, 198-213. [18] Domingue, D.L. et
al. 2015, 46th LPSC, abstract 1341, this meeting.
Acknowledgement: This work was supported by
NASA grant NNX13AJ63G under the LASER program.

© Copyright 2026