
2841
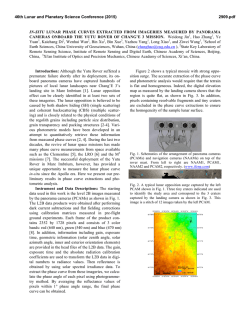
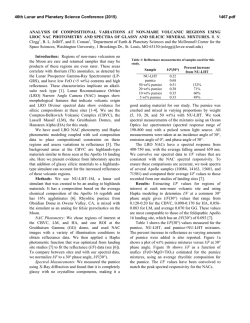
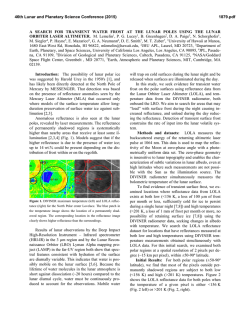
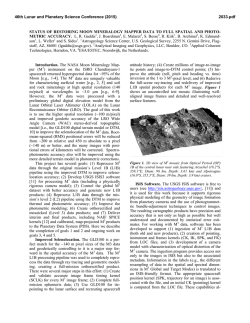
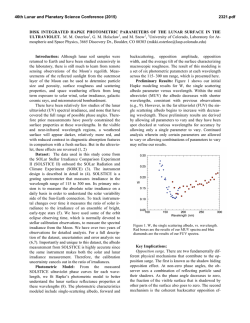
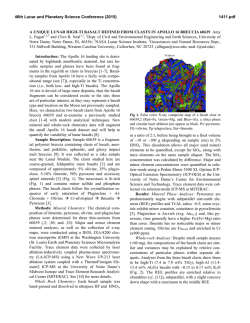
46th Lunar and Planetary Science Conference (2015)
2841.pdf
INVESTIGATING SURFACE TEXTURES USING LROC NAC PHOTOMETRY. A. K. Boyd1, M. S. Robinson1, H. Sato1, 1School of Earth and Space Exploration, Arizona State University, Tempe, AZ, USA
([email protected])
Introduction: The Moon revolves underneath the
orbital plane of the Lunar Reconnaissance Orbiter
(LRO) permitting repeat imaging of any location under
different illumination geometries. These multitemporal observations (since June of 2009) provide a
robust dataset for photometric analysis.
Each Lunar Reconnaissance Orbiter Camera
(LROC) Narrow Angle Camera (NAC) has a 2.85°
field-of-view [1], thus the photometric angles of incidence (angle of sub-solar vector relative to the surface
normal), emission (angle of camera boresight vector
relative to the surface normal), and phase (angle between emission and incidence vectors) [2], vary dominantly from topography in a single image. To allow
quantitative comparisons of reflectance values from
spatially dispersed NAC images, we derived an empirical global photometric solution from ~740,000 LROC
NAC image tiles (2.5km x 2.5km) [3]. We call this the
Mean Moon Photometric Function (MMPF) [EQ1].
The difference from the MMPF at different phase
angles is used to highlight differences in surfaces
properties across the Moon.
!I$
log # & = '2.98 ' 0.011g ' 0.81cos ( e) +1.32cos (i)
"F%
EQ1: Mean Moon Photometric Function (MMPF) used to
normalize NAC images. I/F depends on phase (g), emission
(e) and incidence (i) angles.
Method: LROC NAC images for a given location
were binned to 5 meters per pixel and photometrically
normalized
to
standard
viewing
geometry
(i=30,e=0,g=30) using the MMPF and LROC NAC
Digital Terrain Models (DTMs). The images were then
grouped into phase angle bins: 15° (0°<g≤30°), 45°
(30°<g≤60°), and 75° (60°<g≤90°).
Phase Maps: The phase bins are used to compute
the median normalized reflectance and relative standard deviation at each pixel location for that bin. Any
location with a relative standard deviation greater than
25% is thrown out to ensure a robust map. The final
product is a three band image with R=75°, G=45°, and
B=15° [Fig. 1].
The phase maps represent texture of the surface at
pixel scales and smaller. If the normalized 75° bin has
lower reflectance than the 45° or 15° bins, the area is
considered to be rougher than the mean-Moon. Conversely, if the normalized reflectance of the 75° bin is
greater than the 45° or 15° bins, then the area is interpreted to be smoother than the mean-Moon.
Fig. 1: Phase maps of the Apollo 15 SIVB impact (above)
and the Apollo 16 landing site (below). The RGB images are
normalized reflectance (i=30°, e=0°,g=30°) from different
phase bins. Red=75°, Green=45°, Blue=15°. Images have
different stretches; widths are 1 km.
Reflectance vs Phase: Using the phase maps, areas
were mapped by hand, and the mean values for each
phase bin were calculated for the mapped location including a representative area for the whole scene [Fig.
2].
46th Lunar and Planetary Science Conference (2015)
2841.pdf
Fig. 2: Normalized reflectance of the phase bins for the Apollo 15 SIVB impact location (left) and Apollo 16 landing area
(right). The normalized reflectance show that overall the Apollo 16 blast zone is (right;red) smoother than the SIVB impact ejecta
(left;red).
NAC Photometric Sites: For this study, we have derived two photometric sites near the Apollo 16 landing
site and the Apollo 15 S-IVB impact site. The Apollo
16 landing photometric site has 132 NAC observations
with photometric angles ranging from 8° to 88° incidence, 0° to 66° emission , and 7° to 97° phase angle.
Meanwhile the Apollo 15 SIVB impact site has 69
total observations with photometric angles ranging
from 2° to 72° incidence, 0° to 34° emission, and 0° to
94° phase angle.
Results and Discussion: For a given area, if the
normalized reflectance for the bins are all elevated or
suppressed equally, then the area has the same photometric properties as the mean-Moon, but has higher or
lower reflectance.
Rougher terrains cast more visible shadows on the
surface at higher phase angles than smoother terrains.
The phase angles at which the shadows start appearing
correlates to the degree of roughness, with steeper terrains having more shadows visible at smaller phase
angles. However the scale of the roughness can not be
determined beyond the pixel size. The NAC images in
this study were binned to the DTM resolutions of 5 m
per pixel. The phase maps and differences from the
MMPF can be used to investigate surface roughness
differences at < 5-m scale.
The Apollo 16 blast zone is smoother than the
mean-Moon in agreement with other blast zone analysis [4], while the Apollo 16 landing site outside the
blast zone was found to match the mean-Moon photometric properties. The Apollo 15 SIVB impact ejecta is
rougher than the mean-Moon and similar to small fresh
impact craters. The phase technique can resolve fine
scale (<5m) surface properties and highlight areas of
interest.
References: [1] Robinson et al. (2010) Space Science Rev. 150: 81-124. [2] Hapke B. (2012) Cambridge University Press. [3] Boyd (2014) LPSC 45
#2826. [4] Clegg et al. (2014) LPSC 45 #1625.

© Copyright 2026