
A PHOTOMETRIC ANOMALY IN MARE NUBIUM. V. V. Korokhin1
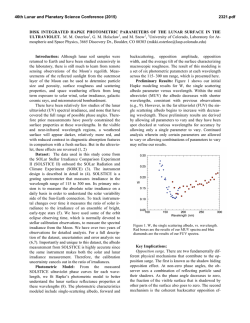
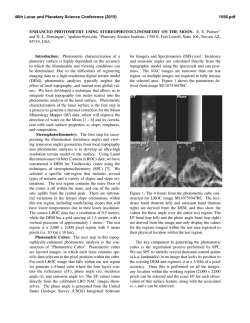
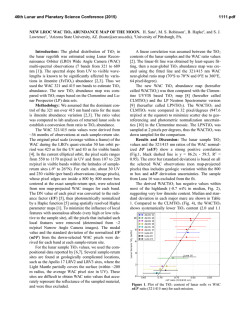
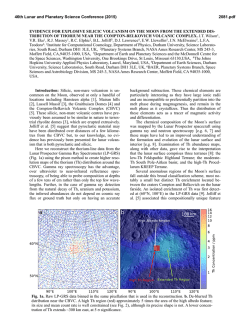
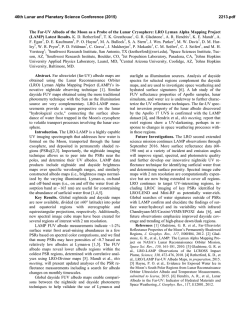
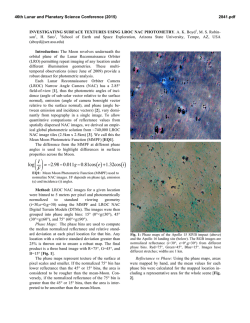
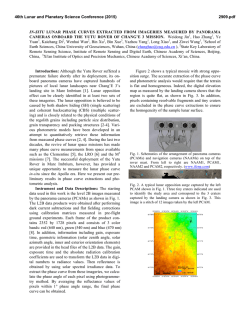
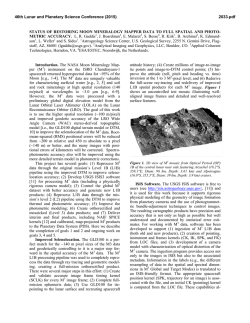
46th Lunar and Planetary Science Conference (2015) 1343.pdf A PHOTOMETRIC ANOMALY IN MARE NUBIUM. V. V. Korokhin1, O. O. Kaluhina1, Yu. I. Velikodsky1,2, Yu. G. Shkuratov1, V. G. Kaydash1, L. V. Rohachova, and G. Videen 3, 1Institute of Astronomy, Kharkiv V.N. Karazin National University, 35 Sumskaya St, Kharkiv, 61022, Ukraine, [email protected], 2National Aviation University, Cosmonaut Komarov Ave. 1, Kiev 03680, Ukraine, 3Space Science Institute, 4750 Walnut St. Suite 205, Boulder CO 80301, USA. Introduction: Applying the method of phase-ratios to ground-based observations, we have found several regions displaying anomalous photometric functions (photometric anomalies) [1,2] in the S-W portion of the lunar disk. In these areas we do not observe the typical inverse correlation between albedo and steepness of the brightness phase curve. These regions demonstrate too great a slope of the phase curve, which implies higher surface roughness. No abnormal thermal inertia, magnetic, chemical/mineral features are associated with the regions. We have suggested [1,2] these anomalies could result from bombardment of the lunar surface by a swarm of small impactors. We here study a photometrically anomalous area centered at 21.6S, 17.7W (40 km in size) and suggest an alternative interpretation of the anomaly. We use images acquired with the LROC WAC camera (near nadir observations). The spectral range of this camera (415...689 nm) allows us to estimate the chemical composition and surface roughness of this and neighboring areas. WAC seamless albedo and mosaics: To map the normal albedo and surface roughness of the studied area, we use all available images to find parameters of the phase function for each point of the scene. Building the seamless photometric mosaics is a difficult task [3], as many things should be taken into account, e.g., (1) variations of phase angle within one frame are 60°; (2) the surface is observed in different filters at different phase angles, and the difference for neighboring filters is 2.232º; and (3) the position of the same point of the surface in different filters differs due to the parallactic effect. To bring the diverse images to the same photometric conditions we use the following formula [2]: A(α, i, e) = An exp(–μα) D(α, i, e), (1) where A is the apparent albedo (radiance factor), An is the diffuse albedo (the normal albedo, if the opposition effect is absent), μ is the phase-curve slope, and D is Akimov’s disk function. We do not consider the opposition effect, since the latitude of the studied area is rather large, near 22ºS. For each point of the lunar surface, the parameters An and μ are calculated using the least-square method for several tens (up to 50) of source WAC images at the required wavelengths. Resulting maps are presented in Figs. 1 and 2 in the cylindrical equiangular projection with a resolution of 0.004° per pixel (~120 m). The Library of Planetary Cartography [4] is used for calculations of the selenographic coordinates for source WAC images represented at tilted perspective projection. This allows calculation of photometric angles, taking into account parallax and local surface slope. The large, light-colored spot in the center of Fig. 2 (outlined) clearly confirms the existence of a photometric anomaly found in [1]. On the other hand, the anomaly area is not found on topography maps (Fig. 3) [5]. Moreover, on high-resolution images (~1 m/pix) from LROC NAC camera, the boundary of the anomaly is not detected at all. Photometric reduction of the WAC data: Several algorithms for the assessment of the chemical/mineral composition of the lunar soils require representation of photometric data in the LSCC [6] standard. The radiometric calibration of LSCC and, hence, Clementine data are significantly different from other calibrations [see, e.g., 2]. We use Eq. (1) to calculate An(415 nm) and An(750 nm) at α = 30°. Then the obtained An(415 nm) and An(750 nm) values we multiply by empirical coefficients 1.723 and 1.345, respectively, to take into account the difference of radiometric calibration of the Clementine UVVIS and WAC VIS data. Note for obtaining the albedo at 750 nm, we use maps of linear regression coefficients for An(λ) and μ(λ) constructed using 5 WAC VIS filters. Estimating TiO2 abundance: We exploit Lucey's approach [7]. Using the corrected WAC An(415 nm) and An(750 nm) images, we calculate the TiO 2 abundance with the following equation [7]: 5.98 ì ü é ( A / A ) - 0.42 ù ï ï TiO2 (%) = 3.71 íarctan ê 415 750 úý A ï ï 750 ë ûþ î (2) The map calculated with Eq. (2) is shown in Fig. 4. As one can see, low concentrations of titanium dioxide are in the anomaly area. The values are more typical for highlands than for maria. Discussion: We have proposed that similar photometric anomalies could result from bombardment of the lunar surface by a swarm of small meteoroids [1,2]. For anomalies with diffuse boundaries this may be true, but in Fig. 2 one can see sharp borders. Moreover, this anomaly also is distinct in titanium abundance. Thus, in 46th Lunar and Planetary Science Conference (2015) this case we deal with a structure and composition feature that does not relate to a swarm impact. We may suggest that this area is a shallow flooding of an elevated formation of highland composition, which is partially denuded by meteoroid impacts. A mixture of mare and highland materials can explain the composition difference between the area and its surroundings, since the highland material has low TiO 2 abundance. We attribute the higher surface roughness to the fact that the highland material extracted by impacts may include rocks and fragments with sizes that are smaller than 1 m. Conclusions: The structure and composition feature can be related to a shallow flooding of an elevated highland area partially denuded by impacts and to stirring of the highland and mare material at the formation of the regolith layer. Anomalous behavior of the phase function may be explained by the difference of surface structure in the area and surrounding regions on the scale of less than 1 m, imperceptible in the camera image LROC NAC. This may be due to the presence in the regolith of excavated rocks and their fragments from the highland material background. References: [1] Shkuratov et al (2010) Icarus, 208, 20–30. [2] Shkuratov et al (2011) PSS, 59, 1326– 1371. [3] Korokhin et al (2014) PSS, 92, 65–76. [4] Shalygin et al (2003) LPS XXXIV, Abstract #1946. [5] Scholten et al (2012) JGR, 1117, doi:10.1029/2011JE003926. [6] http://www.planetary.brown.edu/pds/LSCCsoil.html [7] Lucey et al (1998) JGR, 103, 3701–3708. 1343.pdf Figure 2. The distribution of the phase-curve slope μ(415 nm) for the region under study. Bright color corresponds to higher slope Figure 3. Map of longitudinal slopes calculated from GLD100 [5] Figure 1. Normal albedo An(415 nm) distribution for the region including photometric anomaly detected in [1] (large light-colored spot in the center) Figure 4. The distribution of the Ti02 abundance for the region under study


© Copyright 2026