
Leaf Spectral Reflectance for Nondestructive
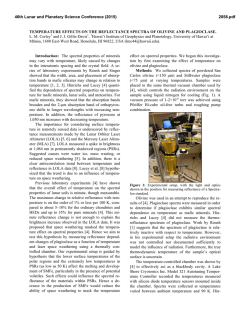
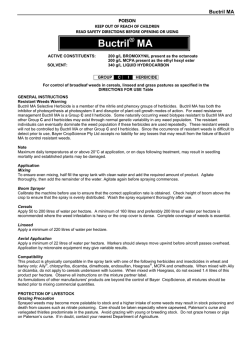
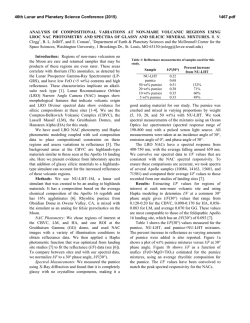
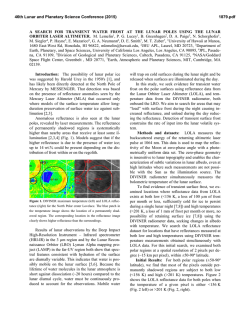
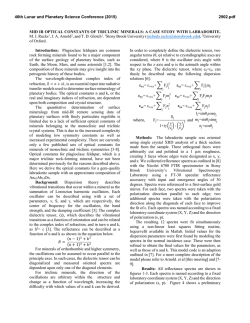
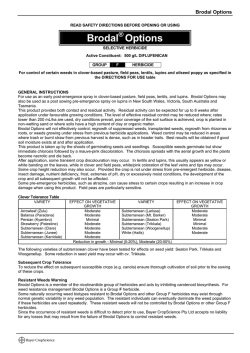
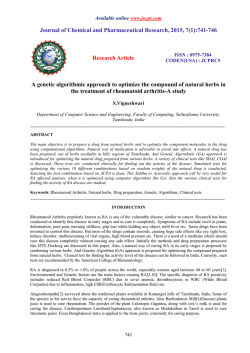
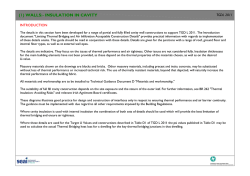
Leaf Spectral
Reflectance for
Nondestructive
Measurement of
Plant Nutrient Status
J.R. Davenport1, 2, E.M. Perry3,
N.S. Lang4, and R.G. Stevens2
ADDITIONAL INDEX WORDS. apple,
potato, grape, nitrogen, leaf, petiole,
NDVI
SUMMARY. The ability to monitor
plant nutrient status of high value
horticultural crops and to adjust
seasonal nutrient supply via fertilizer
application has economic and environmental benefits. Recent technological
advances may enable growers and field
consultants to conduct this type of
monitoring nondestructively in the
future. Using the perennial crop apple
(Malus domestica) and the annual
crop potato (Solanum tuberosum),
a hand-held leaf reflectance meter
was used to evaluate leaf nitrogen
(N) status throughout the growing
season. In potato, this meter showed
good correlation with leaf blade N
content. Both time of day and time of
season influenced leaf meter measurement, but leaf position did not. In
apple, three different leaf meters were
compared: the leaf spectral reflectance
meter and two leaf greenness meters.
Correlation with both N rate and leaf
N content were strongest for the leaf
reflectance meter early in the season
but nonsignificant late in the season,
whereas the leaf greenness meters
gave weak but significant correlations
throughout the growing season. The
tapering off of leaf reflectance values
found with the hand-held meter is
consistent with normalized difference vegetation index (NDVI) values
calculated from satellite images from
the same plots. Overall, the use of leaf
spectral reflectance shows promise as
a tool for nondestructive monitoring
1
To whom reprint requests should be addressed. E-mail:
[email protected]
2
Department of Crop and Soil Sciences, Washington
State University, 24106 N. Bunn Road, Prosser, WA
99350.
3
Center for Precision Agriculture Systems, Washington State University, 24106 N. Bunn Road, Prosser,
WA 99350.
4
Department of Horticulture, Michigan State University, A322 Plant and Soil Sciences Building, East
Lansing, MI 48824.
●
Jan2005HT.indb 31
January–March 2005 15(1)
of plant leaf status and would enable
multiple georeferenced measurements
throughout a field for differential N
management.
T
he underlying concept of using leaf spectral reflectance to
measure plant stress is based
upon the differential reflectance of light
by plants [i.e., plants generally utilize
(absorb) visible light in the blue and
red wavelengths, and reflect light in the
green and near infrared portions of the
light spectrum]. Various technologies
have been used to exploit this basic
relationship, including color infrared
film, digital cameras, multispectral
sensors on airplanes and satellites, and
hand-held sensors measuring light in
narrow wavebands (wavelength intervals). Plant reflectance measurements
through remote sensing have been
used to quantify canopy vigor (e.g.,
Peters et al., 2003; Sudbrink et al.,
2003; Wang et al., 2003) as well as
nutrient and water availability (e.g.,
Bausch and Duke, 1996; Osborne et
al., 2002). Since the early 1990s there
has been a trend toward using specific
narrow wavebands to better characterize plant stress from nutrient deficiency
and other sources. One example is the
use of narrow wavebands to measure
the so-called chlorophyll red-edge,
which defines the rapid increase in
reflectance just beyond the red spectral
region; this reflectance feature has been
shown to be highly correlated to plant
nitrogen availability (e.g., Daughtry
et al., 2000; Lamb et al., 2002; Zhao
et al., 2003).
The different technologies available provide information at different
spatial and spectral (wavelength) scales.
Hand-held spectroradiometers provide
reflectance data by wavelength, with
wavelength intervals as precise as 1 nm
(e.g., FieldSpec Pro; Analytical Spectral
Devices, Boulder, Colo.). These instruments are typically used as research
tools to develop and test methods for
specialized sensors. Some specialized
handheld sensors have been developed
as a result of reflectance monitoring
research. For example, the Field Scout
CM 1000 (Spectrum Technologies,
Plainfield, Ill.) measures reflectance in
the red and near-infrared regions and
estimates plant chlorophyll concentrations. Multispectral imaging systems
measure reflectance in the same regions
to estimate the amount of photosyn-
thetic plant matter contained in a given
pixel; for measurements over a closed
canopy these measurements would be
analogous to the handheld measurements. Commercial satellite imagery
is now available at a spatial resolution
of 10.8 ft2 (1 m2) per pixel or smaller
(Space Imaging, Inc., 2004). Satellite
imagery costs range from nominal distribution costs for public data to over
$8.09/acre ($20/ha) for commercial
sources with high levels of processing
included (e.g., map coordinates). An
eventual application of these technologies might be to combine handheldsensors for single plant measurements
with synoptic view imagery to provide
measures of variability from plant to
plant, and across entire fields.
In this paper we explore the
potential of leaf spectral reflectance
monitoring for two cases of crop characterization. Reflectance monitoring
via handheld sensors is evaluated for
assessment of N status in an annual
cropping system (potato) and a perennial system (apple). In the next section
we will describe the sensors used and
the overall approach to measurements.
We then present each of the cases
separately, describing the experimental
methods and discussing results. In
the final section, we discuss what has
been learned from these cases and the
implications for reflectance sensors in
horticulture. Relating these results to
findings from previous work, we then
examine the use of reflectance monitoring to address the spatial variability
of plant conditions, using an example
of ultraviolet (UV) light and water
stress response in juice grape (Vitis
labrusca).
Sensors used and
measurement approaches
The Minolta SPAD 502 (SPAD;
Spectrum Technologies) and the CCM
200 (OptiSciences, Tyingsboro, Mass.)
use transmittance of light through leaf
tissue at two wavelengths to estimate
chlorophyll. The sensor is attached to
the upper surface of a leaf to make a
single, simultaneous measurement of
both wavelengths. Measurements are
affected by the selection of a given
leaf within the canopy and the measurement location on the leaf surface.
For our studies, meters were attached
between the leaf mid-vine and leaf edge
with the upper leaf surface pointing
upward.
The Field Scout CM 1000 mea31
12/6/04 4:34:40 PM
WORKSHOP
sures reflected light at 700 and 840 nm
to estimate chlorophyll. The illumination source is the sun, but changing
ambient light conditions are corrected
for by the sensor. The sensor sample
area is a function of the distance between the sensor and the target. For
these studies, the sensor was positioned
about 18 inches (45.7 cm) from the
upper leaf surface, producing an effective sample diameter of approximately
1 inch (2.5 cm).
CASE 1: N AVAILABILITY IN POTATO
Methods
In 2001 and 2002 ‘Ranger Russet’
potato was planted in a Quincy fine sand
(fine, mesic, Typic Torripsamment)
near Paterson, Wash. (lat. 45°55´N,
long. 119°35´ W). Plots four rows wide
and 32 ft (9.8 m) long were established
in a randomized complete-block design, with four different total seasonal
N rates [0, 150, 300, and 400 lb/acre
(0, 168.1, 336.2, 448.3 kg·ha–1)], using urea and were replicated four times.
To be consistent with standard grower
practices in the area (Lang et al., 1999),
35% of the urea was applied as granular
material at planting and incorporated
with the planting. The remaining 65%
was applied as liquid urea in simulated
fertigation (Davenport and Bentley,
2001) across nine equal rate applications beginning at tuber initiation. All
plots were provided phosphorus (P)
and potassium (K) at rates consistent
with current standards based on soil
testing (Lang et al., 1999). Irrigation
and pest control were provided to
minimize plant stress.
Weekly, from row closure through
2 weeks preharvest, the fifth fully expanded leaf from 50 plants per plot was
collected between 0800 and 0900 HR.
Petiole tissue was analyzed for nitrate
nitrogen (NO3-N) by water extracting dried ground tissue and analyzing
colorimetrically (Mulvaney, 1996) on
an EnvironFlow-3000 (O-I Corp, College Station, Texas). In 2002 the leaf
blade tissue was also retained and dried
ground sample was analyzed for total
N using dry combustion (Bremner,
1996) on a LECO C-N–S analyzer (St.
Joseph, Mich.). Concurrent with tissue
collection, the CM 1000 was used to
measure leaf spectral reflectance on the
fifth fully expanded leaf of three plants
per plot (Lang et al., 1999).
In 2002, a companion test was
conducted on the same site to evalu32
Jan2005HT.indb 32
ate the effect of using different leaf
positions on leaf spectral reflectance
readings (leaf position test). In the
uniformly fertilized (300 lb/acre N)
border rows at the Paterson site, leaf
spectral reflectance was measured with
the CM 1000 on individual leaves from
the smallest fully expanded leaf position to the 10th leaf position (Lang et
al., 1999) on six plants (leaves 1–10,
respectively). This was done at two different times during the growing season,
mid and late season [85 and 100 d after
planting (DAP), respectively]. Tissue
sampling and analysis was conducted
as previously described.
Another test was also conducted in
2002 near Prosser, Wash. (lat. 46°15´
N, long. 119°45´W) to evaluate time
of day of sampling (time of day test).
‘Russet Burbank’ was planted on a
Warden very fine sandy loam (coarsesilty, mixed, superactive, mesic Xeric
Haplocambid), where management
practices were uniform fertilizer, irrigation, and pest control practices. Both
early and mid-season (64 and 96 DAP,
respectively), leaf spectral reflectance
was measured on three leaves (fifth
fully expanded position; Lang et al.,
1999) of 18 randomly selected plants
hourly, from 0900 to 1800 HR with
the CM 1000. Leaf blade and petiole
tissues were collected and analyzed as
previously described.
Leaf reflectance data were evaluated relative to N rate and to tissue
N concentration. Data were analyzed
using a combination of analysis of variance and regression analysis with PC
SAS PROC GLM and PROC REG
(SAS Institute, Cary, N.C.).
Results
Leaf reflectance, measured with
CM 1000, was significantly different
at the P = 0.0001 level by year, sampling time, N rate, plus the interactive
factors N rate by sampling time and
N Rate by sampling time by year. Reflectance values decreased as sampling
time (measured as DAP) increased
(Fig. 1).
Across both years, leaf reflectance
was related to petiole NO3-N (P =
0.0012); however, the r2 value was
<0.02 indicating the relationship was
not linear. Since leaf reflectance varied
significantly with year and sampling
time, leaf reflectance was regressed
against petiole NO3-N by sampling
time measured as DAP. There were
significant relationships between leaf
reflectance and petiole NO3-N at 59,
71, 106, 112, and 120 DAP. However,
linear relationships were only found
early in the growing season at 59 and
71 DAP, with r2 values of 0.28 and
0.65, respectively.
For the two tests to evaluate
potential factors that may influence
readings, the position test and time of
day test, reflectance was significantly
different by the sampling date in each
test (P = 0.0001 for both tests). Reflectance was not significantly different
for leaf position or leaf position by
sampling date interaction (P = 0.2364,
0.3758, respectively; Fig. 2). However,
leaf spectral reflectance was significantly
different for time of day (P = 0.0001,
Fig. 3) but not the interactive factor
between time of day and sampling date
(P = 0.9046).
Fig. 1. Relationship between potato leaf spectral reflectance measured with a
hand-held meter over two growing seasons and the sampling period, measured
as days after planting. The data reflect four different nitrogen (N) fertilizer
rates accounting for the wide spread in reflectance values.
●
January–March 2005 15(1)
12/6/04 4:34:40 PM
Using the combined data from
the three tests conducted at two sites
in 2002 a significant but weak linear
relationship between leaf spectral reflectance and leaf blade N content was
found (Fig. 4). The weakness of the
correlation may be due to sampling
time (Fig. 1).
CASE 2: N AVAILABILITY IN APPLE
Methods
83
Fig. 2. Average leaf spectral reflectance measurement from potato leaves in leaf
positions from the first to tenth fully expanded leaves (1–10, respectively). Error bars represent 1 SE of the mean. Measurements made mid and late during
the season [83 and 106 d after planting (DAP), respectively].
Fig. 3. Hourly leaf spectral reflectance measurements and best fit regression
lines with measurements collected on three leaves each from 18 randomly selected plants in uniformly managed potato fields early and mid-season [64 and
96 d after planting (DAP), respectively].
Fig. 4. Relationship between potato leaf spectral reflectance measured with
hand-held meter and leaf blade total nitrogen (N) from potato plants in N rate
plots and randomly chosen plants from two different uniformly managed fields
in one growing season.
●
Jan2005HT.indb 33
January–March 2005 15(1)
In Mar. 2002, plots were established in a commercial block of ‘Fuji’
apples on M9 rootstock. The orchard
rows are oriented north–south with 15
ft (4.6 m) between rows and 6 ft (1.8 m)
between plants. The site is planted on
a Winchester sand (mixed, mesic, Xeric
Torripsamment) near Mattawa, Wash.
(lat. 46°40´N, long. 119°50´W). Plots
were four rows wide × 10 trees long
with four trees between each plot, with
the center two rows (20 trees) used as
the data rows. Plots were treated with
0, 1/2, 1, and 2 times the grower’s
rate of N fertilizer, resulting in 0, 17.5,
35, and 70 lb/acre (0, 19.6, 39.2, and
78.5 kg·ha–1). Ammonium nitrate was
applied with a ground-based spreader
set up to band the N in the vegetation-free strip under the trees. Each
treatment was replicated four times in
a randomized complete-block design.
Identical fertilizer treatments were applied to the plots in Feb. 2003.
Three times during the 2002
growing season and four times during
the 2003 season, measurements were
collected using three different handheld leaf meters (HLM; SPAD, CCM
200, and CM 1000) to evaluate their
use as possible tools for assessing plant
N status. Time of season (TOS) of
measurements were grouped into three
groups, early, mid, and late season, with
early measurements in May, mid season
in June (2002, 2003) and July (2003
only), and late season in August. Measurements were collected from three
leaves each from three trees in each
plot with the leaves chose randomly
from shoots and spurs about midcanopy level. These leaves were then
collected and added to a composite
sample made up of 80 leaves, a total
of 20 leaves collected from four trees
in each plot. The leaves were returned
to the lab, dried at 140 °F (60.0 °C)
and ground. The 2002 samples have
been analyzed for total N using the
LECO C–N–S analyzer; 2003 sample
analysis is ongoing.
33
12/6/04 4:34:41 PM
WORKSHOP
Table 1. Average apple leaf meter readings measured using three different
hand-held leaf meters in plots under four different nitrogen (N) rates collected at three different sampling intervals across two growing seasons.
Satellite imagery from the Quickbird sensor (DigitalGlobe, Inc., 2004)
was acquired on a monthly basis from
Apr. to Oct. 2003. The imagery was
geometrically corrected to the same
map coordinate system used for the
ground sampling, and the pixel radiance values were converted to reflectance using measured reflectance
targets. Once this was completed, any
of several indices could be computed
from the different spectral wavelengths.
We chose to compute the NDVI since
the wavelengths used for this index
(Rouse et al., 1973) correspond to the
wavelengths used by the CM 1000.
NDVI was computed as follows:
Variablez
N rate (lb/acre)
0
17.5
35
70
TOS
Early
Mid
Late
Level of significance
N rate
TOS
N rate × TOS
NDVI = (ReflectanceNearIR
– [ReflectanceRed)
/(ReflectanceNearIR]
+ ReflectanceRed)
Results
All three HLM tested for assessing
apple leaf N status gave significantly
different leaf meter readings according
to N rate (Table 1). The CM 1000
showed more pronounced changes in
meter reading values relative to N rate
than the CCM 200 or the SPAD. There
was a significant interaction between
the effects of N rate and TOS only
for readings from the CM 1000. Leaf
meter readings differed between years
for the CCM 200 and the CM 1000
but not the SPAD meter. Only the
CM 1000 had a significant relationship
between N rate and TOS.
Leaf meter reading values were
significantly related to leaf tissue N for
all three meters. However, the r2 values
for the SPAD and CCM 200 were very
low. The interactive factor TOS and
tissue N level was significantly different for all three meters (P = 0.0003,
0.0031, 0.0095, respectively for CCM
200, SPAD, and CM 1000). Although
SPAD and CCM 200 leaf meter readings were significantly different for all
times of season, the r2 values were very
low (<0.123).
Data from georeferenced aerial
monitoring were used to calculate
34
Jan2005HT.indb 34
Leaf meter
SPADx
CM 1000w
16
17
17
20
34
35
35
37
176
182
189
200
16
18
18
33
36
36
210
180
174
0.0001
0.5949
0.7789
0.0001
0.5913
0.7776
0.0001
0.0001
0.0001
z
1.0 lb/acre = 1.12 kg·ha–1; TOS = time of season, where early = May, mid = June and July, and late =
August.
y
Minolta SPAD 502 leaf meter (Spectrum Technologies, Plainfield, Ill.)
x
CCM 200 leaf meter (OptiSciences, Tyingsboro, Mass.)
w
Field Scout CM 1000 leaf meter (Spectrum Technologies).
3HUFHQW RI 1'9, DW 1
The NDVI values for individual
pixels were grouped according to the
N treatment that they corresponded
to, and then averaged. The averaged
values were standardized by dividing
the values for the 1/2x, 1x, and 2x N
rate plots by the NDVI value for the
0% N plot for the same imagery.
CCM 200y
OE$ 1
OE$ 1
OE$ 1
OE$ 1
$SULO
DSU
0D\
PD\
-XQH
MXQH
-XO\
MXO
$XJXVW
DXJ
6HSWHPEHU
VHS
0RQWK
Fig. 5. Average normalized difference vegetation index (NDVI) calculated from
satellite imagery of an apple orchard. The treatments represent nitrogen fertilizer rates applied in one spring dormant application (1 lb/acre = 1.12 kg·ha–1).
several different indices. The leaf
reflectance spectra used by the CM
1000 are the same wavelengths used
to calculate the normalized difference
vegetation index (NDVI). Throughout
the season, NDVI for plots with different N rates showed a similar pattern to
the leaf meter readings obtained with
the CM 1000. The effect of N rate was
greater earlier in the season than later
in the season (Fig. 5).
Discussion
Results from both the potato
and apple experiments indicate that
hand-held leaf reflectance meters have
potential to assess plant nitrogen status. Preliminary work in wine grape
(Vitis vinifera) further confirms this
with measurements made in the first
growing season showing significant
correlations with N fertilizer rates (data
not given).
Comparisons among the handheld leaf meters suggest that each
meter can measure plant N status.
There was a decline in meter reading
values during the season with the CM
1000 that was not found with the other
meters despite the fact that leaf tissue
N declined during the growing season.
Both the SPAD and CCM 200 measure
leaf greenness using light transmission
whereas the CM 1000 actually measures leaf spectral reflectance. A study
evaluating the SPAD meters relative to
leaf N and chlorophyll status has found
stronger correlation between meter
●
January–March 2005 15(1)
12/6/04 4:34:45 PM
readings and leaf chlorophyll than leaf
N (Loh et al., 2002). Research in wheat
(Triticum aestivum) showed promise
for developing a relationship between
SPAD meter readings and flag leaf N
concentration (Follett et al., 1992),
yet later work found year to year and
site to site variability was large enough
that on-site N rate reference plots were
required for calibration (Westcott et al.,
1997). The lack of significant relationships between leaf meter readings and
the interactive factor N rate and TOS
for the SPAD and CCM 200 suggest
that the leaf meter readings are more
responsive across the season to a factor
other than N (e.g., chlorophyll concentration), since leaf tissue data shows that
N concentration does decrease with
TOS. This is further supported by the
decline in canopy NDVI response to
N with TOS in aerial imagery.
In both crops, CM 1000 leaf
reflectance values showed changes
with time of season and, by the last
measurements, were not very effective as an indication of the relative leaf
N concentration. It is likely that this
reflects the redistribution of N later in
the season from leaves to other organs
(e.g., tubers in potato, roots and wood
in apple), reducing differences in leaf
tissue concentrations as a factor of the
rate of N application/availability during the growing season.
One of the potential advantages
of a hand-held reflectance meter is that
it can be used in different locations
within a given field to direct differential
fertilizer application needs. Although
we have not conducted this type of
work directly with potato or apple, leaf
reflectance analysis has been used in
juice grape to monitor the development
of water and UV light stress response
across entire fields (Lang et al., 2000).
This approach is an ideal model for
collecting leaf reflectance measurements with hand-held meters and GPS
technology to enable the development
of both spatial and temporal maps of
N need in fields.
Conclusions
Progress has been made in nondestructive measurement of plant N
status. However, other stresses can influence the effectiveness of this technology. For example, water stress can cause
a shift in leaf reflectance wavelengths
that could reduce the effectiveness of
the technique (Davenport et al., 2000).
In addition, these measurements need
●
Jan2005HT.indb 35
January–March 2005 15(1)
to be taken with full sunlight and are
somewhat sensitive to the time of day
the measurement is made (Fig. 3). It
is relatively easy to remember to take
measurements at a specific time of day
across one growing season but may
be more challenging to do so from
year to year. Cloudless, sunny days
are frequent in the area this research
was conducted in but the lack of such
climatic conditions may be limiting in
some locations.
Leaf spectral reflectance may not
be suitable for measurement of nutrient stresses other than N. Stresses,
such as iron deficiency, that lead to
leaf chlorosis may have potential for
early detection with leaf greenness
meters like the SPAD or CCM 200
but such measurement would not
likely be nutrient specific. Overall, this
work suggests that specific wavelength
leaf spectral reflectance meters could
be developed for plant N status but
guidelines for use would be specific
for crop and time of season.
Literature cited
Bausch, W.C. and H.R. Duke. 1996. Remote
sensing of plant nitrogen status in corn. Trans.
Amer. Soc. Agr. Eng. 39:1869–1875.
Bremner, J.M. 1996. Nitrogen—Total, p.
1085–1122. In: J.M. Bigham (ed.). Methods
of soil analysis. Part 3: Chemical methods.
SSSA Book Ser. No. 5. SSSA/ASA Press,
Madison, Wis.
Daughtry, C.S.T., C.L. Walthall, M.S. Kim,
E.B. de Colstoun, and J.E. McMurtre. 2000.
Estimating corn leaf chlorophyll concentration from leaf and canopy reflectance. Remote
Sensing Environ. 74:229–239.
Davenport, J.R. and E.M. Bentley. 2001.
Does potassium fertilizer form, source and
time of application influence potato yield
and quality in the Columbia Basin? Amer. J.
Potato Res. 78:311–318.
Davenport, J.R., N.S. Lang, and E.M. Perry.
2000. Leaf spectral reflectance for early detection of disorders in model annual and perennial crops. CD ROM Paper No. 62. In: P.C.
Robert (ed.). Proc. 5th Intl. Conf. Precision
Agr., 16–19 July 2000, Minneapolis.
DigitalGlobe, Inc. 2004. Basic imagery. 26
Apr. 2004. <http://www.digitalglobe.com/
product/basic_imagery.shtml>.
Follett, R.H., R.F. Follett, and A.D.
Halvorson. 1992. Use of chlorophyll meter
to evaluate the nitrogen status of dryland
winter wheat. Commun. Soil Sci. Plant Anal.
23:687–697.
Lamb, D.W., M. Steyn-Ross, P. Schaare,
M.M. Hanna, W. Silvester, and A. Steyn-Ross.
2002. Estimating leaf nitrogen concentration
in ryegrass (Lolium spp.) pasture using the
chlorophyll red-edge: theoretical modelling
and experimental observations. Intl. J. Remote Sensing. 23:3619–3648.
Lang, N.S, J. Silbernagel, E.M. Perry, R.
Smithyman, L. Mills, and R.L. Wample. 2000.
Remote image and leaf reflectance analysis to
evaluate the impact of environmental stress on
grape canopy metabolism. HortTechnology
10:468–474.
Lang, N.S., R.G. Stevens, R.E. Thornton,
W.L. Pan, and S. Victory. 1999. Potato nutrient management in central Washington.
Washington State Univ. Ext. Bul. 1871.
Loh, F.C.W, J.C. Grabosky, and N.L. Bassuk.
2002. Using the SPAD 502 meter to assess
chlorophyl and nitrogen contetn of Benjamin
fig and cottonwood leaves. HortTechnology
12:682–686.
Mulvaney, R.L. 1996. Nitrogen—Inorganic
forms, p. 1123–1200. In: J.M. Bigham (ed.).
Methods of soil analysis. Part 3: Chemical
methods. SSSA Book Ser. No. 5. SSSA/ASA,
Madison, Wis.
Osborne, S.L., J.S. Schepers, D.D. Francis,
and M.R. Schlemmer. 2002. Detection of
phosphorus and nitrogen deficiencies in corn
using spectral radiance measurements. Agron.
J. 94:1215–1221.
Peters, A.J., L. Ji, and E. Walter-Shea. 2003.
Southeastern US vegetation response to
ENSO events (1989–1999). Climatic Change
60:175–188.
Rouse, J.W., R.H. Haas, J.A. Schell, and
D.W. Deering. 1973. Monitoring vegetation
systems in the Great Plains with ERTS. Proc.
3rd ERTS Symp. 1:42–62
Space Imaging, Inc. 2004. Images from space.
26 Apr. 2004. <http://www.spaceimaging.
com>.
Sudbrink, D.L., F.A. Harris, J.T. Robbins,
P.J. English, and J.L. Willers. 2003. Evaluation of remote sensing to identify variability
in cotton plant growth and correlation with
larval densities of beet armyworm and cabbage looper (Lepidoptera : Noctuidae) Fla.
Entomol. 86:290–294.
Wang, J, P.M. Rich, and K.P. Price. 2003.
Temporal responses of NDVI to precipitation and temperature in the central Great
Plains, USA. Intl. J. Remote Sensing.
24:2345–2364.
Westcott, M., J. Eckhoff, R. Engel, J. Jacobsen, G. Jackson, and B. Stougaard. 1997.
Rapid diagnosis of grain protein response to
late-season nitrogen in irrigated wheat. In:
T.A. Tindall and D. Westermann (eds.). Proc.
Western Nutrient Mgt. Conf. 2:77–81.
Zhao, D.L., K.R. Reddy, V.G. Kakani, J.J
Read, and G.A. Carter. 2003. Corn (Zea
mays L.) growth, leaf pigment concentration, photosynthesis and leaf hyperspectral
reflectance properties as affected by nitrogen
supply. Plant Soil 257:205–217.
35
12/6/04 4:34:45 PM
© Copyright 2026