
SELECT MSL SAMPLE ANALYSIS AT MARS (SAM) - USRA
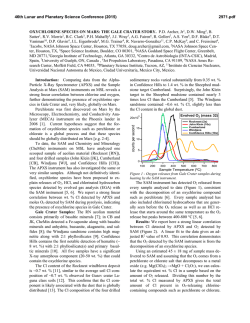
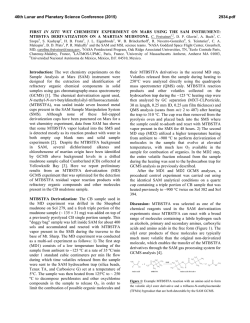
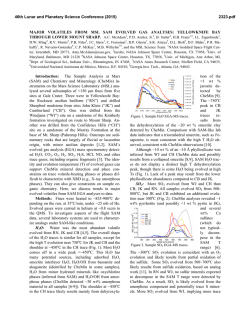
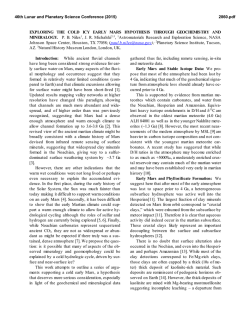
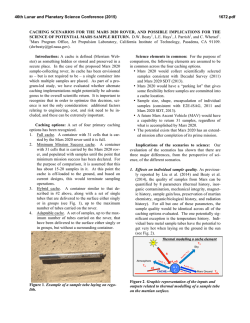
46th Lunar and Planetary Science Conference (2015)
2558.pdf
SELECT MSL SAMPLE ANALYSIS AT MARS (SAM) TESTBED ANALOG STUDIES. C. A. Malespin1,2,
A. C. McAdam1, J. C. Stern1, C. Webster3, G. Flesch3, D. P. Glavin1, P. R. Mahaffy1, S. Teinturier1,2, C. Freissinet1,
B. Prats1, M. Johnson1, E. Raaen1, D. P. Archer4, J. Eigenbrode1, and H. Franz1 1NASA Goddard Space Flight Center, Code 699, Greenbelt, MD, 20771 [email protected] , 2Goddard Earth Science Technology and Research, Universites Space Research Association, Columbia, MD, 3NASA Jet Propulsion Lab, Pasadena, CA 91109, 4
Jacobs, NASA Johnson Space Flight Center, Houston, TX 77058
Introduction: The Sample Analysis at Mars
(SAM) Testbed (TB) instrument suite is a duplicate of
the Flight (FM) version currently onboard the Curiosity rover in Gale Crater, Mars. A detailed description of
the SAM instrument can be found in [1]. The TB is
operated in the NASA Goddard Space Flight Center
Mars environmental chamber, Figure 1, which was
designed to replicate the thermal and atmospheric conditions at Gale Crater. The primary use of the TB is to
develop and validate new and modified experimental
procedures to be used on the FM. TB experiments are
performed multiple times to ensure safe operation on
Mars, as well as to optimize parameters for maximum
science return. The TB is also used to analyze Mars
analog materials under conditions as similar to those in
the SAM FM runs as possible. Mars analog samples
are first analyzed using one or more benchtop laboratory systems configured to run under SAM-like conditions. The results of these experiments allow the SAM
team to narrow down which samples will be analyzed
in the more resource intenstive SAM Testbed, the
highest fidelity SAM-like system. These TB analog
sample runs may have science or calibration (e.g.,
sample temperature calibration) rationales.
maximum sample temperature of ~900°C, under an He
carrier gas flowing at ~0.8 sccm. These conditions
result in pressures of ~25 mb in the sample pyrolysis
oven. Evolved volatiles can be detected by their massto-charge ratio (m/z) by the mass spectrometer (EGA
mode), and can also be directed over a hydrocarbon
trap for later analysis in gas chromatography mass
spectrometry (GCMS) mode, or directed into the tunable laser spectrometer (TLS) for isotopic analysis.
SAM experimental details and methods used are described in further detail in [1,3].
One difference of note between the TB and FM instruments is that the TB TLS exhibits more optical
fringes than the FM unit, which reduces its precision
and accuracy compared to the FM.
Griffith Fe-saponite analog: Griffith saponite is
thought to be a close terrestrial analog to the smectite
clay mineral detected in the Sheepbed mudstone by the
MSL CheMin and SAM instruments [e.g. 4,5]. A 10.2
mg sample of Griffith saponite was loaded into the
SAM TB for analysis.
H2O evolution during the run is illustrated in Figure 2, which shows the m/z 17 EGA trace. Isotopic
composition (δD and δ18O) of the high temperature
H2O, which results from dehydroxylation of the smectite, were obtained using the TLS. The TLS was given
a temperature “cut” of the gas evolved from 600° C to
900° C during the pyrolysis ramp. TLS measured a δD
of -104 ± 88‰, similar to values obtained by
IRMS(Table 1).
Figure 1. SAM TB inside the Mars environment chamber at
NASA GSFC. The chamber was used for both FM and TB verification and testing.
Preliminary results from three analog samples of
interest are presented here: a griffith saponite clay
mineral sample, a SAM calcite calibration cup, and a
mixture of Fe3+ oxalate hexahydrate [2] and a NIST
calcite isotope standard.
Methods: The TB uses the same quartz cups
found in the FM, but for ease of sample loading and
removal, samples are loaded into a smaller nickel cup
which is placed inside the TB quartz cup. Samples are
then heated up using a ramp rate of 35°C/minute to a
Figure 2. EGA trace illustrating the H2O evolved from a Griffith
saponite sample analyzed on the SAM Testbed. The highest temperature H2O peak, occurring at ~730 °C, is the result of dehydroxylation of the smectite.
Calibration Calcite cup: Calibration cups are
loaded in both the FM and TB as described in [1]. The-
46th Lunar and Planetary Science Conference (2015)
se cups contain both inorganic (calcite) and organic
carbon-bearing materials, and are used to calibrate the
evolution temperatures and abundances of CO2 and
other mass fragments associated with organics. The
cups are punctured in situ and run in EGA-GCMS-TLS
mode with a low temperature cut of 20° - 200° C sent
to the hydrocarbon trap for GCMS, and the gas from
the remainder of the temperature ramp sent to the TLS.
Two cups with 3.6 mg and 3.7 mg calcite, respectively, mixed into 121.6 mg fused silica and spiked
with 5.1 nmol each of 3-fluorophenanthrene (3-FP)
and 1-fluoronapthelene (1-FN) were run on the SAM
TB. The evolved CO2 peaks for both samples are
shown in Figure 3.
The thermal decomposition of the calcite is clearly
seen in both samples, resulting in the ~750 °C peak in
the m/z 45 trace (the m/z 45 signal from the 13CO2
isotopologue is plotted instead of the main mass of
CO2 because the m/z 44 signal is saturated). TLS
measured δ13C of -25 ± 10‰, which is comparable to
the value of -16.5‰ obtained by ground isotope ratio
mass spectrometer (IRMS) analysis (Table 1). These
TB results can be used as a reference for runs of the
calcite calibration standard on the FM to be performed
in the near future.
2558.pdf
ty, SAM-like systems. The peaks near 200 °C and 400
°C result from the oxalate and the peaks near 700 °C
result from the calcite. The CO2/CO ratio resulting
from the oxalate decarboxylation near 400° C differs
from that for the ~700 °C peak resulting from calcite
thermal decomposition.
Figure 4. EGA m/z 29 and 45 traces, illustrating the signal from the
13
CO and 13CO2 isotopologues respectively. The TLS cut aimed to
capture the high temperature gas release from the NIST calcite.
Summary: The TB is a high fidelity replica of the
FM, which provides insight to the FM data and can be
calibrated to well understood reference materials. SAM
TB TLS and EGA data agree well with runs on other
SAM-like laboratory systems or other ground truth
measurements,,as shown in Table 1 for TLS data. A
larger set of analog data will be reported in a future
manuscript.
Sample
(gas)
Figure 3. m/z 45 traces for two SAM Testbed EGA analyses of
calcite
showing
the
CO2
evolved
during
calcite
decomposition. Blue is 3.6 mg, red is 3.7 mg calcite sample
thermal
NIST calcite standard and Fe3+ oxalate mixture:
A mixture of 1.99 mg of NBS-19 carbonate NIST
isotope standard and 2.4 mg of Fe3+ oxalate
hexahydrate was run on the TB in EGA mode with a
650-950° C TLS cut for isotopic analysis.
The TLS cut targeted capture of the CO2 from the
calcite, while avoiding CO2 from the oxalate thermal
decomposition. TLS provides a δ13C value of -18 ±
5‰, and a δ18O value of 20 ± 6‰, which compares to
the NIST δ13C value of 1.95‰ and δ18O of 28.7‰
(Table 1).
EGA CO (m/z 29) and CO2 (m/z 45) traces are
shown in Figure 4. The peaks in these traces occur at
the temperatures expected for thermal decomposition
of these materials based on runs on other, lower fideli-
SAM
calcite
(CO2)
NBS19
calcite
(CO2)
Griffith
saponite
(H2O)
TLS
IRMS
TLS
IRMS
δ13CVPDB
-25 ± 10
δ13CVPDB
-16.5± 0.3
δ18OVSMOW
-11 ± 8
δ18OVSMOW
10.1 ± 0.4
-18 ± 5
1.95
(NIST)
20 ± 6
28.7 (NIST)
δDVSMOW
-104 ± 88
δDVSMOW
-118 ± 1
δ18OVSMOW
18 ± 26
δ18OVSMOW
TBD
Table 1. Summary of preliminary TLS isotope ratio measurements
in evolved CO2 and H2O compared to IRMS lab measurements. The
quoted errors are 2 standard error from the mean (2SEM).
References: [1] Mahaffy, P.R. et al (2012) Space Sci
Rev. 170, 401-478. [2] Eigenbrode, E. L. et al. (2014)
LPSC XLV [3] Glavin, D. et al. (2013) JGR, 118,
1955-1973. [4] Trieman et al (2014) Am. Min., 99, 1112, 2234-2250. [5] McAdam et al. (2014), in prep.
Acknowledgments We thank the SAM science and
operations teams.

© Copyright 2026