
in-situ lunar phase curves extracted from imageries measured by
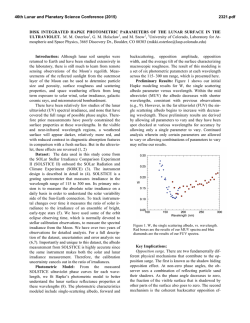
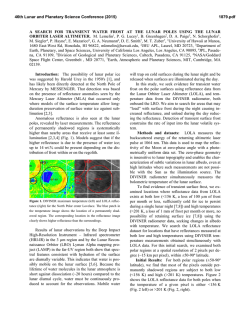
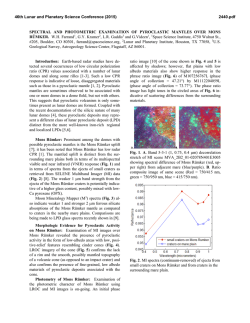
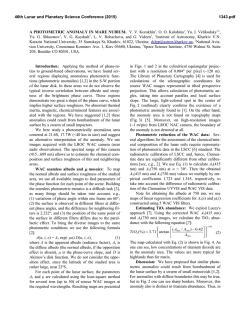
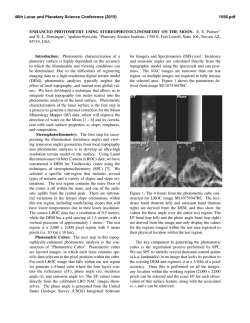
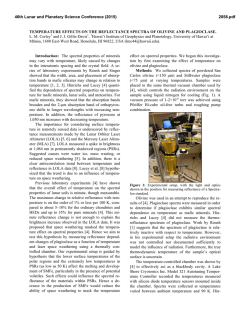
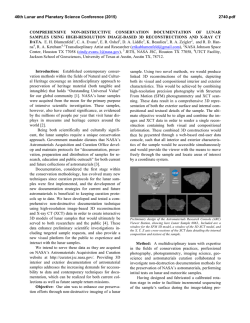
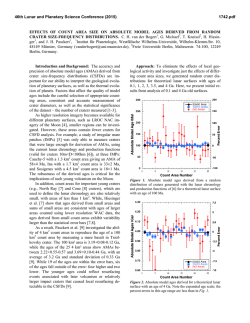
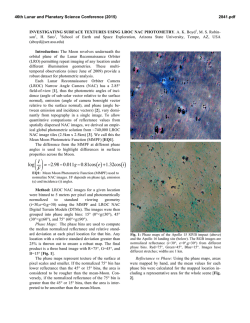
46th Lunar and Planetary Science Conference (2015)
2909.pdf
IN-SITU LUNAR PHASE CURVES EXTRACTED FROM IMAGERIES MEASURED BY PANORAMA
CAMERAS ONBOARD THE YUTU ROVER OF CHANG’E 3 MISSION. Weidong Jin1, Hao Zhang1, Ye
Yuan1, Kaichang Di2, Wenhui Wan2, Bin Xu2, Bin Xue3, Yazhou Yang1, Long Xiao1, and Ziwei Wang1, 1School of
Earth Sciences, China University of Geosciences, Wuhan, China ([email protected] ), 2State Key Laboratory of
Remote Sensing Science, Institute of Remote Sensing and Digital Earth, Chinese Academy of Sciences, Beijing,
China, 3Xi'an Institute of Optics and Precision Mechanics, Chinese Academy of Sciences, Xi’an, China.
Introduction: Although the Yutu Rover suffered a
premature failure shortly after its deployment, its onboard panorama cameras have captured hundreds of
pictures of local lunar landscapes near Chang’E 3’s
landing site in Mare Imbrium [1]. Lunar opposition
effect can be clearly identified in at least two sets of
these imageries. The lunar opposition is believed to be
caused by both shadow hiding (SH) (single scattering)
and coherent backscattering (CBS) (multiple scattering) and is closely related to the physical conditions of
the regolith grains including particle size distribution,
grain transparency and packing structures [2-4]. Various photometric models have been developed in an
attempt to quantitatively retrieve these information
from measured phase curves [2, 4]. During the last two
decades, the revive of lunar space missions has made
many phase curve measurements from space available
such as the Clementine [5], the LRO [6] and the M3
missions [7]. The successful deployment of the Yutu
Rover in Mare Imbrium, however, has provided a
unique opportunity to measure the lunar phase curve
in-situ since the Apollo era. Here we present our preliminary results in phase curve extractions and photometric analysis.
Instrument and Data Descriptions: The starting
data used in this work is the level 2B images measured
by the panorama cameras (PCAMs) as shown in Fig. 1.
The L2B data products were obtained after performing
dark current subtractions and flat fielding corrections
using calibration matrices measured in pre-flight
ground experiments. Each frame of the product contains 2352 by 1728 pixels and consists of 3 color
bands: red (640 nm), green (540 nm) and blue (470 nm)
[8]. In addition, information including gain, exposure
time, geometric information (solar zenith angle, solar
azimuth angle, inner and exterior orientation elements)
are provided in the head files of the L2B data. The gain,
exposure time and the absolute radiation calibration
coefficients are used to transform the L2B data in digital numbers to radiance values. Then reflectance is
obtained by using solar spectral irradiance data. To
extract the phase curve from these imageries, we calculate the phase angle of each pixel using photogrammetry method. By averaging the reflectance values of
pixels within 1° phase angle range, the final phase
curve can be obtained.
Figure 2 shows a typical mosaic with strong opposition surge. The accurate extraction of the phase curve
and photometric analysis would require that the terrain
is flat and homogeneous. Indeed, the digital elevation
map as measured by the landing camera shows that the
region is quite flat, as shown in Fig. 3. In addition,
pixels containing resolvable fragments and tiny craters
are excluded in the phase curve extractions to ensure
the homogeneity of the sample lunar surface.
Fig. 1. Schematics of the arrangement of panorama cameras
(PCAMs) and navigation cameras (NAAMs) on top of the
rover mast. From left to right are NAAM1, PCAM1,
NAAM2 and PCAM2, respectively. (www.ifeng.com)
B
A
C
Fig. 2. A typical lunar opposition surge captured by the left
PCAM shown in Fig. 1. Three tiny craters indicated are used
to identify the study area and correspond to the 3 craters
captured by the landing camera as shown in Fig. 3. This
image is a stitch of 12 images taken by the left PCAM.
C
B
A
46th Lunar and Planetary Science Conference (2015)
Fig. 3. Digital Elevation Map (DEM) of the study area measured by the landing camera. The 3 circled craters correspond
to the 3 craters shown in Fig. 2.
Results and discussions: The extracted phase
curves for red pixels (~640 nm) as shown in Fig. 4 are
presented in two forms: reduced reflectance (Fig. 4(a))
and normalized reflectance (Fig. 4(b)). The reduced
reflectance or reflectance can be used in Hapke model
inversion while the normalized reflectance is the input
of Shkuratov et al. model [2]. The short distance between the PCAMs and the lunar surface (~2 meters)
has made most data points below 2° phase angle
masked by camera shadows. For this reason we normalized phase curve to reflectance value at 2° phase
angle to obtain the normalized reflectance. Extrapolation to 0° phase angle using the Apollo in-situ data [9]
has shown that the truncation at 2° phase angle does
not incur significant changes on photometric inversion
results.
The phase curves show a non-linear surge toward
the opposition below 10° phase angle and flatten out
above 100°. This flattening appears to be the actual
phase curve measured instead of instrument artifact as
we have employed two different methods to calibrate
the reflectance and consistent results can be obtained.
2909.pdf
(backscattering term) and c (forward scattering term),
SH amplitude BS0 and hS, CBS amplitude BC0 and hC.
We did not consider the surface roughness term in the
present study as this region is rather flat (as evidenced
by the DEM shown in Fig. 3). In contrast, the Shkuratov et al.’s model only has 4 parameters: C controlling
the overall amplitude of the phase curve, the coefficient k related to surface albedo, L the characteristic
scale of light diffusing in the medium and d the size of
the scattering volume.
The non-linear least-squares fitting for the two
models have produced the following preliminary results: ϖ0=0.39, b=0.33, c=0.60, BS0=0.74, hS =0.057,
BC0=0.50, and hC =0.18 for the Hapke model and
C=1.1, k=0.62, L=1.70, and d=0 for Shkuratov et al.’s
model. These results show several interesting features:
(1) compared with space-borne measurements made in
lunar highland area [6], the CE3 landing site has grains
with a rather high ϖ0 value; (2) the scattering unit responsible for the opposition is very tiny (submicroscopic), as revealed by the parameter d in the Shkuratov et al.’s model and the large value of hC in the
Hapke model; (3) the measured phase curve has both a
backscattering and forward scattering component. Currently we are further validating the extracted phase
curves by employing multiple calibration methods and
more detailed results together with spectral data results
[10] will appear in a forthcoming paper.
References: [1] Xiao L. et al. (2015) Science, revision submitted. [2] Shkuratov Y. et al. (1999) Icarus,
141, 132-155. [3] Shkuratov Y. et al. (2011) PSS, 59,
1326-1371. [4] Hapke B. (2012) Theory Refl. & Emitt.
Spectroscopy, Cambridge. [5] Buratti et al. (1996) Icarus 124, 490-499. [6] Hapke B. et al. (2012) JGR, 117,
E00H15. [7] Kaydash et al. (2013) JGR, 118, 12211232. [8] Ren X. (2014) RAA 14, 1557-1566. [9] Pohn
H. et al. (1969) ApJ 157, L193-L195. [10] Zhang H. et
al. (2014) AAS DPS #46, #205.04
Acknowledgements: We thank Y. Shkuratov for
helpful discussions and the CE3 payload team for making the data available. This work was supported in part
by NSFC grants (41271229 and 41276180).
Fig. 4. Phase curves extracted from the PCAM imageries
and the fitting results of 2 photometric models: (a) Hapke’s
7-parameter model, (b) Shkuratov et al.’s photometric model.
The Hapke model used in this study includes 7 parameters [6]: single scattering albedo ϖ0, a two-term
Heyen-Greenstein phase function with parameters b


© Copyright 2026