CURRENT ECONOMIC INDICATORS — CANADA
CURRENT ECONOMIC INDICATORS — CANADA
January 30, 2015
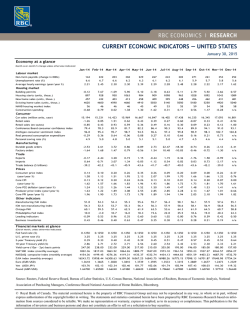
Economy at a glance
Month-over-month % change unless otherwise indicated
Jan-14
0.24
0.80
Feb-14
0.34
1.45
Mar-14
0.13
0.19
Apr-14
0.17
-0.29
May-14
0.54
0.78
Jun-14
0.33
0.97
Jul-14
0.08
-0.42
Aug-14
-0.06
-1.03
Sep-14
0.43
1.24
Oct-14
0.35
0.59
Nov-14
-0.23
-1.23
Dec-14
n/a
n/a
Employment (change in 000s)
Employment
Unemployment rate (%)
29.1
0.16
7.0
-3.3
-0.02
7.1
20.5
0.12
7.0
-20.7
-0.12
7.0
5.7
0.03
7.0
9.8
0.06
7.0
21.3
0.12
7.0
-19.9
-0.11
7.0
44.2
0.25
6.9
62.2
0.35
6.6
-16.3
-0.09
6.7
-11.3
-0.06
6.7
Average hourly wages (permanent, year/year %)
2.16
2.40
2.19
1.82
1.66
1.53
2.18
2.05
1.92
1.64
1.36
2.12
176.919
1.47
192.422
1.46
157.278
1.55
195.669
1.55
196.402
1.55
197.120
1.55
203.301
1.36
196.015
1.54
197.029
1.63
181.831
1.63
192.911
1.72
180.332
n/a
Existing home sales (000s)
37.0
37.2
37.5
38.5
41.0
41.2
41.5
42.3
41.8
41.9
41.8
39.4
Average prices ( year/year %)
9.53
9.99
6.09
7.68
7.18
7.03
5.03
5.29
5.79
7.13
5.68
3.82
Motor vehicle sales
All trade groups
1.07
0.98
0.72
0.78
-0.35
0.07
4.71
1.37
2.93
0.79
-2.28
1.15
8.85
0.00
-2.05
-0.21
2.71
0.85
-2.41
-0.04
-3.11
0.43
n/a
n/a
Real retail sales
1.00
0.30
0.00
1.04
0.57
0.58
0.16
0.01
0.94
0.03
0.75
n/a
0.30
2.87
4.46
1.67
0.86
15.34
0.15
0.16
-0.89
0.10
0.72
0.51
1.71
-1.38
-0.28
1.07
0.56
-0.31
2.51
0.18
0.29
-3.48
-0.66
-0.14
2.02
-0.47
1.25
-1.10
0.44
0.42
-1.43
-0.08
0.25
n/a
n/a
n/a
-292.2
-0.3
0.01
-0.59
835.1
0.8
5.69
2.96
985.8
1.0
1.67
0.89
-118.9
-0.1
-2.88
1.20
478.7
0.5
4.43
2.17
1881.8
1.9
0.16
-2.60
2013.6
2.0
1.41
0.44
531.6
0.5
-2.50
3.08
307.5
0.3
1.14
-1.50
99.1
0.1
n/a
n/a
n/a
n/a
n/a
n/a
n/a
n/a
n/a
n/a
0.33
1.48
0.25
1.42
2.41
0.43
0.81
1.14
0.66
1.24
2.19
4.16
0.56
1.55
0.33
1.32
3.02
6.64
0.32
2.04
0.16
1.40
3.79
9.28
0.48
2.28
0.49
1.73
3.24
7.87
0.08
2.36
-0.08
1.82
3.04
9.39
-0.16
2.11
-0.08
1.74
2.86
2.50
0.00
2.11
0.49
2.06
2.57
-0.66
0.08
2.03
0.24
2.14
2.58
-1.26
0.08
2.36
0.32
2.30
2.41
-2.17
-0.40
1.95
-0.24
2.14
1.94
-3.98
-0.72
1.47
-0.32
2.23
n/a
n/a
1.28
0.63
53.6
8.06
1.28
1.29
57.8
-11.26
1.28
-0.04
61.8
-3.22
1.33
1.30
51.1
2.20
1.33
2.35
52.2
15.37
1.38
0.95
49.7
16.38
1.38
-0.03
50.4
11.57
1.38
0.04
49.1
-27.29
1.38
1.82
65.2
12.46
1.33
0.09
54.2
2.13
1.28
-0.26
49.2
-13.80
n/a
n/a
46.7
n/a
1.00
3.00
1.1138
13694.94
1244.27
94.640
0.96
2.36
140.0
1.00
3.00
1.1074
14209.59
1299.58
100.820
1.00
2.44
144.0
1.00
3.00
1.1055
14335.31
1336.08
100.800
1.06
2.45
139.0
1.00
3.00
1.0960
14651.87
1298.45
102.070
1.06
2.40
134.0
1.00
3.00
1.0842
14604.16
1288.74
102.110
1.04
2.22
118.0
1.00
3.00
1.0670
15146.01
1279.10
105.790
1.11
2.26
115.0
1.00
3.00
1.0904
15330.74
1310.59
103.590
1.10
2.16
106.0
1.00
3.00
1.0873
15625.73
1295.23
96.540
1.10
2.00
90.0
1.00
3.00
1.1200
14960.51
1236.56
93.210
1.14
2.20
106.0
1.00
3.00
1.1271
14613.32
1222.49
84.370
1.04
2.05
101.0
1.00
3.00
1.1440
14744.70
1175.33
75.790
1.00
1.93
93.0
1.00
3.00
1.1601
14632.44
1200.94
59.280
1.01
1.79
78.0
Real GDP
Industrial production
Labour market
Housing market
Housing starts (000s)
New housing price index (year/year %)
Consumer
Manufacturing
Manufacturing shipments
Inventories
Unfilled orders
Trade
Trade balance ($ billions)
Exports
Imports
Prices
Consumer price index
(year/year %)
Core CPI, BoC measure
(year/year %)
Industrial product price index (year/year %)
Raw materials price index (year/year %)
Other indicators
Leading indicator (Index to 2007)
Wholesale trade
Ivey purchasing managers index
Building permits (residential and non-residential)
Financial markets at a glance
(End of month, unless otherwise indicated)
Overnight rate (%)
Canadian prime rate (%)
Canadian dollar spot (CAD per US$)
S&P TSX (monthly average)
Gold prices (US$ per ounce; monthly average)
WTI crude oil (US$ per barrel; monthly average)
2yr bond yield (%)
10-year bond yield (%)
Yield curve (10yr-2yr) basis points
Source: Reuters, Statistics Canada, Bank of Canada, Canada Mortgage & Housing Corporation, Canadian Real Estate Association, Richard Ivey School of Business
© Royal Bank of Canada. The material contained herein is the property of RBC Financial Group and may not be reproduced in any way, in whole or in part, without
express authorization of the copyright holder in writing. The statements and statistics contained herein have been prepared by RBC Economics Research based on information from sources considered to be reliable. We make no representation or warranty, express or implied, as to its accuracy or completeness. This publication is for the
information of investors and business persons and does not constitute an offer to sell or a solicitation to buy securities.
© Copyright 2026
