CURRENT TRENDS UPDATE — CANADA
CURRENT TRENDS UPDATE — CANADA
Overview and highlights
Update - January 30, 2015
Canadian GDP fell 0.2% in November
Real GDP
% change, month-over-month
Latest available: November
Release date: January 30, 2015
0.8
0.6
0.4
0.2
0.0
-0.2
-0.4
-0.6
-0.8
-1.0
-1.2
-1.4
-1.6
2007
2008
2009
2010
2011
2012
2013
2014
Sourc e: Statistics Canada
Canada’s November 2014 GDP fell by 0.2% following solid increases in both
September and October. Market expectations had been for an unchanged reading. Large declines in manufacturing (-1.9%) and mining, oil and gas extraction (-1.5%) pushed output in the goods-producing sectors of the economy
down by 0.8% in November. This followed gains of 0.5% in October and
0.9% in September. The service-producing sectors recorded unchanged output
in the month, with seven of the 15 industries posting declines. The largest percentage declines were in wholesale trade, accommodation and food services,
and transportation and warehousing. Increased output from retail, management
services, and arts and entertainment served to offset the decreases. Finance and
insurance posted a 0.4% dip following five months of gains. Real GDP output
was 1.9% higher than in November 2013.
▲ Canada’s November 2014 GDP fell by 0.2%
following solid increases in both September and
October.
▲ Employment dipped marginally in December
by 4,300 following on November's 10,700 decline but only denting the quarter's increase
which still stood at 28,100.
▲ On a volumes basis, overall retail sales in November rose by a robust 0.8% after unchanged
activity in October.
▲ Housing starts fell by 6.5% to an annualized
180,600 in December 2014 from a revised
193,200 in November (was 195,000).
▲ The Canadian merchandise balance deteriorated to a $0.6 billion deficit in November from
a downwardly revised $0.3 billion shortfall
(previously a $0.1 billion surplus) in October.
▲ Canada’s headline consumer price index fell by
0.7% in December 2014, thereby reflecting a 5.0%
drop in energy prices, which was a larger decline
than market expectations for a 0.6% decline.
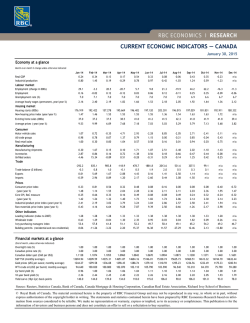
Economy at a glance
Real GDP
Industrial production
Employment
Unemployment rate*
Manufacturing
Production
Employment
Shipments
New orders
Inventories
Retail sales
Car sales
Housing starts (000s)*
Exports
Imports
Trade balance ($billlions)*
Consumer prices
% change from
Lastest month
Previous
month
Year ago
Nov
Nov
Dec
Dec
-0.2
-1.2
-0.1
6.7
1.9
2.1
0.7
7.2
Nov
Dec
Nov
Nov
Nov
Nov
Nov
Dec
Nov
Nov
Nov
Dec
-1.9
-0.3
-1.4
-1.7
-0.1
0.4
-3.1
180.3
-3.5
-2.7
-0.6
-0.7
1.3
-0.8
2.6
2.9
2.9
4.8
4.3
187.5
8.4
6.2
-1.4
1.5
* Levels are shown for the latest period and the same period a year earlier.
Canadian employment slipped and unemployment rate
steady in December
Employment
Change in thousands, month-over-month
150
Latest available: December
Release date: January 9, 2015
100
50
0
-50
-100
-150
2005
2006
2007
2008
2009
2010
2011
2012
2013
2014
Canadian employment surprised to the downside with the economy losing 4,300
jobs in December 2014 as forecasters looked for a 10,000 increase. The unemployment rate held steady at 6.6%. Losses were concentrated in the services sector where employment fell by 26,400, while goods-producing industries showed
a 22,100 rise in the month. The unemployment rate ended 2014 at 6.6%; the participation rate inched downward to 65.9%.
Source: Statistics Canada
Unemployment rate
% of labour force
9.0
8.5
8.0
Canadian November retail sales rise 0.4% in the month
7.5
7.0
Latest available: November
Release date: January 23, 2015
6.5
6.0
5.5
5.0
2005
2006
2007
2008
2009
2010
2011
2012
2013
2014
So urce : Statistics Canada
Retail sales
% change, month-over-month
3.0
Nominal retail sales in November 2014 unexpectedly increased by 0.4% in the
month following unchanged activity in October. Higher sales occurred despite
declines in sales at gasoline stations (0.8%) and motor vehicle dealerships
(0.3%). Excluding the auto and gasoline station components, so called core sales
rose by a much stronger than expected 1.0%, thereby building further on a 0.5%
gain in October. On a volumes basis, overall retail sales in November rose by a
robust 0.8% after unchanged activity in October.
2.0
1.0
0.0
-1.0
-2.0
-3.0
-4.0
-5.0
2006
2007
2008
2009
2010
2011
2012
2013
2014
Canadian housing starts fall to a nine-month low in December
Source: Statistics Canada
Latest available: December
Release date: January 9, 2015
Housing starts
Thousands
Housing starts fell by 6.5% to an annualized 180,600 in December 2014 from a
revised 193,200 in November (was 195,000). Market expectations had been for a
modest decline to 192,000 in December. The drop in overall housing starts reflected declines in both urban single-unit (-4.8%) and urban multiple-unit (7.0%) starts. Rural starts also declined (-9.8%) in the month. Weakness was concentrated in the Prairies (-10.2%), Quebec (-17.6%), and in Atlantic Canada (19.4%). In contrast, strength in the multiples component drove an overall increase in Ontario (2.0%) while starts in British Columbia also rose (1.9%) to
provide some offset.
300
280
260
240
220
200
180
160
140
120
100
00
01
02
03
04
05
06
07
08
09
10
Source: Canadian Mortgage and Housing Corporation
RBC ECONOMICS | RESEARCH
2
11
12
13
14
Canada trade balance posted a $0.6 billion deficit in November
Latest available: November
Release date: January 7, 2015
Merchandise trade
C$ billions, annualized
550
Exports
500
450
The Canadian merchandise balance posted a $0.6 billion deficit in November
2014, which was down from a revised $0.3 billion shortfall (previously reported
as a $0.1 billion surplus) in October. Market expectations had been for a $0.2
billion deficit in November. Nominal exports declined by 3.5% after falling
0.2% (previously up 0.1%) in October. Imports fell by 2.7% in November to
retrace a revised 1.2% (was 0.5%) increase in October. Controlling for the effect
of prices, the volume of exports, in chained 2007 dollars, declined by 2.2%. Imports declined as well but by a moderate 1.6%, thereby resulting in a fourth consecutive monthly deterioration in the real trade balance.
400
Imports
350
300
2006
2007
2008
2009
2010
2011
2012
2013
2014
Source: Statistics Canada
Consumer price index
% change, year-over-year
Canadian headline inflation rate dropped on lower energy prices in December; core measure ticked up relative
to December 2013
5
4
3
2
Latest available: December
Release date: January 23, 2015
1
0
Canada’s headline consumer price index fell by 0.7% in December 2014, thereby
reflecting a 5.0% drop in energy prices, which was a larger decline than market
expectations for a 0.6% decline. Prices were 1.5% higher than a year earlier,
which was a slower pace than November’s 2.0%. The Bank of Canada’s core
measure slipped by 0.3% in December, thereby meeting market expectations.
The annual core rate inched upward to 2.2% from 2.1% in November.
-1
-2
00
01
02
03
04
05
06
07
08
09
10
11
12
13
14
Source: Statistics Canada
The material contained in this report is the property of Royal Bank of Canada and may not be reproduced in any way, in whole or in part, without express authorization of
the copyright holder in writing. The statements and statistics contained herein have been prepared by RBC Economics Research based on information from sources considered to be reliable. We make no representation or warranty, express or implied, as to its accuracy or completeness. This publication is for the information of investors
and business persons and does not constitute an offer to sell or a solicitation to buy securities.
®Registered trademark of Royal Bank of Canada.
©Royal Bank of Canada.
RBC ECONOMICS | RESEARCH
© Copyright 2026
