
download full article
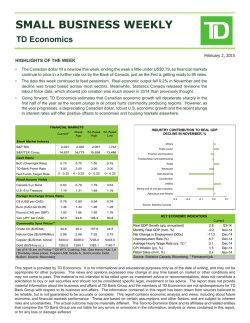
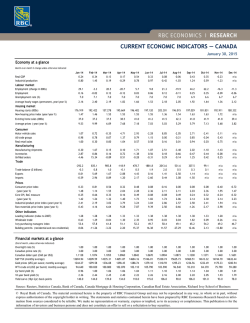
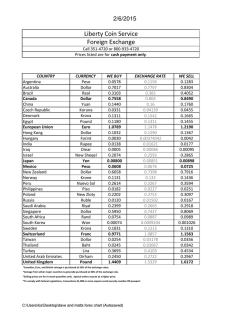
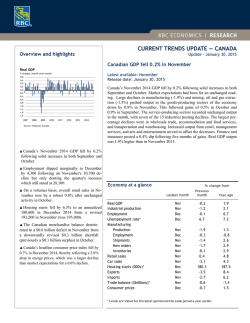
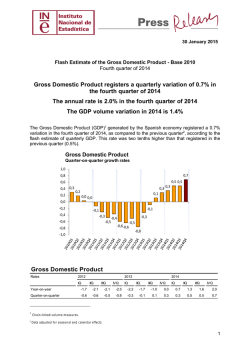
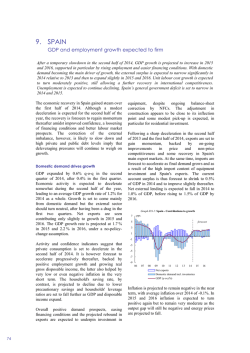
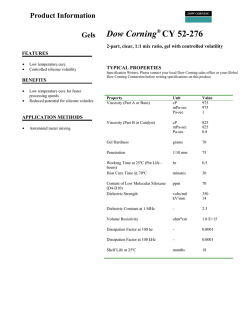
January 30th, 2015
WEEKLY
MARKET INSIGHTS
THE LATEST MARKET INSIGHTS
FROM THE RICHARDSON GMP TEAM
GDP at a glance
Markets giveth and taketh with reckless abandon. After last week’s impressive
rebound following a shaky start to the year, most markets are finishing the month in
negative territory. The TSX is down –0.7% and the S&P 500 dropped –2.7%. Europe
is down –0.9% with the initial reaction euphoria of the large scale QE worn off.
Reality setting in with disappointing GDP numbers in both Canada and the U.S.
TSX COMPOSITE
15,000
14,800
14,600
14,400
14,200
Energy commodities took a hit this week after inventory numbers came in higher
than expected. Crude has rebounded this week finishing up +4.3% thanks to a 7%
gain late Friday. Natural gas did not like the fact the ‘snowmageddon’ missed New
York City and other highly populated areas. It dropped –10.3% to close well below
$3. Most commodities are down this week.
Moving onto the sectors, the Canadian Financials led to the downside dropping 3.1%. Next was Energy which is now very used to detracting value for investors.
Consumer Staples have continued their strong run gaining +3.8% with most of the
strength coming from the grocers and our lone convenience store behemoth. The
Materials sector rose +2.9%, with gold names still doing well. Lumber producers
such as Canfor, West Fraser, Interfor and Norbord all rose over 8%.
Over in the U.S. all sectors were down. Technology (-4.1%) took the pole position
with Staples (-3.5%) and Financials (-3.3%) rounding out the bottom three. Retailers
gained this week, showing that it remains to be one of the hot areas benefitting from
lower gas prices. If you’re saving $20-$30 per fill-up why not buy an extra pair of
jeans? Other industry groups within the Consumer Discretionary (-1.3%)
outperformed the broader index with the exception of media names. Tough time to
be in the cable business.
TSX One Week Sector Performance
14,000
M
o
n
T
u
e
W
e
d
T
u
e
W
e
d
T
h
u
S&P 500
2,065
2,045
2,025
2,005
1,985
M
o
n
T
h
u
Craig Basinger, CFA
Chief Investment Officer
416.607.5221
[email protected]
Director, Investment Management Group
416.969.3161
[email protected]
3.0%
2.0%
Derek Benedet, CMT
1.0%
Research Analyst
416.607.5021
[email protected]
0.0%
-1.0%
-2.0%
Chris Kerlow, CFA
-3.0%
Cons Staples
Health Care
Materials
Utilities
Info Tech
Cons Disc
Industrials
Telco
Energy
Financials
-4.0%
F
r
i
Source: Bloomberg, Richardson GMP Limited
Gareth Watson, CFA
4.0%
F
r
i
Research Analyst
416.943.6156
[email protected]
2
WEEKLY MARKET INSIGHTS
GDP at a glance
Canada
It’s hard to find a reason to be excited about Canada. Today’s Gross Domestic
Product (GDP) numbers were lower than expected and the loonie continues to fall.
Should we be concerned about the Canadian economy?
Before we touch on the overall health of the Canadian economy and our beloved
loonie, let’s just briefly review the report this morning out of Statistics Canada
announcing a monthly 0.2% decline for our country’s GDP in November. The
weakness was mainly attributed to mining (down 2.5%), oil and gas extraction
(down 0.7%) and manufacturing (down 1.9%), while the only bright spots included
utilities (up 2.4%), retail (up 0.9%), agriculture & forestry (up 0.8%) and the public
sector (education, health and public administration). We would note that this
reading is for the month of November and there are some concerns that we saw
activity in the oil & gas industry and manufacturing decline at the same time.
However, the loonie actually averaged US$0.882 cents vs the U.S. dollar in
November, so the impact of today’s lower currency had no material impact on
manufacturing at that time. So if you’re wondering why manufacturing hasn’t
benefited from a weakening loonie it’s because we won’t get GDP numbers for
January for another couple of months and it can take time for a lower currency to
actually influence manufacturing activity as it is not necessarily immediate. The
market was not impressed by today’s report as economists were forecasting the
monthly GDP indicator to increase 0.3% and not decline 0.2% (although the
economy grew 1.9% year over year). Unfortunately the report will likely result in
economists adjusting their GDP forecasts lower and currency traders reacted by
selling the loonie.
CAD/USD Bloomberg Consensus
Forecasts
$0.92
$0.90
$0.88
$0.86
$0.84
$0.82
$0.80
$0.78
$0.76
$0.74
$0.72
Spot
Q1/15
Q2/15
Q3/15
Q4/15
2016
2017
Canadian Dollar (US$)
$1.04
$1.01
$0.98
$0.95
$0.92
$0.89
$0.86
Jan-15
Oct-14
Jul-14
Apr-14
Jan-14
Oct-13
Jul-13
Apr-13
Jan-13
$0.83
Now let’s move on to the outlook for the Canadian economy. Yes, the GDP report
missed expectations and yes, the loonie has tumbled in a very short period of time, $0.80
but are these indications of a pending recession? After all, didn’t the Bank of
$0.77
Canada (BoC) cut interest rates this month to help stimulate the economy? Yes,
the Bank of Canada took action on January 21 by cutting its key lending rate by 25
basis points from 1.00% to 0.75%; however, on that same day the central bank
also released its monetary policy report where it forecasted GDP growth of 2.1% in 2015 and 2.4% in 2016 with the economy returning
to full capacity by the end of 2016. These are not terrible numbers and even if they’re lowered in future forecasts it’s unlikely they will
be lowered enough to put us in recession territory barring any unforeseen shock to the global economy such as material weakness in
the United States. In fact while the BoC obviously highlighted lower energy prices as a concern in their latest interest rate statement, it
also noted “outside the energy sector, we are beginning to see the anticipated sequence of increased foreign demand, stronger
exports, improved business confidence and investment, and employment growth”. These are not the words of a central bank that is
panicking. The decline in energy prices has been severe which will impact economic growth from coast to coast, thus taking the
Canadian economy off of its planned trajectory and possibly putting downward pressure on inflation. To make up for these shortfalls
the Bank of Canada realized that growth would have to come from other sectors of the economy resulting in the recent rate cut as some
of these other sectors would benefit from a lower Canadian dollar. It’s unlikely rates were lowered to stimulate borrowing and
purchasing from consumers as politicians and policy makers alike have highlighted our increasing personal debt levels. Instead, it’s
likely the cut was directed to help industry keep our economy on trajectory even if the energy sector may struggle.
So where does this leave the Canadian dollar? Let’s go through the usual checklist of reasons why traders would BUY the loonie over
the U.S. dollar: 1) commodity prices strong or trending higher – NO, 2) Canadian economy outperforming the U.S. economy – NO, 3)
Canadian interest rates forecast to increase before a similar move in the U.S. – NO. Is there any reason why currency traders would
hold or purchase more Canadian dollars at the moment? Other than some thinking that the Canadian dollar is oversold, the answer is
unfortunately NO. This tends to hold true for the Canadian dollar versus most other major currencies in the world as the loonie has
underperformed in the month of January (down almost 8 cents against the U.S. dollar alone). The Canadian dollar has continued to fall
even after the interest rate cut on January 21 as some economists are calling for a another 25 basis point cut as early as March (some
WEEKLY MARKET INSIGHTS
3
of the same economists that weren’t expecting a rate cut at all this year…now they’re calling for two cuts in the first quarter…go figure!).
And, the loonie took another hit today as the lower than expected GDP numbers increase the likelihood that a 25 basis point cut is
coming on March 4, especially since all of the BoC’s forecasts have been made using a $60 oil price. Whether the additional rate cut
comes, the damage has been done and the loonie will likely remain weak until that March meeting. Possible catalysts that could
rekindle interest in our currency in the future include 1) no rate cut in March when the market is pricing one in, 2) a bounce in energy
prices, and 3) the Federal Reserve delaying interest rate increases beyond what the market is expecting. So many moving parts to this
equation will keep forecasts within a wide range between US$0.75 and US$0.85 for at least the first half of the year, but Bloomberg
forecasts indicate that the market expects the loonie to regain some strength over time. So do we have a crystal ball that will tell us
when the Canadian dollar will find a bottom and rebound? No we do not, but what’s important for investors to realize is that sentiment
for the loonie is extremely poor, and will likely remain so until at least the next BoC meeting. Can the Canadian dollar go lower from
here? If energy prices remain low, if rate cut chatter persists in Canada and if the Federal Reserve raises interest rates sooner than
expected then yes, absolutely.
U.S
After the two best consecutive quarters of GDP growth since the great recession, the U.S. disappointed this morning expanding by just
2.6% in the fourth quarter. The chart below gives you an indication of the underlying drivers of GDP growth each quarter dating back to
2009. This past quarter was weighed down most heavily by net exports. The trade deficit widened to $471.5bb after imports grew 300%
faster than exports. A strengthening U.S. dollar makes domestic exporters less competitive on a global scale and weighed on total
output substantially in the past three months and which has likely continued this year.
On a positive note the U.S. consumer added more to GDP than any other quarter in the past nine years. Savings at the pump and an
improving labor environment is paying dividends to the economy as consumers are spending rather than investing their extra
disposable income. In 2014, the U.S. economy added nearly 3mm jobs, the most this millennium. We took the opportunity to add to our
U.S. consumer staple weightings this week and recommend taking a look at stocks that benefit from improved consumer spending.
Another notable area was a pickup in inventories. A good sign that companies are seeing strong sales trends and stocking up for the
growth ahead. Fixed private investment is showing continued signs of strength but investment into industrial and transportation
equipment continues to lag. A surprising trend seeing that oil prices have been grinding lower for quite some time.
Despite an improving economy and consumer confidence at an 11-year high, stock fell this week after earnings disappointments from
almost any company that relies on high oil prices or international revenues as a large portion of their cash flow. The dislocation in stock
performance and economic growth shows that the near term gyrations in the market have little to do with overall economic health.
Contributions to % Change in Real GDP
Bureau of Economic Analysis
Q1 2013 Q2 2013 Q3 2013 Q4 2013 Q1 2014 Q2 2014 Q3 2014 Q4 2014
Personal Consumption Expenditures
Goods
Services
Gross private domestic investment
Fixed investment
Nonresidential
Structures
Equipment
Industrial equipment
Transportation Equipment
Other equipment
Intellectual Property Products
Residential
Change in Private Inventories
Net Exports
Exports
Imports
Gov't consumption and gross investment
Federal
National defense
Nondefense
State and local
Total Real GDP
Research and Development
Excluding Research and Development
2.45
1.35
1.11
1.12
0.42
0.2
-0.33
0.28
0.03
0.08
0.15
0.24
0.22
0.7
-0.08
-0.12
0.04
-0.75
-0.79
-0.55
-0.24
0.04
2.7
0.03
2.71
1.23
0.3
0.93
1.03
0.74
0.21
0.19
0.09
0
0.12
-0.12
-0.08
0.53
0.3
-0.54
0.82
-1.36
0.04
-0.26
-0.09
-0.17
0.31
1.8
0.01
1.76
1.39
0.8
0.59
2.5
1.01
0.67
0.29
0.27
0.2
0.05
-0.07
0.11
0.34
1.49
0.59
0.67
-0.09
0.04
-0.08
0.03
-0.11
0.13
4.5
-0.08
4.59
2.51
0.83
1.69
0.62
0.95
1.23
0.34
0.76
0.02
0.45
0.36
0.14
-0.28
-0.34
1.08
1.3
-0.22
-0.71
-0.79
-0.55
-0.24
0.07
3.5
-0.02
3.52
0.83
0.23
0.6
-1.13
0.03
0.2
0.08
-0.06
0.17
0
-0.09
0.18
-0.17
-1.16
-1.66
-1.3
-0.36
-0.15
-0.01
-0.18
0.17
-0.14
-2.1
0.07
-2.18
1.75
1.33
0.42
2.87
1.45
1.18
0.35
0.63
0.32
0.04
-0.14
0.21
0.27
1.42
-0.34
1.43
-1.77
0.31
-0.06
0.04
-0.1
0.38
4.6
0.09
4.51
2.21
1.06
1.15
1.18
1.21
1.1
0.14
0.63
0.35
0.45
-0.05
0.34
0.1
-0.03
0.78
0.61
0.16
0.8
0.68
0.66
0.01
0.13
5
0.16
4.8
2.87
1.2
1.67
1.2
0.37
0.24
0.08
-0.11
-0.19
-0.17
0
0.27
0.13
0.82
-1.02
0.37
-1.39
-0.4
-0.54
-0.58
0.04
0.14
2.6
0.13
2.51
WEEKLY MARKET INSIGHTS
4
Here and now with the Dow
You hear it daily on the news, whether it is the six o’clock news on TV or the radio during the commute home. The Dow was up, down,
up then down, or any type of permutation. Maybe it’s because our job is to watch the markets on a daily basis, but I’m astonished that
anyone actually cares or quotes the Dow Jones Industrial Average. Perhaps it’s because it is the first index (technically an average)
currently well over 100 years old or perhaps it’s used simply because of its name recognition. It really serves as a poor measure of
overall stock performance as it tracks only 30 companies and the price weighted average totally ignores the size of the companies
making the weighting very troubling. Regardless of its faults, like an annoying uncle sometimes we just have to live with it.
With a 9.6% weighting, Visa has for some time made up a large portion of the Dow. Following
yesterday’s remarkable earnings rise, Visa also announced a 4 for 1 stock split effective March
19th, 2015. Goldman Sachs Group Inc. will then become the most heavily weighted member on
the Dow with a 7% weighting at today’s prices. The top five names will consist of Goldman, 3M,
IBM, Boeing and United Technologies. Visa will fall to the 20 th spot with a mere 2.6%. The top
five will now make up 30% of the total, down from 33.2% currently, which is a good thing. The
Dow still remains very top heavy with an uneven overall sector allocation. It’s light on Energy,
Staples and has no Utilities, and has double the Industrial weighting (note the name) compared to
the S&P 500.
Dow Sector Weights
Sector
Financials
Industrials
Information Technology
Health Care
Consumer Discretionary
Energy
Consumer Staples
Materials
Telecommunication Services
Weight
15.3
19.6
19.1
11.2
14.2
7.0
7.9
2.7
2.9
While we’re on the topic let’s take a look at how the Dow has performed so far this year. Earnings season has definitely not been
uniformly positive for the blue chips. Some of the household names are showing significant YTD losses. The average is down over 3.0% YTD. Six of the thirty names are down over 10%. Led by Caterpillar (-13.0%), JP Morgan (-12.6%), American Express (-12.5%),
Microsoft (-11.8%), Chevron (-10.7%) and Goldman Sachs (-10.5%). Seven of thirty are positive YTD with Boeing (+12.2%), Merck
(+7.5%) and United Health Group (+6.0%) being the only clear winners.
For income investors it’s not a
bad shortlist for quality dividend
names with a third of the
members paying over a 3%
dividend. With bond yield tanking
higher yielding stocks are
increasingly attractive, although
at this point in time with the C$
this weak it’s possible for the
Loonie to easily erase a year’s
worth of dividends. From a
sector perspective adding some
U.S. payers allows you to gain
exposure to certain sectors which
are terribly underrepresented on
the TSX. One example is the lack
of quality Canadian dividend
payers in the Tech space. Names
like IBM, Microsoft, Intel and
Cisco would certainly have a
place in a diversified portfolio
with an income focus.
The leader drops a weight class in the Dow Jone Industrial Average
Name
Price Weight (Old) Weight (New) RSI Yield GICS_SECTOR_NAME
GOLDMAN SACHS GROUP INC
174.2
6.4
7.0 38.2
1.4 Financials
3M CO
164.2
6.1
6.6 60.8
2.5 Industrials
INTL BUSINESS MACHINES CORP 154.1
5.7
6.2 47.2
2.9 Information Technology
BOEING CO/THE
145.1
5.4
5.8 78.5
2.5 Industrials
UNITED TECHNOLOGIES CORP
115.8
4.3
4.6 52.1
2.0 Industrials
UNITEDHEALTH GROUP INC
108.4
4.0
4.3 61.3
1.4 Health Care
HOME DEPOT INC
105.8
3.9
4.2 61.6
1.8 Consumer Discretionary
TRAVELERS COS INC/THE
103.4
3.8
4.1 46.5
2.1 Financials
CHEVRON CORP
102.4
3.8
4.1 38.9
4.2 Energy
JOHNSON & JOHNSON
101.4
3.8
4.0 44.5
2.8 Health Care
NIKE INC -CL B
93.5
3.5
3.7 49.5
1.2 Consumer Discretionary
MCDONALD'S CORP
92.7
3.4
3.7 55.1
3.7 Consumer Discretionary
WALT DISNEY CO/THE
92.3
3.4
3.7 47.0
1.2 Consumer Discretionary
EXXON MOBIL CORP
88.0
3.3
3.5 37.9
3.1 Energy
WAL-MART STORES INC
86.8
3.2
3.5 53.6
2.2 Consumer Staples
PROCTER & GAMBLE CO/THE
84.6
3.1
3.4 31.6
3.0 Consumer Staples
AMERICAN EXPRESS CO
81.9
3.0
3.3 28.0
1.3 Financials
CATERPILLAR INC
79.8
3.0
3.2 27.2
3.5 Industrials
DU PONT (E.I.) DE NEMOURS
72.3
2.7
2.9 47.9
2.6 Materials
VISA INC-CLASS A SHARES
260.3
9.6
2.6 36.6
0.7 Information Technology
MERCK & CO. INC.
61.4
2.3
2.5 55.8
2.9 Health Care
JPMORGAN CHASE & CO
55.0
2.0
2.2 38.5
2.9 Financials
VERIZON COMMUNICATIONS INC
45.8
1.7
1.8 38.6
4.8 Telecommunication Services
COCA-COLA CO/THE
41.6
1.5
1.7 43.4
2.9 Consumer Staples
MICROSOFT CORP
41.2
1.5
1.6 32.0
3.0 Information Technology
INTEL CORP
33.6
1.2
1.3 35.9
2.9 Information Technology
AT&T INC
32.9
1.2
1.3 41.5
5.7 Telecommunication Services
PFIZER INC
31.6
1.2
1.3 46.2
3.5 Health Care
CISCO SYSTEMS INC
26.9
1.0
1.1 46.0
2.8 Information Technology
GENERAL ELECTRIC CO
24.0
0.9
1.0 42.8
3.8 Industrials
YTD %
(10.50)
(0.32)
(3.95)
12.25
0.13
6.05
0.47
(2.81)
(10.73)
(3.46)
(3.17)
(1.17)
(2.19)
(6.13)
0.58
(7.07)
(12.50)
(12.97)
(2.35)
(0.92)
7.54
(12.58)
(1.50)
(1.66)
(11.80)
(7.91)
(1.53)
0.71
(4.01)
(5.18)
3M %
(7.30)
7.57
(6.36)
17.76
8.21
14.02
8.08
2.82
(14.57)
(5.77)
0.03
(0.90)
2.01
(8.24)
12.92
(2.66)
(8.31)
(20.51)
6.65
9.78
6.51
(7.93)
(7.74)
0.27
(11.10)
2.52
(4.26)
5.06
10.84
(6.70)
WEEKLY MARKET INSIGHTS
5
This material is provided for general information and is not to be construed as an offer or solicitation for the sale or purchase of securities mentioned
herein. Past performance may not be repeated. Every effort has been made to compile this material from reliable sources however no warranty can be
made as to its accuracy or completeness. Before acting on any of the above, please seek individual financial advice based on your personal
circumstances. However, neither the author nor Richardson GMP Limited makes any representation or warranty, expressed or implied, in respect
thereof, or takes any responsibility for any errors or omissions which may be contained herein or accepts any liability whatsoever for any loss arising
from any use or reliance on this report or its contents.
Richardson GMP Limited is a member of Canadian Investor Protection Fund. Richardson is a trade-mark of James Richardson & Sons Limited. GMP is
a registered trade-mark of GMP Securities L.P. Both used under license by Richardson GMP Limited.


© Copyright 2026