
Grain Markets
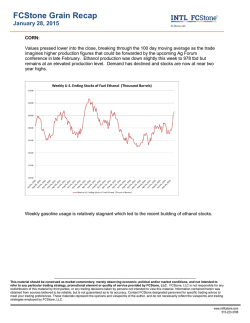
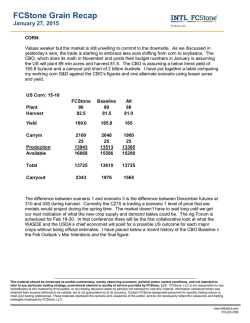
Page 1 of 6
DAILY GRAINS COMMENTARY
Friday February 06, 2015
312-462-4533
DAILY SOY COMPLEX COMMENTARY
02/06/15
Massive global supply to weigh soybeans, biodiesel news boosts
OVERNIGHT CHANGES THROUGH 6:05 AM (CT):
SOY BEANS +3.2, BEAN OIL +0.3, SOYMEAL +1.0
OVERNIGHT DEVELOPMENTS: March soybeans were up 3 1/2 cents near 7:00 cst. Malaysia palm oil futures
were up 1.5% from last year and China soybean futures were up 0.4%. Global equity markets were mixed
during the overnight and early morning hours as they braced for today's US Non-Farm Payroll report. The
bright spot overnight was a nearly 1% gain in the Japanese Nikkei helped by the prospect for easier monetary
policy should inflation fall into negative territory. Meanwhile, China's Shanghai Composite slipped 2% and down
to the lowest level in six week's as traders positioned for a wave on initial public offerings in coming week.
European shares were lower across the board, with an added drag coming on a better than 10% drop in the
shares of Tate & Lyle on profit warnings. US equity markets were marginally higher ahead of the US Jobs data,
with January Non-Farm Payrolls expected in the range of 230,000 to 250,000 jobs added and a steady
employment rate at 5.6%.
NEAR-TERM MARKET FUNDAMENTALS: The market managed a bounce yesterday despite bearish South
American weather forecasts and disappointing soybean export news. However, soybean meal exports were
positive and demand for US soybeans is approaching 90% of the USDA projection. The bear camp might see a
slight decline in open interest as a sign of near-term vulnerability for soybeans ahead, but noted weakness in
the Dollar could begin to provide some demand cushion. A main source of support for soybean oil came from
the palm oil market, which rose over 4% after reports that the Indonesian Parliament could increase their
subsidy on biodiesel. In addition to the current US refinery workers strike, this helped soybean oil outperform
soybeans and soymeal by a wide margin. South American weather forecasts will lean bearish over the next
7-10 days as Brazil's Rio Grande de Sul region and Paraguay will see their rainfall amounts fall back towards
more normal levels.
Weekly export sales for soybeans came in at 489,700 tonnes for the current marketing year and 7,100 tonnes
for the next marketing year for a total of 496,800 tonnes. As of January 29th, cumulative soybean sales stand
at 94.3% of the USDA forecast for the 2014/2015 (current) marketing year versus a 5-year average of 88.8%.
Sales of 89,000 tonnes are needed each week to reach the USDA forecast. Soymeal sales came in at 296,300
tonnes for the current marketing year and 6,000 tonnes for the next marketing year for a total of 302,300
tonnes. Cumulative soymeal sales stand at 71.9% of the USDA forecast versus a 5-year average of 64.5%.
Sales of 93,000 tonnes are needed each week to reach the USDA forecast. Oil sales were 15,100 tonnes.
For the USDA Supply and Demand report on February 10th, analysts see US 2014/15 ending stocks at 398
million bushels, down from 410 million last month. Taking the carryout estimate one step further, the 2015/16
carryout could come in at a whopping 595 million bushels if we were to assume a 398 million bushel carry-in,
86 million acres planted, 85.2 million harvested, a yield of 45.5 bushels per acre and total usage at 3.695 billion
bushels (up from 3.665 billion in 2014/15). Many see planted area of 88 million or higher! The world carryout
estimate was pegged at 90.44 million tonnes, down slightly from 90.79 million last month but still a record and
this compares with 66.16 million tonnes last year. Brazilian production is estimated at 94.67 million tonnes,
down from 95.50 million last month. Argentine production is estimated at 55.59 million tonnes, up from 55
million last month. There have been several estimates near 57 million tonnes recently due to suspected higher
yield. World ending stocks for 2014/15 season are now pegged at a record high of 90.78 million tonnes, 29%
above the previous record high of 70.3 million tonnes. Stocks/usage is pegged at 31.7%, which is also at a
record high.
We have not experienced this type of situation in the soybean market before, as absorbing massive global
file:///C:/Users/Bill/AppData/Local/Temp/Low/TTXQV9FU.htm
2/6/2015
Page 2 of 6
supply may take much lower prices. Traders continue to suggest that South America exporters have always
been active in the spring as their harvest has come on-board. From the 2005/06 season through 2010/11,
Brazil exported 25-30 million tonnes per year. This year, Brazilian exports are expected to surge to almost 50
million tonnes. Once any pent-up demand from global end-users is saturated, the world will be left with a
massive supply to absorb. The most likely way for this to happen would be for soybeans to move to a lower
price level that would encourage demand and discourage production.
TODAY'S MARKET IDEAS:
With Brazil and Argentina likely to harvest over 5.5 billion bushels of soybeans in the next few months, large
global supply will likely keep a lid on soybean prices going forward. May Soybean will find near-term resistance
at 991 and 1002 while November Soybeans should find resistance at 975 and 985 3/4, but any rally retesting
Tuesday's spike high should be viewed as an opportunity to sell futures and/or buy put option strategies. While
it leans bearish for the rest of the soy complex, May soybean oil could see upside follow-through from the palm
oil/refinery news and will have a near-term upside target at the 50-day moving average of 32.41.
NEW RECOMMENDATIONS:
Buy May Soybean $9.50 puts for 18 cents with an objective of 38 cents. Risk the trade to a close below 9.
PREVIOUS RECOMMENDATIONS:
1) Short May meal from 331.30 with an objective of 301.60. Risk to 336.60. 2) Short July soybean 1040 put and
long 5 July 880 puts for even money with an objective on the spread of +60 cents. Risk a total of 14 cents on
the spread. 3) Long July soybean 1020/880 bear put spread from 36 cents with an objective of 85. Risk to 21.
SOYBEAN COMPLEX TECHNICAL OUTLOOK:
Note: Technical commentary is based solely on statistical indicators and does not necessarily correspond to any fundamental analysis that
may appear elsewhere in this report.
SOYBEANS (MAR) 02/06/2015: Daily momentum studies are on the rise from low levels and should accelerate
a move higher on a push through the 1st swing resistance. A positive signal for trend short-term was given on a
close over the 9-bar moving average. The market has a slightly positive tilt with the close over the swing pivot.
The next upside target is 992. The next area of resistance is around 988 and 992, while 1st support hits today
at 974 1/2 and below there at 965 1/4.
SOYBEAN OIL (MAR) 02/06/2015: Momentum studies are rising from mid-range, which could accelerate a
move higher if resistance levels are penetrated. The intermediate trend could be turning up with the close back
above the 18-day moving average. The market has a bullish tilt coming into today's trade with the close above
the 2nd swing resistance. The near-term upside target is at 32.90. The next area of resistance is around 32.42
and 32.90, while 1st support hits today at 31.00 and below there at 30.07.
SOYMEAL (MAR) 02/06/2015: Stochastics are at mid-range but trending higher, which should reinforce a
move higher if resistance levels are taken out. The market's short-term trend is negative as the close remains
below the 9-day moving average. The market tilt is slightly negative with the close under the pivot. The next
upside target is 335.8. The next area of resistance is around 333.4 and 335.8, while 1st support hits today at
329.4 and below there at 327.7.
DAILY CORN COMMENTARY
02/06/15
Higher prices needed to pull out corn from US producers
OVERNIGHT CHANGES THROUGH 6:05 AM (CT):
CORN +2.4
file:///C:/Users/Bill/AppData/Local/Temp/Low/TTXQV9FU.htm
2/6/2015
Page 3 of 6
OVERNIGHT DEVELOPMENTS: March corn was trading up 2 1/2 cents near 7:00 cst. Outside markets are
supportive with modest gains in energy and equities.
NEAR-TERM MARKET FUNDAMENTALS: The technical action is positive and it may take higher prices to
spark better producer movement. The market experienced an inside trading session yesterday held back by an
uneventful weekly corn export sales report. However, an impressive recovery bounce in energy prices and
developing weakness in the Dollar provided corn and other commodity markets with some support. A sprinkling
of farmer sales met modest speculative buying as prices seemed to favor an extension of their recent
consolidation action. Labor negotiators for shippers and terminal operators at US West Coast ports raised the
ante in contract talks by suggesting that chronic cargo slowdowns are now within days of a complete gridlock,
and that issue could end up jacking up price volatility going into the coming weekend. Weekly export sales for
corn came in at 844,900 tonnes for the current marketing year and 7,100 tonnes for the next marketing year for
a total of 852,000 tonnes, and that represented a downtick from the prior week as the results were towards the
lower end of the range of expectations. As of January 29th, cumulative corn sales stand at 72.3% of the USDA
forecast for the 2014/2015 (current) marketing year versus a 5-year average of 67.8%. Sales of 401,000
tonnes are needed each week to reach the USDA forecast.
The market wasn't exactly thrilled with the level of US corn exports, but the results were within the expected
range. While there was some light corn fund buying yesterday, the bull camp has to be discouraged with the
inability to extend the bullish bias from earlier in the week. While prices remain within close proximity to their
spike-up highs, the lack of upside momentum is starting to weigh on sentiment. In fact, if the market does not
respect the 100-day moving average down at 408 1/4 in December corn, this would shift the technicals further
in favor of the bear camp. However, some traders will suggest that the rally this week has failed to yield a
needed uptick in farmer selling, and that could result in at least a temporary rise above this week's highs of 419
1/2. If equity and energy prices manage to add to the gains posted on Thursday, that could provide corn with
an additional outside market lift today.
For the USDA report on February 10th, analysts see US corn ending stocks for 2014/15 at 1.879 billion
bushels, up 2 million from last month with a range of 1.817-2.002 billion. If there is a surprise downtick in
demand, we expect to see it in ethanol as production has begun to slide and stocks continue to inflate due to
the weaker crude oil and gasoline market. On the world level, global ending stocks for 2014/15 are expected to
come in at 189.28 million tonnes, about unchanged from January with a range of 187.60-190.93 million.
Traders see Brazilian corn production at 74.56 million tonnes, up from 75 million last month with a range of
72.80-76.00 million. Argentine corn production is estimated at 22.54 million tonnes, up from 22 million last
month with a range of 21.20-28.50 million.
TODAY'S MARKET IDEAS:
Critical support moves up to 412 in December corn, and the ability to take out 418 1/4 could produce a
temporary target of 423 1/2. For the bulls to maintain control probably means consistent respect for the 100day moving average down at 408 1/4. March corn support is at 385 1/2 with 391 1/4 and 397 1/4 as resistance.
NEW RECOMMENDATIONS:
None.
PREVIOUS RECOMMENDATIONS:
1) Short March corn 370 put from 8 with an objective of zero. Risk to a profit stop of 6 1/2. 2) Long December
2015 corn 380 put from 27 cents, long Dec 2015 corn futures from $3.99 3/4 and short December 2015 corn
430 calls from 26 cents. Continue to hold.
CORN TECHNICAL OUTLOOK:
Note: Technical commentary is based solely on statistical indicators and does not necessarily correspond to any fundamental analysis that
may appear elsewhere in this report.
CORN (MAR) 02/06/2015: Positive momentum studies in the neutral zone will tend to reinforce higher price
file:///C:/Users/Bill/AppData/Local/Temp/Low/TTXQV9FU.htm
2/6/2015
Page 4 of 6
action. The market now above the 18-day moving average suggests the intermediate-term trend has turned up.
With the close higher than the pivot swing number, the market is in a slightly bullish posture. The near-term
upside target is at 390 3/4. The next area of resistance is around 388 1/4 and 390 3/4, while 1st support hits
today at 382 1/4 and below there at 379.
DAILY WHEAT COMMENTARY
02/06/15
With no weather premium, market has more to gain than to lose
OVERNIGHT CHANGES THROUGH 6:05 AM (CT):
WHEAT +6.2
OVERNIGHT DEVELOPMENTS: March wheat was up 6 cents near 7:15 cst. Outside forces are slightly
supportive with higher equities and energy prices.
NEAR-TERM MARKET FUNDAMENTALS: July KC wheat appears set to experience a key weekly reversal as
the market posted a new contract low and looks set to see a higher close for the week. With another higher
high for the move and an extending pattern of higher lows, the Chicago wheat market is starting to adopt a
more constructive technical pattern. Weekly export sales were mostly supportive yesterday, and perhaps US
wheat also drafted some support from ideas that the US Dollar might be poised to fall to its lowest levels since
mid-January. Sales for the week ending January 29th came in at 397,600 tonnes for the current marketing year
and 89,300 tonnes for the next marketing year for a total of 486,900 tonnes. As of January 29th, cumulative
wheat sales stand at 80.8% of the USDA forecast for the 2014/2015 (current) marketing year versus a 5-year
average of 79.2%. Sales of 275,000 tonnes are needed each week to reach the USDA forecast. In addition to
the weekly export news, there were also other signs of cash activity from Turkey, Philippines and Egypt.
Wheat might also find some support on news that Ukraine raised their benchmark interest rates by 5.5% in an
attempt to stem inflation. Ukraine's currency slid a whopping 46% against the US Dollar on Thursday night.
This is already a huge issue in Russia, and likely the catalyst for their attempt to slow exports for the remainder
of the crop year. Ukraine has followed suit for the same reason. The weather will have to be perfect this spring
for their new crop wheat and even if it is, it raises questions as to whether their export potential next year will
come close to their pace this past year. At current price levels, it appears the market has taken all the riskpremium out of the market for weather and/or geopolitical issues, and that will keep their export pace slow for
months to come.
The weather outlook has as slightly positive spin to it, but only for the US, as Black Sea region temperatures
appear to be above-normal and Russia/Ukraine will see scattered precipitation over the next 2 weeks.
However, temps look to get back to above-normal levels for the western Plains and central US over the next
7-14 days, and precipitation will be below-normal.
For the USDA Supply and Demand report on February 10th, analysts see US 2014/15 wheat ending stocks at
689 million bushels, up 2 million from January, with a range of 595-730 million. World ending stocks for
2014/15 are estimated at 195.83 million tonnes, down slightly from 196 million last month with a range of
191.40-197 million. Many see a decline in Australian production but overall, there are no big changes expected
on the world level for wheat supply in 2014/15.
TODAY'S MARKET IDEAS:
March Wheat appears to be carving out a short-term bottom, as there appears to be no weather or geo-political
premium left in the market. Look for resistance at 547 1/2, and an initial retracement target of in the market of
563, with support at the recent low of 493. Trend-line resistance for the KC/Chicago March spread comes in at
+45 1/2 today, while the 100-day moving average comes in at +51 1/2. The March Wheat/Corn spread could
be poised to test the 20-day moving average at +144 1/4.
NEW RECOMMENDATIONS:
None.
file:///C:/Users/Bill/AppData/Local/Temp/Low/TTXQV9FU.htm
2/6/2015
Page 5 of 6
PREVIOUS RECOMMENDATIONS:
None.
WHEAT TECHNICAL OUTLOOK:
Note: Technical commentary is based solely on statistical indicators and does not necessarily correspond to any fundamental analysis that
may appear elsewhere in this report.
WHEAT (MAR) 02/06/2015: Stochastics are at mid-range but trending higher, which should reinforce a move
higher if resistance levels are taken out. The market now above the 18-day moving average suggests the
intermediate-term trend has turned up. A positive setup occurred with the close over the 1st swing resistance.
The next upside target is 541. The next area of resistance is around 535 1/4 and 541, while 1st support hits
today at 516 1/4 and below there at 502 3/4.
KC WHEAT (MAR) 02/06/2015: Positive momentum studies in the neutral zone will tend to reinforce higher
price action. The cross over and close above the 18-day moving average indicates the intermediate-term trend
has turned up. The upside closing price reversal on the daily chart is somewhat bullish. A positive setup
occurred with the close over the 1st swing resistance. The next upside target is 578. The next area of
resistance is around 572 1/2 and 578, while 1st support hits today at 555 1/2 and below there at 544.
MINN WHEAT (MAR) 02/06/2015: Momentum studies are rising from mid-range, which could accelerate a
move higher if resistance levels are penetrated. The intermediate trend could be turning up with the close back
above the 18-day moving average. The market setup is supportive for early gains with the close over the 1st
swing resistance. The near-term upside objective is at 590 3/4. The next area of resistance is around 586 1/2
and 590 3/4, while 1st support hits today at 571 1/2 and below there at 560 3/4.
RICE (MAR) 02/06/2015: Daily stochastics are showing positive momentum from oversold levels, which should
reinforce a move higher if near term resistance is taken out. The close below the 9-day moving average is a
negative short-term indicator for trend. Market positioning is positive with the close over the 1st swing
resistance. The next upside target is 10.627. The next area of resistance is around 10.560 and 10.627, while
1st support hits today at 10.340 and below there at 10.188.
DAILY TECHNICAL STATISTICS
CLOSE
9 DAY
RSI
14 DAY
RSI
14 DAY
SLOW
STOCH D
14 DAY
SLOW
STOCH K
4 DAY
M AVG
9 DAY
M AVG
18 DAY
M AVG
45 DAY
M AVG
60 DAY
M AVG
GRAIN COMPLEX
CNAH5
385 1/4
CNAZ5
416
SSAH5
981 1/4
SSAX5
964 3/4
SMAH5
331.4
BOAH5
31.71
WHAH5
525 3/4
WHAN5
528 1/2
RCAH5
10.450
KWAH5
564
MWAH5
579
OTAH5
287 3/4
52.65
55.04
47.66
47.64
44.16
54.65
49.26
45.30
33.26
49.61
52.13
51.68
49.09
51.16
44.84
44.64
44.15
50.39
43.78
40.85
31.70
44.25
47.38
46.32
33.42
40.45
19.00
19.75
43.63
25.10
19.17
17.67
15.71
20.67
21.13
40.55
48.68
58.28
29.04
29.96
46.83
36.20
32.70
29.24
21.28
33.92
35.14
52.88
381.06
411.88
974.94
957.81
333.15
30.88
510.81
517.69
10.35
552.56
568.75
279.50
378.25
408.97
972.94
957.89
334.81
30.63
510.94
519.25
10.60
548.33
564.61
282.61
382.71
411.81
982.42
966.54
333.06
31.60
524.60
532.44
10.94
561.72
574.07
286.15
393.96
420.59
1016.75
994.66
344.87
32.09
571.78
578.23
11.68
608.29
605.94
299.73
392.35
419.94
1022.52
999.72
347.12
32.31
567.70
575.68
11.88
608.23
603.00
306.28
Calculations based on previous session. Data collected 02/05/2015
Data sources can & do produce bad ticks. Verify before use.
file:///C:/Users/Bill/AppData/Local/Temp/Low/TTXQV9FU.htm
2/6/2015
Page 6 of 6
DAILY SWING STATISTICS
Contract
GRAIN COMPLEX
CNAH5
Corn
CNAZ5
Corn
SSAH5
Soybeans
SSAX5
Soybeans
SMAH5
Soymeal
BOAH5
Soybean Oil
WHAH5
Wheat
WHAN5
Wheat
RCAH5
Rice
KWAH5
KC Wheat
MWAH5
MINN Wheat
OTAH5
Oats
Support 2
Support 1
Pivot
Resist 1
Resist 2
379
410
965
949 1/4
327.6
30.06
502 3/4
509 1/4
10.187
544
560 3/4
278 1/2
382 1/4
413 1/2
974 1/2
958 1/2
329.3
30.99
516
520
10.340
555 1/2
571 1/2
283 3/4
385
415 1/4
978 1/2
962
331.7
31.48
522
526 1/4
10.407
561
575 3/4
286 1/2
388 1/4
418 1/2
988
971
333.4
32.42
535 1/2
537
10.560
572 1/2
586 1/2
291 3/4
391
420 1/2
992
974 3/4
335.8
32.90
541 1/4
543 1/4
10.627
578
590 3/4
294 1/2
Calculations based on previous session. Data collected 02/05/2015
Data sources can & do produce bad ticks. Verify before use.
***This report includes information from sources believed to be reliable and accurate as of the date of this publication, but no independent
verification has been made and we do not guarantee its accuracy or completeness. Opinions expressed are subject to change without
notice. This report should not be construed as a request to engage in any transaction involving the purchase or sale of a futures contract
and/or commodity option thereon. The risk of loss in trading futures contracts or commodity options can be substantial, and investors
should carefully consider the inherent risks of such an investment in light of their financial condition. Any reproduction or retransmission of
this report without the express written consent of Stratis Financial is strictly prohibited. Violators are subject to a $15,000 fine per violation.
file:///C:/Users/Bill/AppData/Local/Temp/Low/TTXQV9FU.htm
2/6/2015
© Copyright 2026