
Distribution of Impact Melt Generated by the South Pole
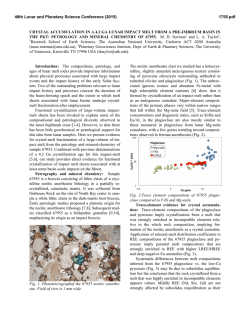
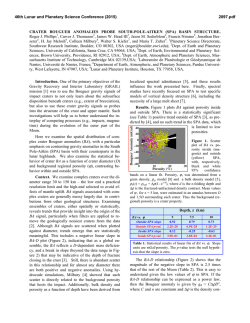
46th Lunar and Planetary Science Conference (2015)
1687.pdf
DISTRIBUTION OF IMPACT MELT GENERATED BY THE SOUTH POLE-AITKEN IMPACT
K. Uemoto1, M. Ohtake2, Y. Yokota3, S. Yamamoto3, R. Nakamura4, J. Haruyama2, T. Matsunaga3, Y. Ishihara2, T.
Iwata2. 1Tokyo Univ. ([email protected]), 2Japan Aerospace Exploration Agency(JAXA), 3National
Institute for Environmental Studies, 4 National Institute of Advanced Industrial Science and Technology.
Introduction: The South Pole-Aitken (SPA) basin
is one of the largest basins on the Moon. It was determined to have an elliptical structure with a 2400 km
major axis and a 2050 km minor axis in a recent study
[1]. The basin impact is very large, so it has been suggested that most of the crustal material within the SPA
was excavated [2], or in other words, it is possible that
the mantle materials have been exposed within the
basin. However, the mantle materials may not be exposed everywhere inside the basin. Therefore we investigated the central area of the basin because the
basin excavation was the deepest in the central area
and offers a high probability that the mantle materials
are exposed. However, because the basin impact is
very large, the materials in the central area should have
melted [e.g., 3]. A previous study using a numerical
simulation of the formation of the SPA indicated that
the impact melt generated by the SPA basin impact and
mantle material melted to about a 700 km depth [4]. A
previous study determined that the final depth of the
impact melt after basin transition was about 50 km [5].
Therefore, exposed mantle materials in the central area
of the basin would have melted. Mineralogical and
geological understanding of the SPA interior is limited
because it is one of the oldest basins (pre-Nectarian in
age [6]), and its surface has become obscured by intensive cratering and mixing since its formation. Therefore, it is hard to identify areas where the impact melt
has been exposed. However, we used a new mineralogical map based on high-spatial-resolution reflectance
spectra using the SELENE (Kaguya) Multiband Imager (MI) [7]. In our previous research, we identified a
central depression where the impact melt of the SPA
had pooled (162.6°E, 53.7°S, 315 and 343 km radius)
[8]. However, in [8], we still had not identified the
location of exposed impact melt on the basin surface.
Now, we use new spectral data from MI to investigate
the distribution of the impact melt.
Methods: It is suggested that high-Ca pyroxene
(HCP) dominant area expand in the central area of
SPA, and it is possible that this area is impact melt [8].
However, previous studies have suggested that a ‘cryptomare’ expanded within the center of the SPA basin
[9], and the pyroxenes of mare basalt have high-Ca
composition [10]. Thus, we should identify the distribution of HCP layer. And we distinguished between
mare and impact melt by estimating the area, thickness
and chemical abundance of the respective layers.
Seven thousand Kaguya MI map data files [7] with
a spatial resolution of 14 m/pixel are used to generate a
binned low-resolution MI reflectance map (237
m/pixel) within the center of the SPA basin (around the
central depression from [8], at 40 to 70°S and 140 to
220°W). The wavelength assignment of MI provides
both visible and near-infrared coverage in spectral
bands of 415, 750, 900, 950, 1000, 1050, 1250, and
1550 nm. Mineral phases have diagnostic absorption
features, depending on the minerals. We made a color
composite image from these data (RGB map). The
colors were assigned to continuum-removed absorption
depths to generate these images: red for 900 nm (LowCa pyroxene (LCP)), green for 1050 nm (olivine or
HCP), and blue for 1250 nm (plagioclase). In addition,
we made iron (FeO) and titanium (TiO2) abundance
maps using the Lucey method [11] on the MI data [12].
Next, we drew an illustration of the compositional diversity of the rock types based on these maps and the
spectral band centers within the area of this study
based on pyroxene data from the laboratory [13]. First,
we classified the spectra roughly into pyroxene and
plagioclase. Second, we classified the pyroxene layers
by band center and depth of spectra, iron and titanium
abundance, and topography. We estimated the thickness of each rock type layer. We observed the walls
and floors of small craters that can be clearly recognized (i.e., exceeding 6 km in diameter) and confirmed
which layer was exposed. We noted the distribution of
these craters to estimate the area of each layer.
Results: Figure 1 represents part of the area that
we investigated in this study. Here we present the RGB
map (Fig. 1a) and FeO abundance map (Fig. 1b) that
we used to determine the distribution of rock types
(Fig. 1c). For instance, both two orange areas in Fig.
1a (white and black arrow) have low-Ca pyroxene
composition spectrally but the area indicated black
arrow is higher FeO abundance than the area indicated
white arrow, and locates a central peak; therefore, we
suggest that these two areas are different layers. In this
way, we classified the rock types for six layers (orange,
green, yellow, white, red, and blue). Orange represents
the dominant LCP layer that is located around the central depression [10], green represents the HCP dominant layer located within the depression, and yellow
represents an HCP dominant layer that has deeper absorption at 1050 nm and tends to have longer wavelengths in the band center. The yellow layer has higher
iron content (about 14 wt%) than the green layer locat-
46th Lunar and Planetary Science Conference (2015)
ed within the depression. The white layer has even
longer wavelengths in the band center and higher iron
content than the yellow layer (most of the band centers
are greater than 1000 nm, and the iron content is more
than 15 wt%) and is located within and around relatively large craters. The red layer is an LCP dominant
layer in the central peaks of the large craters formed
after the SPA basin impact. The navy blue layer is plagioclase.
We estimated the thicknesses of these layers based
on the diameter and depth of the small craters and the
original depth of the central peaks. From these results,
orange layer thickness was estimated to be about 1.5
km in the central depression, the green layer was estimated to be about 6-7 km thick, and the yellow layer
was estimated to be about 2 km. The red layer is at
least 8 km thick, based on the diameters of the smallest
and largest craters that have central peaks of the red
layer. In terms of stratigraphy, we estimated from
small craters that a green layer presents under orange,
white and yellow layers, and the area of green layer is
estimated at least 300,000 km2. The red layer presents
under the green layer.
Discussion: We estimated the origins of each layer.
The orange layer (LCP layer) is interpreted to be mantle material ejected when the SPA basin formed. Because, from multiple observations, we found that this
layer is consistent with the expanded mantle material
found all over the SPA basin in a previous study [8].
The green layer (HCP layer) is the impact melt of the
SPA basin. There are multiple reasons for this interpretation. If this layer is a monolith, it is larger and thicker
than the mare basalt anywhere on the Moon in previous studies [14, 15, 16]. In addition, the average FeO
abundance is 2 wt% lower than that of mare basalt [17].
From these reasons, it is possible that this layer is not
1687.pdf
mare basalt, but rather is impact melt that pooled during formation of the SPA. The white layer is mare basalt. This layer location was approximately correlated
with mare basalt observed in a previous study [18].
The yellow layer is a mixture of ancient mare basalt
that erupted much earlier than the white mare basalt
and the surrounding impact melt and/or mantle material ejecta. The green layer is much thinner than the 50
km impact melt of SPA inferred in previous studies [5],
and the red layer (i.e. an LCP layer under the green
layer) is different to the orange layer (upper mantle
material) in FeO and TiO2 abundances. Therefore, we
interpret that the impact melt of the SPA is differentiated into the green layer and red layer.
Our study demonstrated the presence and distribution of impact melt generated by SPA impact event
within the central part of the basin, and that the impact
melt is differentiated into HCP and LCP layers.
References: [1] Garrick-Bethell and Zuber (2009) Icarus, 204, 399–408. [2] Spudis et al. (1994) Science, 266,
1848-1851. [3] Melosh. (1989), Impact Cratering: A Geologic Process, Oxford Univ.Press, London. [4] Lucey et al.
(1998) JGR, 103, NO. E2, 3701-3708. [5] Vaughan et al.
(2014) PSS, 91, 101-106 [6] Wilhelms et al. (1979) USGS
special, report I-1162, [7] Ohtake et al. (2008) EPS, 60, 257–
264. [8] Ohtake et al. (2014) GRL, 41, 2738–2745. [9] Pieters et al. (2001),JGR, 106, E11, 28,001-28,022. [10] Heiken
et al. (1991), Cambridge University Press, 753p. [11] Lucey
et al. (2000) JGR, 105, 20,297- 20,305. [12] Otake et al.
(2012) LPSC,1905. [13] Klima et al. (2011) MPS, 46, Nr 3,
379–395. [14] Hiesinger et al. (2010) 115, E03003. [15]
Williams and Zuber (1998) Icarus, 131, 107–122. [16]
Thomson et al. (2009) 36, L12201. [17] Jolliff et al.(2000),
JGR, vol.105, No.E2, 4197-4216. [18] Head and Wilson.
(1992) GCA, 56, 2155-2175.
Fig. 1 Part of the area that we investigated in this study: RGB map (a), and FeO abundance map (b). We used these data to illustrate the distribution of rock types (c). (Regarding (c), orange is the mantle material, green is the upper impact melt, yellow is a mixture of impact melt and/or
mantle material and mare basalt, red is the lower impact melt, and blue is crustal material.)


© Copyright 2026