
CRATER BOUGUER ANOMALIES PROBE SOUTH - USRA
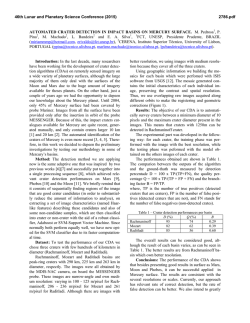
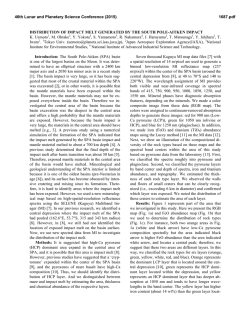
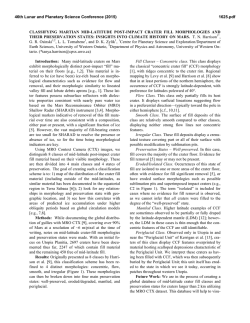
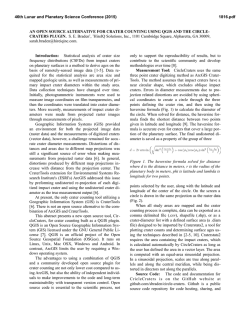
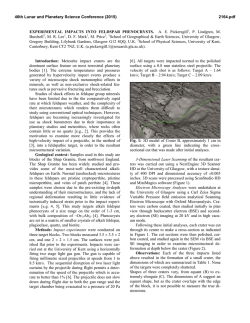
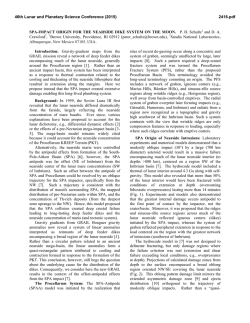
46th Lunar and Planetary Science Conference (2015)
2897.pdf
CRATER BOUGUER ANOMALIES PROBE SOUTH-POLE-AITKEN (SPA) BASIN STRUCTURE.
Roger J. Phillips1, Carver J. Thomason2, James W. Head III3, Jason M. Soderblom4, Francis Nimmo2, Jonathan Besserer5, H. Jay Melosh6, Colleen Milbury6, Walter S. Kiefer7, and Maria T. Zuber4. 1Planetary Science Directorate,
Southwest Research Institute, Boulder, CO 80302, USA ([email protected]); 2Dept. of Earth and Planetary
Sciences, University of California, Santa Cruz, CA 95064, USA; 3Dept. of Earth, Environmental and Planetary Sciences, Brown University, Providence, RI 02912, USA; 4Dept. of Earth, Atmospheric and Planetary Sciences, Massachusetts Institute of Technology, Cambridge MA 02139,USA; 5Laboratoire de Planétologie et Géodynamique de
Nantes, Université de Nantes, France; 6Department of Earth, Atmospheric, and Planetary Sciences, Purdue University, West Lafayette, IN 47907, USA; 7Lunar and Planetary Institute, Houston, TX 77058, USA.
Introduction. One of the primary objectives of the
Gravity Recovery and Interior Laboratory (GRAIL)
mission [1] was to use the Bouguer gravity signals of
impact craters to not only learn about the subsurface
disposition beneath craters (e.g., extent of brecciation),
but also to use these crater gravity signals as probes
into the structure of the crust and upper mantle. Such
investigations will help us to better understand the interplay of competing processes (e.g., impacts, magmatism) during the evolution of the outer part of the
Moon.
Here we examine the spatial distribution of complex crater Bouguer anomalies (BA), with a particular
emphasis on contrasting gravity anomalies in the South
Pole-Aitkin (SPA) basin with their counterparts in the
lunar highlands. We also examine the statistical behavior of crater BA as a function of crater diameter (D)
and background regional porosity (ϕ), contrasting behavior within and outside SPA.
Context. We examine complex craters over the diameter range 30 to 150 km – the low end a practical
resolution limit and the high-end selected to avoid effects of mantle uplift. BA signals associated with complex craters are generally messy largely due to contributions from other geological structures. Examining
ensembles of craters, either spatially or statistically,
reveals trends that provide insight into the origin of the
BA signal, particularly when filters are applied to remove the geologically noisiest craters from the data
[2]. Although BA signals are scattered when plotted
against diameter, trends emerge that are statistically
meaningful. This includes a negative linear slope in
BA-D plot (Figure 2), indicating that as a global ensemble, the BA reflects a D-dependent mass deficiency, and a break in slope (beyond the data range in Figure 2) that may be indicative of the depth of fracture
closing in the crust [3]. Still, there is abundant scatter
in this relationship and for almost any diameter there
are both positive and negative anomalies. Using hydrocode simulations, Milbury [4] showed that such
scatter is directly related to the background porosity
that hosts the impact. Additionally, bulk density and
porosity as a function of depth have been derived from
localized spectral admittances [5], and these results
influence the work presented here. Finally, spectral
studies have recently focused on SPA to test specific
models of vertical density structure [6], including the
necessity of a large melt sheet [7].
Results. Figure 1 plots BA against porosity inside
and outside SPA. There is a statistically significant
(see Table 1) positive trend outside of SPA [3], as predicted by [4], and no such trend in the SPA data, which
is limited to low
porosities.
Figure 1. Scatter
plot of BA vs. porosity inside (magenta) and outside
(yellow)
SPA,
with, respectively,
black and white
95%
confidence
bands on a linear fit. Porosity, ϕ, was determined from a
grain density, ρg, model [8] and a bulk density model [5],
ρb(z) = ρsurf + Δρ(1- e-z/d), where d is the e-folding depth and
Δρ is the fractured-unfractured density contrast. Mean values
of ϕ , for z = 5 km, were estimated in an annulus between D
and 1.5D surrounding each crater. Thus the background (regional) porosity is a crater property.
Depth, z (km)
BA vs. ϕ
Outside SPA slope
Outside SPA p-val.
Inside SPA slope
Inside SPA p-val.
5
0.92
2.2E-28
0.12
3.9E-01
7.5
0.79
6.9E-28
-0.25
3.8E-01
10
0.73
1.2E-25
-0.63
3.2E-01
Table 1. Statistical results of linear fits of BA vs. ϕ. Slope
units are mGal/porosity. The p-value tests the null hypothesis that the slope is zero.
The BA-D relationship (Figure 2) shows that the
magnitude of the negative slope in SPA is 2.5 times
that of the rest of the Moon (Table 2). This is easy to
understand given the low values of ϕ in SPA. If the
BA-D relationship can be expressed as a power law,
then the Bouguer anomaly is given by gB = CΔρDn,
where C and n are constants and Δρ is the density con-
46th Lunar and Planetary Science Conference (2015)
trast between the crater’s subsurface and the surrounding terrain. If Δϕ is the corresponding porosity contrast, the BA-D slope is dgB/dD = nCρgΔϕDn-1, where
ρg is the grain density. Given the dominance of low
porosities (Figure 1), Δϕ values in SPA are large relative to the rest of the Moon and the increased slope is
expected (Figure 2).
Figure 2. Scatter
plot of BA vs. D
inside (magenta)
and outside (yellow) the SPA,
with, respectively, black and
white 95% confidence bands.
Slope: BA vs. D
Outside SPA
Inside SPA
-0.13
-0.32
2897.pdf
Path Forward. Our working hypothesis is that the
post-SPA formation impact energy flux had declined to
the point of inducing “little” dilatancy into the extant
rock mass, thus explaining the low porosity and BA vs.
D in SPA. Furthermore, we propose that the SPA formation event itself was effective at removing existing
dilatancy (e.g., formation of a thick melt sheet). Our
path forward is to model the Bouguer signals for individual craters employing vertical density variations
beneath both the crater and in the surrounding terrain.
Additionally, we will convolve dilatancy models [9]
with bombardment models [e.g., 10] in an attempt to
constrain the relative timing of SPA formation and the
lunar bombardment history.
p-values
Outside SPA
Inside SPA
1.3E-33
3.7E-09
Use regional value in Bouguer correction:
Outside SPA
-0.11
Outside SPA
1.6E-23
Inside SPA
-0.27
Inside SPA
1.2E-05
Table 2. Statistical results of linear fits of BA vs. D. Bouguer
anomalies in the work presented here were calculated using a
single global density (2.56 Mg/km3) for the Bouguer corrections. The bottom two rows show that using the regional
value surrounding a crater for the correction leads to a small
change in the results. Slopes are mGal/km.
Figure 3 shows the spatial distribution of impact
craters in our 4000+ crater database that fall within the
diameter range 30–150 km, that survived a geological
noise filter, and that have BA magnitudes > 10 mGal.
The are plotted over a map of porosity (z = 5 km [5])
and color-coded for anomaly sign (+ = magenta, – =
green). There is a clear association of –BA with regions
of low porosity as expected from Figure 1 and as predicted from hydrocode simulations [4]. There is nothing particularly unique about SPA, meaning that there
are spatially coherent regions in the highlands that are
dominated by –BA and are associated with low porosity.
As Besserer et al. [5] emphasized, what sets SPA
apart from the highlands is a thinner (smaller e-folding
depth, d) low density layer. This can be seen in Figure
4, which shows the crater distribution over a map of
bulk density at 5-km depth. Clearly at this depth, the
SPA rocks are closer to their unfractured state than
those of the highlands. As adopted to point crater
properties, the linear bulk density vertical gradient [5]
in SPA is on average 50% higher than elsewhere.
Figure 3. BA crater locations coded for anomaly sign (+ =
magenta, – = green) superposed on a porosity map [5] at 5km depth. Magenta circle indicates SPA basin. Sinusoidal
projection; 180°E at center of map.
Figure 4. BA crater locations coded for anomaly sign (+ =
magenta, – = green) superposed on a bulk density map [5] at
5-km depth. Sinusoidal projection; 180°E at center of map.
References: [1] Zuber M. T. et al. (2013) Science 339, 668–671.
[2] Thomason C. J. et al. (2015) JGR Planets, in prep. [3] Soderblom
J. M. (2015) Nature, submitted. [4] Milbury C. et al. (2015) LPSC
46, Abs. #1966. [5] Besserer J. et al. (2014) Geophys. Res. Lett. 41,
5771–5777. [6] Ertel A. (2014) AGU Fall Meeting, paper G22A-04.
[7] Vaughan W. M. and Head J. W. III (2014) Planet. Space Sci., 91,
101-106. [8] Wieczorek M. A. et al. (2013) Science 339, 671–675.
[9] Collins G. S. (2014) JGR Planets 119, doi:10.1002/
2014JE004708. [10] Morbidelli A. et al. (2012) EPSL 355-356
(2012) 144–151.


© Copyright 2026