
Identification and Detection Limits of Perchlorate
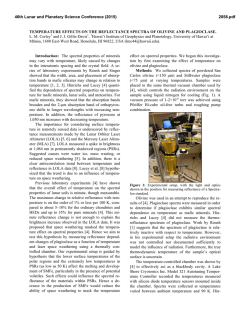
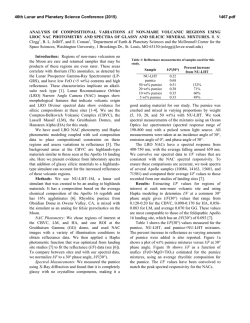
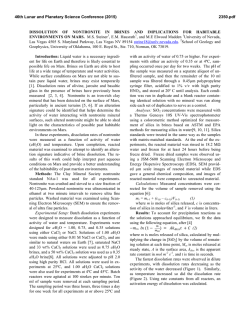
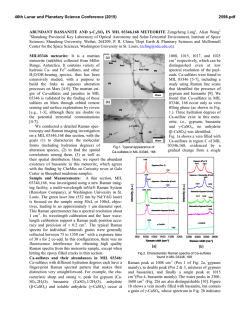
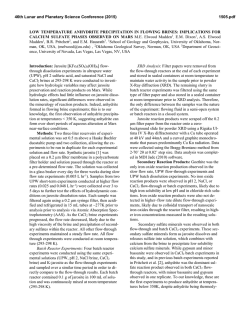
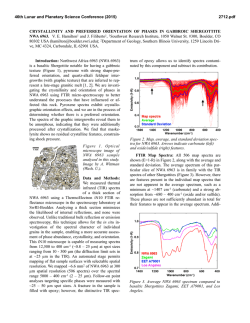
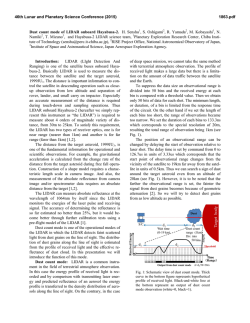
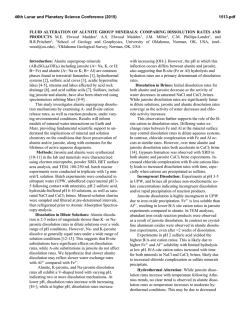
46th Lunar and Planetary Science Conference (2015) 2710.pdf IDENTIFICATION AND DETECTION LIMITS OF PERCHLORATE-CHLORATE IN MIXTURES BY VIBRATIONAL SPECTROSCOPY. Zhongchen Wu1,2, Alian Wang2 , Zongcheng Ling1, Jiang Zhang1, Bo Li1 and Yuheng Ni1. 1Institute of Space Science, Shandong University & Shandong Provincial Key Laboratory of Optical Astronomy and Solar-Terrestrial Environment, Shandong University, Weihai 264209, China; 2Dept. Earth and Planetary Sciences and McDonnell Center for the Space Sciences, Washington University, St. Louis, 63130, USA; ([email protected]) Perchlorates on Mars: Phoenix lander WCL experiment measured 0.6 wt% of perchlorate (ClO4−) in martian soil at Polar Region (68°N) with approximate Ca(ClO4)2:Mg(ClO4)2 ~6:4 [1, 2]. The existence of perchlorate were also inferred at Gale Crater (4.5°S) [3] and at two Viking landing sites (22.5°N, 48.3°N) [4].Various formation pathways of perchlorate are under extensive investigation, including gas-phase photochemical reaction in atmosphere, electrostatic discharge, and gas-solid reactions [8]. Based on gasphase photochemical reaction model, ClO4− should be globally distributed and mixed (as solid) in top tens of centimeters of the Martian surface regolith [5]. Chlorate (ClO3-) which always associate with perchlorate are much stable [6], making them likely to be present on Mars as well [7]. As precursors to the formation of ClO4−, hypochlorite (ClO-) and chlorite (ClO2-) may be present in limited quantities [8]. On the other hand, perchlorates and chlorates are highly hydroscopic, with solubility in H2O to be 3-5 times of those of chlorides. In addition, they have extremely low eutectic temperature (Ca(ClO4)2.6H2O, 198.6 K; Mg(ClO4)2.6H2O, 204 K) [9]. By absorption of atmospheric water vapor or undersurface liquid water, perchlorate brines are considered to stable under Mars relevant temperature [10]. Because of above properties, perchlorates and chlorates can play an important role in the current hydrological cycles on Mars. Determining their existence by orbital remote sensing at specific locations and by in situ analysis during surface exploration can have potential implications for the habitability evaluation. For that purpose, we need to establish a good understanding of the spectroscopic characters of perchlorates and chlorates, in forms of aqueous brines and solid mixtures. Here, we present a study on spectral characterization and detection limits of those materials, using MIR reflectance and Raman spectroscopy selected on the basis of their broad applications for planetary explorations. Samples and Spectrometers: Three sets of samples were prepared. First set is pure chemicals (analytical grade) of Mg(ClO4)2, Mg(ClO4)2.xH2O, Mg(ClO3)2, NaClO4, NaClO3, and NaClO2. The second set is aqueous solutions (in deionized water) of those chemicals at pre-determined ClO4- or ClO3- concentrations. The third set is solid mixtures of those chemicals with dry pumice powder (200μm). The solid mixtures were made in three steps to reach the homogeneity: (1) mixing the aqueous solution of those chemicals with pumice powder; (2) baking the mixtures at 100 °C for 24 Hours; (3) grinding the mixtures at room T. Pure chemicals of perchlorates and chlorates were measured on a Kaiser Hololab5000 Raman system, using a cw green laser (523 nm) for excitation, and a F/2 spectrometer (with similar optical performance of MMRS/CIRS, developed for planetary missions) for Raman signal collection. All three sets of samples were measured on an MIR spectrometer, a Bruker FTIR VERTEX 70 with a DLATGS detector under ambient conditions. For each spectrum, 128 scans were accumulated in the spectral range of 4000-600 cm-1 with a resolution of 4cm-1. For brine samples, we designed and fabricated a large diameter sample cup (i.d. 23.6 mm, depth 8.2 mm) to eliminate the curved surface of brines for improving the spectral measurement repeatability. Perchlorate and chlorate phase identifications: Figure 1 Characteristic Raman spectra of pure oxygenbearing chloride: P1:NaClO2; P2: NaClO3; P3: NaClO4; P4: Mg(ClO4)2; P5 Mg(ClO4)2xH2O; Figure 1 shows the finger-print Raman spectra of analyzed perchlorate and chlorates species. The symmetric stretching mode (v1) of ClO2 – ( 804 cm-1) and ClO3 – (935 cm-1) are much different from ClO4 – which shifts from 953 cm-1 to 983 cm-1 among the various cations. It demonstrated straightforward phase 46th Lunar and Planetary Science Conference (2015) identification can be reached, to distinguish ClO4 from ClO3, ClO2, and Mg from Na, also possible to identify their hydration degrees. Clearly, Raman spectroscopy is well suited for in-situ identification of perchlorates and chlorates on Mars. Figure 2 Characteristic MIR reflectance spectra: (A) brines: L1:NaClO4 (0.5 mol/L of ClO4); L2: Mg(ClO4)2(0.5 mol/L of ClO4); L3: NaClO3(0.5 mol/L of ClO3); L4: Mg(ClO3)2 (0.5 mol/L of ClO3); L5: deionized water; (B) solid mixtures:S1:NaClO4(0.5 wt% of ClO4 ); S2: Mg(ClO4)2(5wt%); S3:NaClO3(5wt%); S4: Mg(ClO3)2(5wt%); S5: pumice powder(200μm); Figure 2A shows the MIR reflectance spectra from brines. Figure 2b shows the MIR reflectance spectra from solid mixtures. Clearly, there are characteristic spectral peaks that would enable the identification of perchlorates and chlorates, though their spectral signatures are only slightly different from the backgrounds. In Figure 2 A, The asymmetric stretching vibration 3 of ClO4- and ClO3- group are located at 1140cm-1 and 1010cm-1. For solid mixtures (Fig. 1B), the absorption features around 2048 cm-1, 1880cm-1 are assigned to the first overtone of ClO4and ClO3- [11]. It appears that the cation species (i.e. Na+, Mg2+) have no obvious influences on both strength and position of characteristic peaks of ClO4and ClO3- in MIR reflectance spectra. The double peaks near 2400 cm-1 is from CO2 in laboratory atmosphere. Limits of Detection (LOD) by MIR reflectance: These unique and unoverlapped IR peaks permit precise quantitative analysis of these perchlorate-chlorate salts. As an example, first-order derivative was used to effectively eliminate to spectral baseline fluctuations of NaClO4 brines spectrum (Figure 3B and Figure 3C). The limit of detection (LOD), which is defined as three times the standard deviation of the noises, was calculated. The results of all samples were listed in Table 1. Assuming the potential brines on Mars would be 2710.pdf saturated and even supersaturated [12], the LOD for brines is good enough for brine identification. The LOD of soil samples is also better than the recorded abundance values (i.e., at Phoenix landing site and Gale Crater), but was a little poorer than that of liquid samples, because of the , matrix interferences and much weaker overtone signals. Figure 3 Quantitative analysis of NaClO4 signals from in aqueous brines. (A)The correlation between the signal intensity and the ClO4- concentration in brines, with the regression line;(B)The raw reflectance spectra of NaClO4 aqueous brines; (C) the first-order derivative spectral peak of NaClO4 ; Composition Concentration R2 LOD range Solution samples Soil samples ClO4ClO3ClO4ClO3- 0.05~0.30 (mol/L) 0.05~0.30 (mol/L) 0.5~8.0(wt%) 0.5~8.0(wt%) 0.98 0.99 0.91 0.89 0.01 (mol/L) 0.03 (mol/L) 0.31 (wt%) 0.2 3(wt%) Table 1 Detection results of perchlorates-chlorates using IR reflectance spectra. The coefficient of determination (R2) is the squared value of linear correlation coefficient (R). Future works: The spectral features in Raman and MIR reflectance spectroscopy will be used for in situ investigation of perchlorate formation pathway in a Mars environmental chamber. Acknowledgements: This work was supported the National Natural Science Foundation of China (21245005, 41473065, 41373068, U1231103). Financial support from the McDonnell Center for Space Sciences at Washington University in St. Louis (for AW) is greatly appreciated. References :[1] Gough R.V. et.al. (2014) EPSL, 393,73–82. [2] Hecht M.H. et al.(2009) Science, 325 (5936), 64–67. [3]Glavin, D.P. et.al.(2013),JGR, 118(10)1955-197.[4]Navarro-González.et.al.(2010) JGR, 115, E12010. [5]Alfonso F. D. et. al.(2013) J. Astrobiol 12 (4), 321–325. [6]Kang N. et al. (2006) ACA, 567, 48-56. [7]Hanley J. et al. (2012) GRL, 39, L08201. [8] Catling D. C. et al. (2010) JGR, 115, E00E11. [9]Chevrier,V.F., et. al. (2009) GRL,136, L10202. [10] Marion, G.M., et al. (2010) Icarus 207, 675–685. [11] George B. el. al. (1970),Can.J.Chem. 48, 2096-2103. [12]Gough R.V. et.al. (2011) EPSL,312,371–377.

© Copyright 2026